Trader’s Notebook

3:30 p.m. New York time

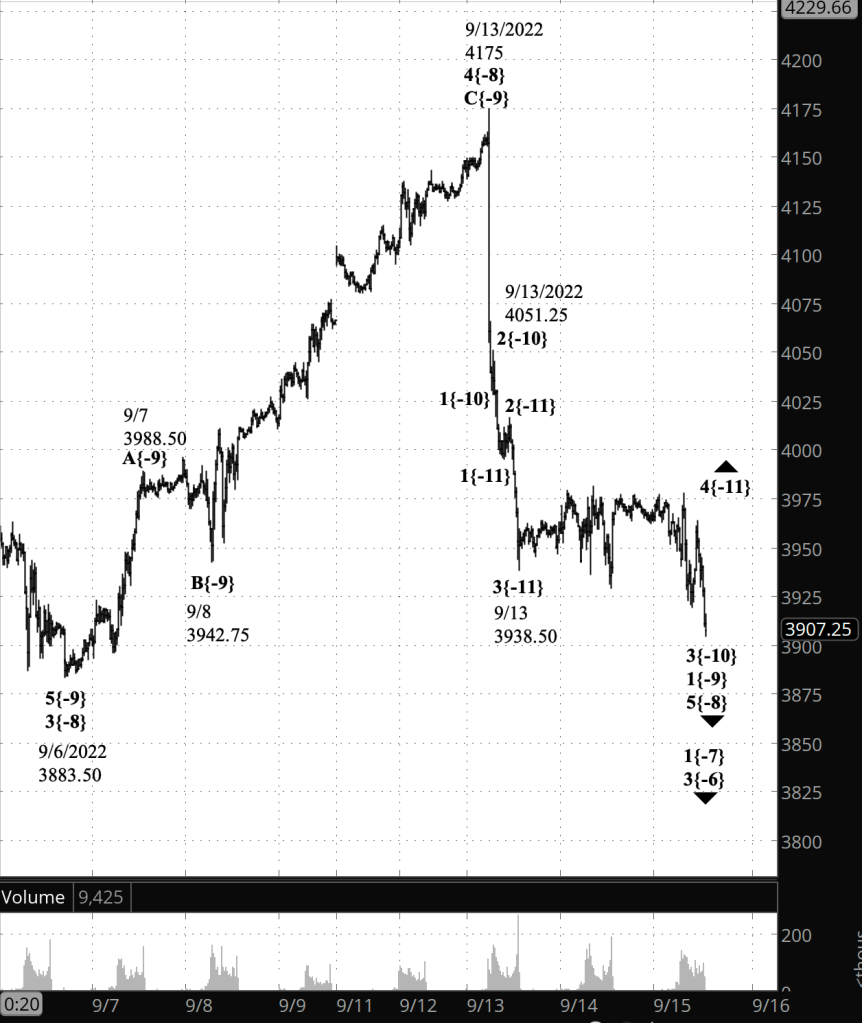
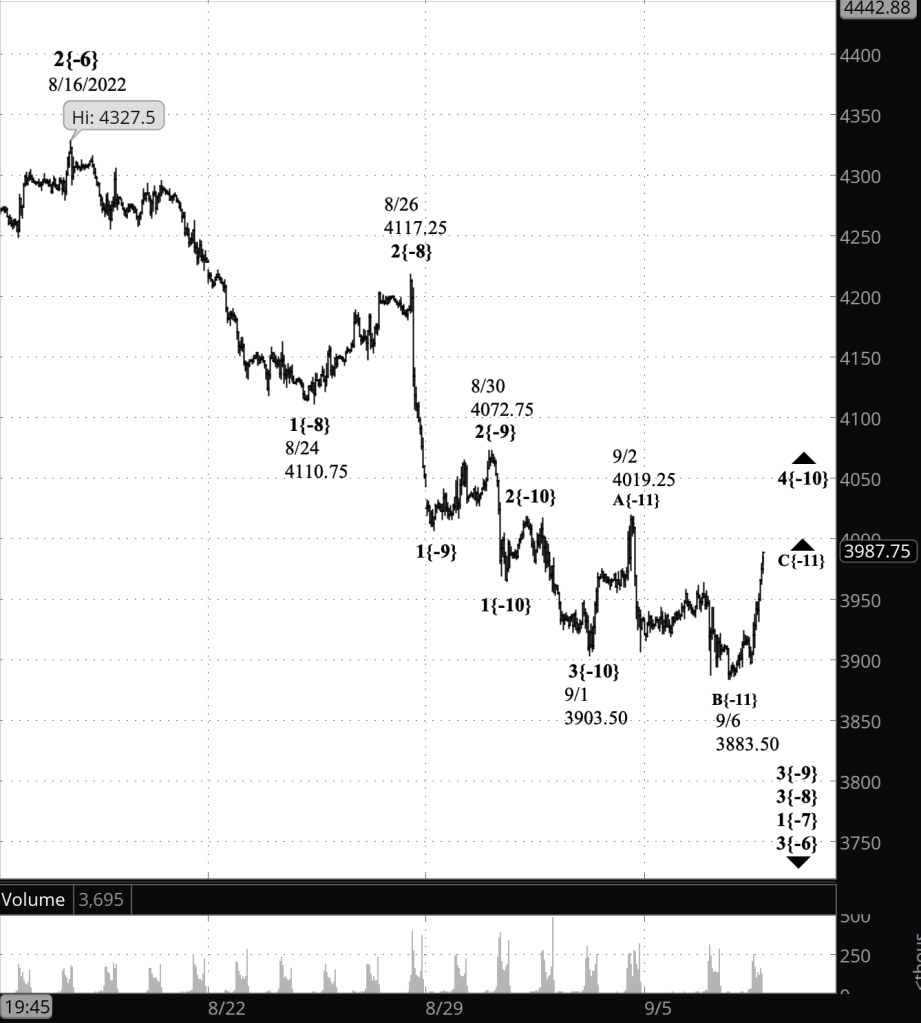
Half an hour before the closing bell. The S&P 500 has moved below the overnight low, to 3905 on the futures. The waves on the chart have a disproportionate feel as I’ve labeled them, which is the most likely analysis that I’m able to see. The internal patterns are unclear. It happens. Eventually, the chart regains its clarity.

So this afternoon’s analysis is this: Just as was the case overnight, wave 4{-11} reached a new low, and that low could mean that wave 4{-11} ended at its high point, 3977.50, attained during today’s session. If that high was indeed the end of wave 4{-11}, then wave 5{-11} is underway and will carry the price lower. If not, then we’re still in wave 4{-11}. I’ve updated the chart.

9:35 a.m. New York time

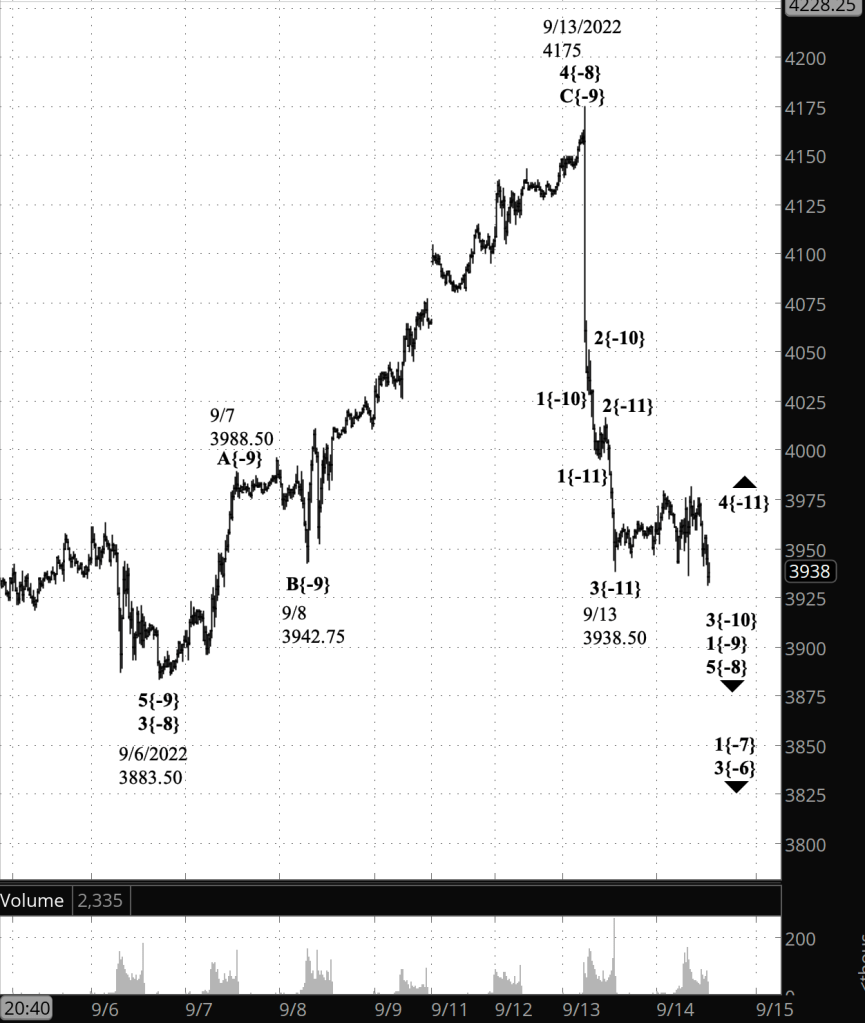
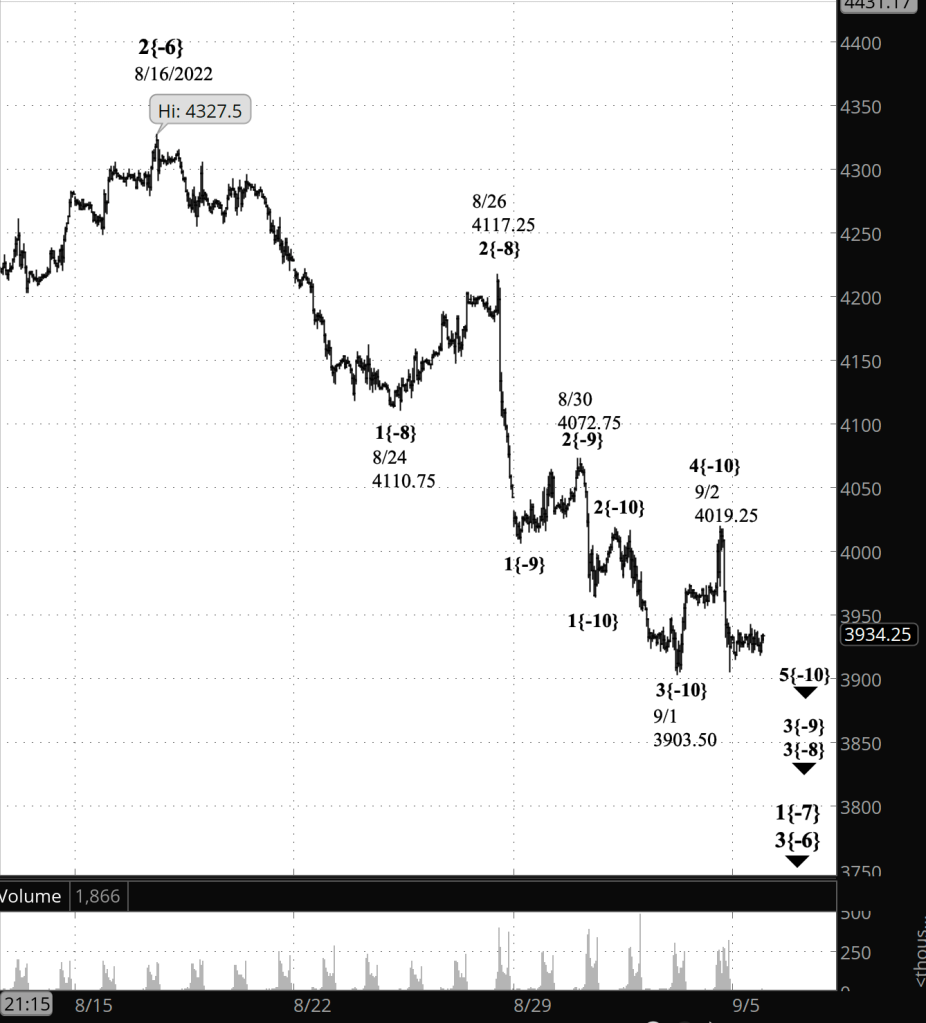
What’s happening now? The S&P 500 E-mini futures continued to trade in a narrow range overnight, remaining within the high and low of the day before, 3981.25 and 3929.

What does it mean? An upward correction that began on September 13 continues. When it is complete, the downtrend that began on that same day will resume. At this point we’re fishing for an end to the correction. Any new low can mean that the prior high in the correction marked its end and that the downtrend has resumed. The September 13 start of the downtrend came within a larger uptrend that began the same day and that followed a larger upward correction that began on September 6.

Whether it’s the principal analysis or an alternative, this is all happening within a major downtrend that began on January 4.

What is the alternative? It’s possible that the larger upward correction is still underway. Under this scenario, the September 13 high is the end of the first leg of the correction, the subsequent decline — still underway — is the correction’s middle leg, and a future rise that will approach or exceed the September 13 high will be the end of the correction.

[S&P 500 E-mini futures at 3:30 p.m., 20-minute bars, with volume]

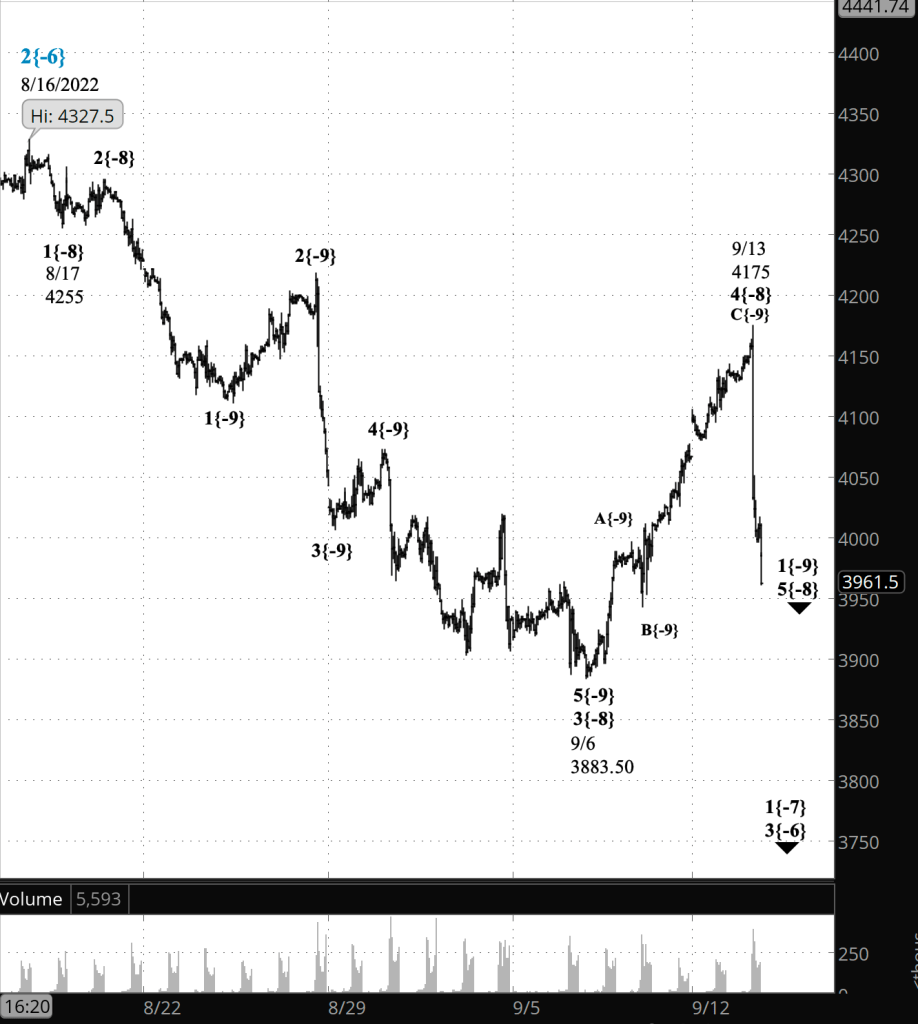
What does Elliott wave theory say? Under the principal analysis, wave 4{-11}, an upward correction within downtrending wave 3{-10}, is underway. It will be followed by downtrendng wave 5{-11}, which will complete wave 3{-10} and will be followed by a larger uptrending correction, wave 4{-10}, and then a larger downtrending wave, 5{-10}, which will complete its parent wave, wave 1{-9}, whose starting point on September 13 was the beginning of the swift one-day decline that followed publication of the government’s most recent inflation figures.

This is all happening within wave 5{-8}, which is a downward reversal that began on September 13.

The present tangle of waves illustrates the fractal nature of any stock chart. Each wave has subwaves and in turn is itself a subwave of a larger wave. And whatever the level, whatever the degree, those waves all follow the same patterns.

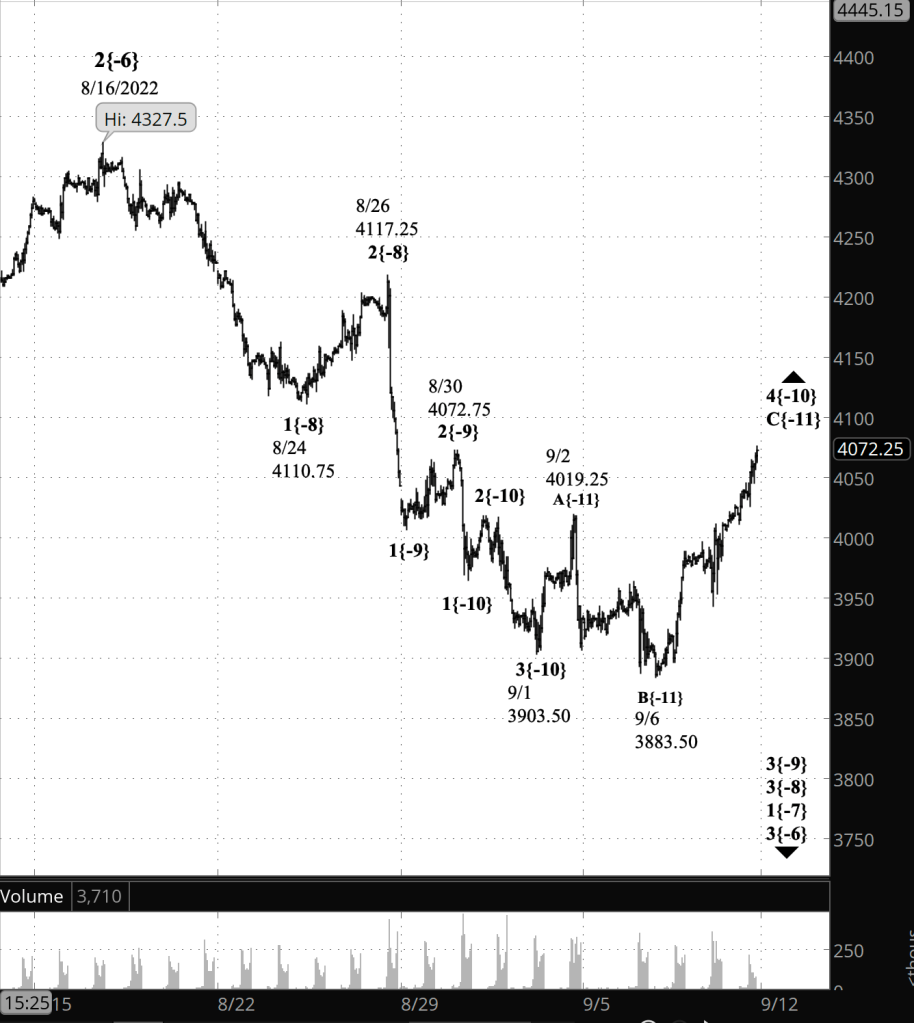
Under the alternative analysis, wave 4{-8}, an upward correction that began on September 6, is still underway and is in wave B{-9}, its descending middle wave that began on September 13. It will be followed by rising wave C{-9}, which will probably be the end of the correction and which may exceed the September 13 high.

All of that is occurring within a series of downtrending waves, ranging in size from the smaller, wave 1{-7}, which began on August 16 from 4325.25, to wave 1{-2}, five degrees larger, which began on January 4 from 4818.62.

So if someone asks, “How’s the market doing?”, the short answer is, “Falling”. And I might add, “As it has all year.”

We Are Here.

These are the waves currently in progress under my principal analysis. Each line on the list shows the wave number, with the subscript in curly brackets, the traditional degree name, the starting date, the starting price of the S&P 500 E-mini futures, and the direction of the wave.

  • S&P 500 Index:
  • 5{+3} Supercycle, 7/8/1932, 4.40 (up)
  • 5{+2} Cycle, 12/9/1974, 60.96 (up)
  • 5{+1} Primary, 3/6/2009, 666.79 (up)
  • 5{0} Intermediate, 12/26/2018, 2346.58 (up)
  • 4{-1} Minor, 1/4/2022 4818.62 (down)
  • 1{-2} Minute, 1/4/2022 4818.62 (down)
  • S&P 500 Futures and index:
  • 1{-3} Minuette, 1/4/2022, 4808.25 (down) (futures), 4818.62 (down) (index)
  • S&P 500 Futures:
  • 1{-4} Subminuette, 1/4/2022, 4808.25 (down)
  • 1{-5} Micro, 1/4/2022, 4808.25 (down)
  • 3{-6} Submicro, 8/16/2022, 4325.25 (down)
  • 1{-7} Minuscule, 8/16/2022, 4325.25 (down)
  • 5{-8} Subminuscule, 9/13/2022, 4175 (down)

Learning and other resources. Elliott wave analysis provides context, not prophecy. As the 20th century semanticist Alfred Korzybski put it in his book Science and Sanity (1933), “The map is not the territory … The only usefulness of a map depends on similarity of structure between the empirical world and the map.” And I would add, in the ever-changing markets, we can judge that similarity of structure only after the fact.

See the menu page Analytical Methods for a rundown on where to go for information on Elliott wave analysis.

By Tim Bovee, Portland, Oregon, September 15, 2022

Disclaimer

Tim Bovee, Private Trader tracks the analysis and trades of a private trader for his own accounts. Nothing in this blog constitutes a recommendation to buy or sell stocks, options or any other financial instrument. The only purpose of this blog is to provide education and entertainment.

No trader is ever 100 percent successful in his or her trades. Trading in the stock and option markets is risky and uncertain. Each trader must make trading decisions for his or her own account, and take responsibility for the consequences.

License
Creative Commons License

All content on Tim Bovee, Private Trader by Timothy K. Bovee is licensed under a Creative Commons Attribution-ShareAlike 4.0 International License.

Based on a work at www.timbovee.com.

Trader’s Notebook

3:30 p.m. New York time

Half an hour before the closing bell. The S&P 500 has traded in a narrow range during the session, swinging between the 3970s and the 3920s on the futures. Any new low could mean that the upward correction, wave 4{-11}, has ended, and downtrending wave 5{-11} is underway. Meanwhile, no change in the analysis. I’ve updated the upper, close-up chart.

9:35 a.m. New York time

What’s happening now? The S&P 500 E-mini futures reached into the 3930s yesterday and then switched to a shallow rise that so far has returned the price to the 3970s.

What does it mean? The downtrend that began on September 13 continues. It is now in its middle segment, which internally is in an upward correction that will be followed by a further decline. That larger middle segment, in turn, will be followed by a larger upward correction, and then an even deeper decline.

The further the price declines, the more likely this scenario becomes. The key price level is the September 6 low, 3883.50, the starting point of the upward correction. A drop below that level gives this principal analysis greater credibility.

What is the alternative? It’s possible that the decline that began on September 13 is the middle leg of an ongoing upward correction that began on September 6. If that proves to be the case, then there will be a return to a rising price soon that will likely exceed the September 13 high, 4175. A reversal above the September 6 low, 3883.50, gives this alternative analysis greater credibility.

The charts. The upper chart, showing the S&P 500 E-mini futures, focuses is on the decline that began on September 13 and the upward correction that preceded it, showing the internal count. The lower chart, showing the S&P 500 index, puts the price rise from October 30, 2020, the end of the early pandemic crash, into a larger context.

[S&P 500 E-mini futures at 3:30 p.m., 15-minute bars, with volume]
[S&P 500 index, daily bars]

What does Elliott wave theory say? Under the principal analysis, the September 13 peak, 4175, was the end of wave 4{-8}, an upward correction, and the beginning of wave 5{-8}, a downtrend, the final wave within wave 1{-7}, which began on August 16. Wave 4{-8} began on September 6 from 3883.50, and that’s a key level in judging the nature of the decline since September 13. The further the price falls bellow 3883.50, the more likely the principal scenario becomes. Under this scenario, wave 5{-8} internally is in wave 1{-9}, which in turn is in wave 3{-10}, and which in turn is within wave 4{-11}, its next-to-the-last wave.

Under the alternative analysis, the September 13 peak was the end of wave A{-9}, the first subwave within wave 4{-8}, and the subsequent decline, now underway, is wave B{-9}. A reversal above 3883.50 and a clear rise toward the September 13 peak makes this alternative scenario more likely. Internally, wave B{-9} appears to be in its middle wave, B{-10}.

This is all happening within two waves that began on August 16, the child wave 1{-7} and the parent wave 3{-6}. They in turn are within wave 1{-4}, which began on January 4 — the end of the rise wave wave 3{-1}, which followed the early pandemic crash of 2020. The crash, the subsequent rise, and the present decline since January 4 are part of wave 5{0}, an expanding Diagonal Triangle that began on December 26, 2018 and that is the final wave with wave 5{+1}, which began on March 6, 2009 at the amazingly low price of 666.79 on the S&P 500 index. The top channel line of the wave 5{0} can be seen in red on the lower chart.

These charts ultimately have a lot of downside ahead. But the enclosing wave 5{0}, the Diagonal Triangle, is an uptrending wave, as is its parent and grandparent waves, from wave 5{+1}, which began in 2009, to wave 5{+3}, which began in 1932, during the Great Depression.

What’s the end game? The end of the Diagonal Triangle, wave 5{0}, will also be the end of the larger waves, up to 5{+3}. Afterward comes a correction that takes back a large portion of the entire rise since 1932.

So, bottom line: A rough few years ahead, followed by an impressive recovery and then some distance down the road, a decline of a magnitude that has not been seen for a almost century.

We Are Here.

These are the waves currently in progress under my principal analysis. Each line on the list shows the wave number, with the subscript in curly brackets, the traditional degree name, the starting date, the starting price of the S&P 500 E-mini futures, and the direction of the wave.

  • S&P 500 Index:
  • 5{+3} Supercycle, 7/8/1932, 4.40 (up)
  • 5{+2} Cycle, 12/9/1974, 60.96 (up)
  • 5{+1} Primary, 3/6/2009, 666.79 (up)
  • 5{0} Intermediate, 12/26/2018, 2346.58 (up)
  • 4{-1} Minor, 1/4/2022 4818.62 (down)
  • 1{-2} Minute, 1/4/2022 4818.62 (down)
  • S&P 500 Futures and index:
  • 1{-3} Minuette, 1/4/2022, 4808.25 (down) (futures), 4818.62 (down) (index)
  • S&P 500 Futures:
  • 1{-4} Subminuette, 1/4/2022, 4808.25 (down)
  • 1{-5} Micro, 1/4/2022, 4808.25 (down)
  • 3{-6} Submicro, 8/16/2022, 4325.28 (down)
  • 1{-7} Minuscule, 8/16/2022, 4325.28 (down)
  • 5{-8} Subminuscule, 9/13/2022, 4175 (down)

Learning and other resources. Elliott wave analysis provides context, not prophecy. As the 20th century semanticist Alfred Korzybski put it in his book Science and Sanity (1933), “The map is not the territory … The only usefulness of a map depends on similarity of structure between the empirical world and the map.” And I would add, in the ever-changing markets, we can judge that similarity of structure only after the fact.

See the menu page Analytical Methods for a rundown on where to go for information on Elliott wave analysis.

By Tim Bovee, Portland, Oregon, September 14, 2022

Disclaimer

Tim Bovee, Private Trader tracks the analysis and trades of a private trader for his own accounts. Nothing in this blog constitutes a recommendation to buy or sell stocks, options or any other financial instrument. The only purpose of this blog is to provide education and entertainment.

No trader is ever 100 percent successful in his or her trades. Trading in the stock and option markets is risky and uncertain. Each trader must make trading decisions for his or her own account, and take responsibility for the consequences.

License
Creative Commons License

All content on Tim Bovee, Private Trader by Timothy K. Bovee is licensed under a Creative Commons Attribution-ShareAlike 4.0 International License.

Based on a work at www.timbovee.com.

Trader’s Notebook

3:30 p.m. New York time

Half an hour before the closing bell. The S&P 500 continued to decline, reaching into the 3950s on the futures as the end of the session approached.

The analysis from this morning stands, as modified by the correction in the degree labeling that I made at midday. Internally, wave 1{-9} within with 5{-8} has had a single, small reversal to the upside. Which could mean the end of wave 1 and beginning of the 2nd wave of the five-wave structure. But the smallness of the reversal seems disproportionate to me, and I’m reluctant to adopt that count.

I do see an interesting prospect ahead. A firm rule of Elliott wave analysis is that the 3rd wave of a trend can’t be shorter than both waves 1 and 5. This is a fairly long 1st wave already, and usually the 1st wave is the shortest of them all. So that means that we can look forward to a really long 3rd wave — to the downside — or a 5th wave that’s unusually short, in order to be shorter than the 3rd wave. Wave 1{-9} so far is more than 200 points in length.

I’ve updated the chart.

12:40 p.m. New York time

Chart labeling correction. I’ve updated the chart to correct the labeling of the subwaves of wave 4{-8}, changing the degree from {-10} to {-9}. The futures have continued to fall during the session, so far reaching a low of 3995.75.

9:35 a.m. New York time

What’s happening now? The S&P 500 E-mini futures dropped overnight by 100 points in a single minute after inflation rose by 0.1% in August, to 8.3%. The price then continued to fall, at a slightly slower pace, with the entire decline covering from 4175 down to 4030.5.

What does it mean? The overnight high marked the end of an upward correction that began on September 6 and the start of a resumption of the downtrend that began on August 16. The decline is part of the final segment of that downtrend.

What is the alternative? The overnight high can also be counted as the end of the 1st wave of an ongoing upward correction, with the peak being the end of the initial segment within the correction, and the subsequent decline the beginning of the middle segment.

[S&P 500 E-mini futures at 3:30 p.m., 55-minute bars, with volume]

What does Elliott wave theory say? The overnight peak is the end of wave 4{-8}, an upward correction that began on September 6, and the beginning of wave 5{-8}, the final wave within wave 1{-7}, a downtrend that began on August 16 from 4327.50.

Under the alternative analysis, the overnight peak is the end of wave A{-9}, the first wave within the upward correction, wave 4{-8}. The subsequent decline is downward wave B{-9}, the middle wave of the correction, and it will be followed by upward wave C{-9}, the final wave within wave 4{-8}, which may carry the price above the overnight high.

I chose the wave 5{-8} scenario because of the power of the decline. Trending waves — especially the 3rd but also the 5th — tend to be powerful. Corrective waves tend to be more tentative. But there are powerful B waves, and so those tendencies don’t make the alternative analysis implausible.

When wave 1{-7} is complete, it will be followed by wave 2{-7}, another upward correction a degree larger than the one that was just completed.

This is all happening within downtrending wave 3{-6}, which also began on August 16.

We Are Here.

These are the waves currently in progress under my principal analysis. Each line on the list shows the wave number, with the subscript in curly brackets, the traditional degree name, the starting date, the starting price of the S&P 500 E-mini futures, and the direction of the wave.

  • S&P 500 Index:
  • 5{+3} Supercycle, 7/8/1932, 4.40 (up)
  • 5{+2} Cycle, 12/9/1974, 60.96 (up)
  • 5{+1} Primary, 3/6/2009, 666.79 (up)
  • 5{0} Intermediate, 12/26/2018, 2346.58 (up)
  • 4{-1} Minor, 1/4/2022 4818.62 (down)
  • 1{-2} Minute, 1/4/2022 4818.62 (down)
  • S&P 500 Futures and index:
  • 1{-3} Minuette, 1/4/2022, 4808.25 (down) (futures), 4818.62 (down) (index)
  • S&P 500 Futures:
  • 1{-4} Subminuette, 1/4/2022, 4808.25 (down)
  • 1{-5} Micro, 1/4/2022, 4808.25 (down)
  • 3{-6} Submicro, 8/16/2022, 4325.28 (down)
  • 1{-7} Minuscule, 8/16/2022, 4325.28 (down)
  • 5{-8} Subminuscule, 9/13/2022, 4175 (down)

Learning and other resources. Elliott wave analysis provides context, not prophecy. As the 20th century semanticist Alfred Korzybski put it in his book Science and Sanity (1933), “The map is not the territory … The only usefulness of a map depends on similarity of structure between the empirical world and the map.” And I would add, in the ever-changing markets, we can judge that similarity of structure only after the fact.

See the menu page Analytical Methods for a rundown on where to go for information on Elliott wave analysis.

By Tim Bovee, Portland, Oregon, September 13, 2022

Disclaimer

Tim Bovee, Private Trader tracks the analysis and trades of a private trader for his own accounts. Nothing in this blog constitutes a recommendation to buy or sell stocks, options or any other financial instrument. The only purpose of this blog is to provide education and entertainment.

No trader is ever 100 percent successful in his or her trades. Trading in the stock and option markets is risky and uncertain. Each trader must make trading decisions for his or her own account, and take responsibility for the consequences.

License
Creative Commons License

All content on Tim Bovee, Private Trader by Timothy K. Bovee is licensed under a Creative Commons Attribution-ShareAlike 4.0 International License.

Based on a work at www.timbovee.com.

Trader’s Notebook

3:30 p.m. New York time

Half an hour before the closing bell. The S&P 500 continued to rise during the session, reaching into the 4130s. No change in the analysis. I’ve updated the chart.

9:35 a.m. New York time

What’s happening now? The S&P 500 E-mini futures had an opening gap of 30 points when trading resumed overnight and has so far reached a high of 4115.

What does it mean? The upward correction has risen above the end of the the first leg of the downtrend that began on August 30. This is contrary to a rule of Elliott wave analysis, and so I’ve re-analyzed the chart.

Under the new principal analysis, the middle wave of the downtrend that began on August 16 ended on September 9, and an upward correction is underway. See the Elliott wave theory section below for greater detail.

What are the alternatives? None at present, as is usually the case when the chart is re-analyzed. Unsurprising, really, since a goal of the reanalysis is to eliminate those pesky ambiguities.

[S&P 500 E-mini futures at 3:30 p.m., 55-minute bars, with volume]

What does Elliott wave theory say? The reanalysis was required because, under the old analysis, wave 4{-10} moved above the end of wave 1{-10}, all within downtrending wave 3{-9}. Elliott wave theory has a strict rule against that, which means the map no longer matched the territory. So I redrew the map.

See Friday’s Trader’s Notebook for the chart showing the former analysis.

Under the new principal analysis, the rise that began on September 6 is wave 4{-8}. Typically, a 4th wave will have three subwaves, and the present rise is wave A{-9}. Wave 1{-8} ended on August 17 at 4255, which is 140 points above the high so far within wave 4{-8}: 4115.

I’ve updated the “We Are Here” list of waves presently underway, from wave 4{-8}, which began last week, to wave 5{+3}, which began in July 1932.

We Are Here.

These are the waves currently in progress under my principal analysis. Each line on the list shows the wave number, with the subscript in curly brackets, the traditional degree name, the starting date, the starting price of the S&P 500 E-mini futures, and the direction of the wave.

  • S&P 500 Index:
  • 5{+3} Supercycle, 7/8/1932, 4.40 (up)
  • 5{+2} Cycle, 12/9/1974, 60.96 (up)
  • 5{+1} Primary, 3/6/2009, 666.79 (up)
  • 5{0} Intermediate, 12/26/2018, 2346.58 (up)
  • 4{-1} Minor, 1/4/2022 4818.62 (down)
  • 1{-2} Minute, 1/4/2022 4818.62 (down)
  • S&P 500 Futures and index:
  • 1{-3} Minuette, 1/4/2022, 4808.25 (down) (futures), 4818.62 (down) (index)
  • S&P 500 Futures:
  • 1{-4} Subminuette, 1/4/2022, 4808.25 (down)
  • 1{-5} Micro, 1/4/2022, 4808.25 (down)
  • 3{-6} Submicro, 8/16/2022, 4325.28 (down)
  • 1{-7} Minuscule, 8/16/2022, 4325.28 (down)
  • 4{-8} Subminuscule, 9/6/2022, 3883.50 (up)

Learning and other resources. Elliott wave analysis provides context, not prophecy. As the 20th century semanticist Alfred Korzybski put it in his book Science and Sanity (1933), “The map is not the territory … The only usefulness of a map depends on similarity of structure between the empirical world and the map.” And I would add, in the ever-changing markets, we can judge that similarity of structure only after the fact.

See the menu page Analytical Methods for a rundown on where to go for information on Elliott wave analysis.

By Tim Bovee, Portland, Oregon, September 12, 2022

Disclaimer

Tim Bovee, Private Trader tracks the analysis and trades of a private trader for his own accounts. Nothing in this blog constitutes a recommendation to buy or sell stocks, options or any other financial instrument. The only purpose of this blog is to provide education and entertainment.

No trader is ever 100 percent successful in his or her trades. Trading in the stock and option markets is risky and uncertain. Each trader must make trading decisions for his or her own account, and take responsibility for the consequences.

License
Creative Commons License

All content on Tim Bovee, Private Trader by Timothy K. Bovee is licensed under a Creative Commons Attribution-ShareAlike 4.0 International License.

Based on a work at www.timbovee.com.

Trader’s Notebook

3:30 p.m. New York time

Half an hour before the closing bell. The S&P 500 continued to rise during the session, reaching 4075.50 on the futures. No change in the analysis. I’ve updated the chart.

9:35 a.m. New York time

What’s happening now? The S&P 500 E-mini futures continued to rise overnight, reaching 4045 as the opening bell approached.

What does it mean? The third leg of the upward correction that began on September 1 continues. Once the rise is complete, the correction will also be complete. It will be followed by a downtrend that will carry the price down into the 3800s or below.

What are the alternatives? There are two points of ambiguity.

Alternative #1: At this point we’re fishing for a top. Each new high is potentially the end of the correction.

Alternative #2: Typically a correction will contain one corrective pattern, but sometimes there will be two or three patterns, tied together with connecting waves in a compound correction. If the present correction takes the compound form, then the present rise will be followed by a connecting wave and then a second corrective pattern.

[S&P 500 E-mini futures at 3:30 p.m., 55-minute bars, with volume]

What does Elliott wave theory say? The upward correction, wave 4{-10} is now in its third wave, C{-11], which typically will be the end of the correction, which will be followed by wave 5{-10}, a resumption o the downtrend.

Under the first alternative, wave 4{-10} ended at the most recent high.

Under the second alternative, wave 4{-10} is taking a compound form, and when wave C{-11} is complete, it will be followed by a connecting wave, X{-11}, and then the first wave of a second corrective pattern within wave 4{-10}. Fourth waves are more likely to be compound corrections than are their 2nd-wave counterparts.

Learning and other resources. Elliott wave analysis provides context, not prophecy. As the 20th century semanticist Alfred Korzybski put it in his book Science and Sanity (1933), “The map is not the territory … The only usefulness of a map depends on similarity of structure between the empirical world and the map.” And I would add, in the ever-changing markets, we can judge that similarity of structure only after the fact.

See the menu page Analytical Methods for a rundown on where to go for information on Elliott wave analysis.

By Tim Bovee, Portland, Oregon, September 9, 2022

Disclaimer

Tim Bovee, Private Trader tracks the analysis and trades of a private trader for his own accounts. Nothing in this blog constitutes a recommendation to buy or sell stocks, options or any other financial instrument. The only purpose of this blog is to provide education and entertainment.

No trader is ever 100 percent successful in his or her trades. Trading in the stock and option markets is risky and uncertain. Each trader must make trading decisions for his or her own account, and take responsibility for the consequences.

License
Creative Commons License

All content on Tim Bovee, Private Trader by Timothy K. Bovee is licensed under a Creative Commons Attribution-ShareAlike 4.0 International License.

Based on a work at www.timbovee.com.

Trader’s Notebook

3:30 p.m. New York time

Half an hour before the closing bell. The S&P 500 moved higher this morning, reaching 4010.75 on the futures. No change in the analysis. I’ve updated the chart.

9:35 a.m. New York time

What’s happening now? The S&P 500 E-mini futures reached a high of 3996 in overnight trading and then retreated downward into the 3940s.

What does it mean? The overnight rise was the middle leg of the middle segment of the final wave in a corrective pattern that began on September 1. The decline that followed is the next-to-the-last segment of that middle wave. When the pullback is complete, the rise will resume, with a target range of 3999.25 to 4074.50. The end of the final wave is likely to be the end of the correction, which will be followed by a downtrend that will take the price down into the 3800s and perhaps lower.

What are the alternatives? There are two.

Alternative #1: Some corrections form a compound pattern, containing two or three corrective patterns. If that should happen in the present correction, then the first corrective pattern will be followed by a connector wave, and then by a second corrective pattern. The first corrective pattern may have ended at the overnight high.

Alternative #2: The correction ended at the overnight high..

[S&P 500 E-mini futures at 3:30 p.m., 45-minute bars, with volume]

What does Elliott wave theory say? The upward correction that began on September 1 is wave 4{-10}. It is presently in the final wave of the corrective pattern, wave C{-11}. Internally, the C wave completed its middle wave, 3{-12}, and is now in its next-to-the-last segment, wave 4{-12}. Wave 5{-12} will complete the corrective pattern.

The corrective pattern has taken the form of a Flat, and in a Flat, the C wave is usually between 1 and 1.65 times the length of the preceding A wave, which is 115.75 in length. Wave C{-11} began from 3883.50, giving it a price target ranging from 3999.25 to 4074.50.

If wave 4{-10} is a simple correction, then wave C{-11} will end the 4th wave and will be followed by wave 5{-10}, a downtrend that will most probably carry the price into the 3800s or lowers. Probably. Fifth waves sometime come up sort, called “truncation” in Elliott wave terminology. Sometimes the 5th wave will add to the normal five internal waves in an expansion, ending up with nine internal waves that carry the price further than expected.

Alternative #1: If wave 4{-10} is a compound correction, then wave C{-11} will be followed by downward wave X{-11}, a connector wave, and then by a second corrective pattern, which may differ from the first. Altogether a compound correction can have up to three corrective patterns. It’s possible that the first corrective pattern ended at the overnight high, 3996, and the subsequent decline is wave X{-11}.

Alternative #2: Wave 4{-10} ended overnight at 3996 and the subsequent decline is wave 5{-10}.

Learning and other resources. Elliott wave analysis provides context, not prophecy. As the 20th century semanticist Alfred Korzybski put it in his book Science and Sanity (1933), “The map is not the territory … The only usefulness of a map depends on similarity of structure between the empirical world and the map.” And I would add, in the ever-changing markets, we can judge that similarity of structure only after the fact.

See the menu page Analytical Methods for a rundown on where to go for information on Elliott wave analysis.

By Tim Bovee, Portland, Oregon, September 8, 2022

Disclaimer

Tim Bovee, Private Trader tracks the analysis and trades of a private trader for his own accounts. Nothing in this blog constitutes a recommendation to buy or sell stocks, options or any other financial instrument. The only purpose of this blog is to provide education and entertainment.

No trader is ever 100 percent successful in his or her trades. Trading in the stock and option markets is risky and uncertain. Each trader must make trading decisions for his or her own account, and take responsibility for the consequences.

License
Creative Commons License

All content on Tim Bovee, Private Trader by Timothy K. Bovee is licensed under a Creative Commons Attribution-ShareAlike 4.0 International License.

Based on a work at www.timbovee.com.

Trader’s Notebook

3:30 p.m. New York time

Half an hour before the closing bell. The S&P 500 continued to rise during the session, reaching into the 3980s on the futures so far. The rise is sufficient to persuade me that the alternative analysis from this morning best matches the chart, and I’ve changed the wave labelings to conform.

Under the new principal analysis, an upward corrective pattern that began on September 1 is underway and has entered its 3rd and final leg.

Switching to Elliott wave terminology, wave 4{-10}, an upward correction, began on September 1. Internally, its first wave, A{-11}, ended on September 2, its second wave, B{-11}, ended on September 6, and its 3rd wave, C{-11} is now underway.

The corrective pattern is taking the form of a Flat, and in a Flat, the C wave is usually between 1 and 1.65 times the length of the preceding A wave, which is 115.75 in length. Wave C{-11} began from 3883.50, giving it a price target ranging from 3999.25 to 4074.50.

A 4th wave sometimes forms a compound structure, combing two or three corrective patterns. If that happens here, then wave C{-11} will be followed by a downward connecting wave, X{-11}, and then wave A{-11} of a second corrective pattern.

I’ve updated the chart.

9:35 a.m. New York time

What’s happening now? The S&P 500 E-mini futures rose in overnight trading into the 3020s and then reversed, declining into the 3890s, afterward rising slightly.

What does it mean? The downtrend that began on September 2 continues.

What are the alternatives? The upward correction that began on September 1 continues.

[S&P 500 E-mini futures at 3:30 p.m., 45-minute bars, with volume]

What does Elliott wave theory say? Under the principal analysis, the S&P 500s position since September 2 has been in downtrending wave 5{-10} the final wave within a larger downtrend, wave 3{-9}, which began on August 30. Under this scenario, the price will continue to decline, perhaps significantly.

Under the alternative analysis, the S&P 500 is in wave B{-11}, the middle wave of an upward corrective pattern that began on September 1, wave 4{-10}. Under this scenario, the price will reverse soon and as wave C{-11}, will rise toward the end of the preceding wave, A{-11}, and perhaps will exceed that price, 4019.25.

The further the price drops, the less likely the alternative analysis becomes.

Learning and other resources. Elliott wave analysis provides context, not prophecy. As the 20th century semanticist Alfred Korzybski put it in his book Science and Sanity (1933), “The map is not the territory … The only usefulness of a map depends on similarity of structure between the empirical world and the map.” And I would add, in the ever-changing markets, we can judge that similarity of structure only after the fact.

See the menu page Analytical Methods for a rundown on where to go for information on Elliott wave analysis.

By Tim Bovee, Portland, Oregon, September 7, 2022

Disclaimer

Tim Bovee, Private Trader tracks the analysis and trades of a private trader for his own accounts. Nothing in this blog constitutes a recommendation to buy or sell stocks, options or any other financial instrument. The only purpose of this blog is to provide education and entertainment.

No trader is ever 100 percent successful in his or her trades. Trading in the stock and option markets is risky and uncertain. Each trader must make trading decisions for his or her own account, and take responsibility for the consequences.

License
Creative Commons License

All content on Tim Bovee, Private Trader by Timothy K. Bovee is licensed under a Creative Commons Attribution-ShareAlike 4.0 International License.

Based on a work at www.timbovee.com.

Trader’s Notebook

3:30 p.m. New York time

Half an hour before the closing bell. The S&P 500 fell during the session, reaching a low so far of 3886.75 on the futures, well below the end point of the preceding downtrending wave, 3903.50. This is could be important for the interpretation of the chart.

I’ll switch now to the terminology of Elliott wave analysis. The present downtrend is wave 5{-10}, and the preceding downtrend is wave 3{-10}. That’s the principal analysis, and the further the price falls, the more strongly this scenario is confirmed.

The alternative analysis of the last few days complicates the question. The alternative has wave 4{-10}, an upward correction, still underway. Under this scenario, the present downtrend is wave B{-11}, the middle of wave the correction.

Is it OK for a B wave to go below the starting point of the preceding A wave? Which is also the ending point of the preceding 3rd wave? If the correction is taking the form of a 4th-wave Zigzag, which is more common of 2nd waves, then it’s not OK. The rules of Elliott wave analysis forbid it and require a recount if the chart is counted that way. If the correction is a Flat, which more common in 4th waves, then there’s no problem. The internal structure of Zigzags is five waves in wave A, three in B, and five in C (5-3-5). The internal structure of Flags is 3-3-5.

Wave A{-11} within wave A{-10} looks like it has three waves within it to me. Although if I zoom in, then I can also manage a count of five waves. As is so often the case with Elliott wave analysis, there are ambiguities.

Given the fact that a Flat is more common in 4th waves, I’m going to stay with that interpretation, but also will stick with my principal analysis, which says that the upward correction ended on September 2. A quick reversal and a rise above the September 2 high, 4019.25, would keep both the principal and the alternative analyses viable. A continuing and significant decline would eliminate the alternative analysis.

I’ve updated the chart.

9:35 a.m. New York time

What’s happening now? The S&P 500 E-mini futures continued to work their way higher after trading resumed Monday evening, reaching into the 3960s in the hours before the opening bell and then early in the session dropping back into the 3930s

What does it mean? The rise from Friday’s low, 3906, is the first leg of an upward correction within a downtrend that began on Friday from 4019.25. The rise, so far quite small, will be followed by a downward movement and then a final rise that will complete the corrective pattern.

What is the alternative? The upward correction that began on September 1 is still underway. Friday’s peak was the end of the first leg of the correction, the subsequent decline was the second leg leg, and weak rise that began on Friday is the third leg, which is still underway.

[S&P 500 E-mini futures at 3:30 p.m., 45-minute bars, with volume]

What does Elliott wave theory say? Under the principal analysis, downtrending wave 5{-10} is underway and, internally, has entered its first upward correction, wave 2{-11}. The 2nd wave in turn is in its second segment, wave B{-12}. The B wave will be followed by wave C{-12}, which will complete the correction and which will be followed in turn by wave 3{-11}, the powerful middle wave within wave 5{-10}.

Under the alternative analysis, an upward correction, wave 4{-10}, is still underway and is in its 3rd and likely final segment, wave C{-11}. Sometimes 4th waves will form a compound structure, linking two or three corrective patterns together. If that’s the case, then wave C{-11} will be followed by a connector, wave X{-11}, and then another wave A{-11}, the start of the second corrective pattern.

This is all happening within a nested series of downtrending waves. From smaller to larger, they are wave 3{-9}, which began on August 30; wave 3{-8}, on August 26; wave 1{-7}, on August 16; and wave 3{-6}, also on August 16. The entirety of the decline that began on January 4 from 4808.25 is within wave 4{-1}, the next to the last wave in a very large expanding Diagonal Triangle, wave 5{0}, that began on December 26, 2018.

Learning and other resources. Elliott wave analysis provides context, not prophecy. As the 20th century semanticist Alfred Korzybski put it in his book Science and Sanity (1933), “The map is not the territory … The only usefulness of a map depends on similarity of structure between the empirical world and the map.” And I would add, in the ever-changing markets, we can judge that similarity of structure only after the fact.

See the menu page Analytical Methods for a rundown on where to go for information on Elliott wave analysis.

By Tim Bovee, Portland, Oregon, September 6, 2022

Disclaimer

Tim Bovee, Private Trader tracks the analysis and trades of a private trader for his own accounts. Nothing in this blog constitutes a recommendation to buy or sell stocks, options or any other financial instrument. The only purpose of this blog is to provide education and entertainment.

No trader is ever 100 percent successful in his or her trades. Trading in the stock and option markets is risky and uncertain. Each trader must make trading decisions for his or her own account, and take responsibility for the consequences.

License
Creative Commons License

All content on Tim Bovee, Private Trader by Timothy K. Bovee is licensed under a Creative Commons Attribution-ShareAlike 4.0 International License.

Based on a work at www.timbovee.com.

Trader’s Notebook

10:25 a.m. New York time

What’s happening now? The S&P 500 E-mini futures scribbled in a narrow range after trading resumed Sunday evening, fluctuating between 3915 and 3942. U.S. markets are closed today for the Labor Day holiday and will resume trading on Tuesday. This will be my only update today, unless the market breaks significantly out of that narrow range.

What does it mean? The analysis is unchanged from Friday. The downtrend that began from Friday’s peak, 4019.25, continues, having fallen more than 100 points. Under this scenario, the decline will continue when the U.S. markets re-open, reaching below 3903.50, the beginning of the upward correction, and perhaps significantly below that point.

What are the alternatives? Under another scenario, Friday’s peak was the end of the first leg of an upward correction that began on September 1, and the decline from Friday’s peak is the second leg of the ongoing correction. Under this scenario, the decline will reverse soon, taking the price back to the 4019.25, the end of the first leg of the correction, and perhaps higher.

[S&P 500 E-mini futures at 7:25 a.m., 45-minute bars, with volume]

What does Elliott wave theory say? Under the principal analysis, downtrending wave 5{-10} is underway. The pause during holiday trading can be interpreted as wave 2{-11} within 5{-10}. When that 2nd wave is complete, wave 3{-11} will the price within wave 5{-10} significantly lower.

Under the alternative analysis, wave A{-11} within wave 4{-10} ended on Friday, and wave B{-11} began. Wave B{-11} can be expected to end soon, and it will be followed by wave C{-11}, which will carry the price back to Friday’s peak and perhaps higher.

This is all happening within a nested series of downtrending waves. From smaller to larger, they are wave 3{-9}, which began on August 30; wave 3{-8}, on August 26; wave 1{-7}, on August 16; and wave 3{-6}, also on August 16. The entirety of the decline that began on January 4 from 4808.25 is within wave 4{-1}, the next to the last wave in a very large expanding Diagonal Triangle, wave 5{0}, that began on December 26, 2018.

Learning and other resources. Elliott wave analysis provides context, not prophecy. As the 20th century semanticist Alfred Korzybski put it in his book Science and Sanity (1933), “The map is not the territory … The only usefulness of a map depends on similarity of structure between the empirical world and the map.” And I would add, in the ever-changing markets, we can judge that similarity of structure only after the fact.

See the menu page Analytical Methods for a rundown on where to go for information on Elliott wave analysis.

By Tim Bovee, Portland, Oregon, September 5, 2022

Disclaimer

Tim Bovee, Private Trader tracks the analysis and trades of a private trader for his own accounts. Nothing in this blog constitutes a recommendation to buy or sell stocks, options or any other financial instrument. The only purpose of this blog is to provide education and entertainment.

No trader is ever 100 percent successful in his or her trades. Trading in the stock and option markets is risky and uncertain. Each trader must make trading decisions for his or her own account, and take responsibility for the consequences.

License
Creative Commons License

All content on Tim Bovee, Private Trader by Timothy K. Bovee is licensed under a Creative Commons Attribution-ShareAlike 4.0 International License.

Based on a work at www.timbovee.com.

Trader’s Notebook

3:30 p.m. New York time

Half an hour before the closing bell. The S&P 500 futures reached 4019.25 during the session and then sharply reversed, so far reaching back into the 3920s. The sharpness of the reversal suggests to me that the peak was the end of the upward correction discussed this morning, wave 4{-10}, and that wave 5{-10}, a resumption of the downtrend, is now underway. A move below 3903.50, the start of the correction, would strengthen that interpretation. A reversal and a move above 4019.25 would strengthen an alternative scenario, that today’s peak was the end of the first wave within the correction, wave A{-11}. I’ve updated the chart.

9:35 a.m. New York time

Monday, a market holiday. U.S. markets will be closed on Monday for the Labor Day holiday. The S&P 500 E-mini futures are traded internationally, and often there will be price updates during a holiday period. If there are any significant price changes on Monday, I’ll post a Trader’s Notebook update.

What’s happening now? The S&P 500 E-mini futures rose as the opening bell approached, coinciding with the release of August’s jobs numbers in the U.S., showing a 315,000 increase in non-farm payroll employment and also a 0.2 percentage point rise in the unemployment rate, to 3.7%.

What does it mean? The rise carried the upward correction that began on September 1 into the low 4000s, more than 100 points above where the correction began. The correction, when complete, will be followed by a resumption of the downtrend that began on August 30 from 4072.75.

What are the alternatives? Internally, the correction is in its 3rd leg. How should this be interpreted? As the 3rd and final leg of the correction? As the final leg of the first leg within the correction (if it takes the form of a Flat)? Or as the middle wave within the first leg of the correction (if it takes the form of a Zigzag)? It’s too soon to tell, but the choices are worth keeping in mind while studying the chart.

[S&P 500 E-mini futures at 3:30 p.m., 45-minute bars, with volume]

What does Elliott wave theory say? Under the principal analysis, wave 4{-10} is underway. The wave is an upward correction that began on September 1 from 3902.50. The correction will be followed by a resumption of the downtrend that began on August 30 from 4072.75, as wave 5{-10}, which is likely to carry the price below 3902.50, the starting point of the correction.,

All of this is happening with wave 3{-9}, a downtrend that began on on August 30, which in turn is the middle wave of wave 3{-8}, which began on August 26 from 4117.25. The parent wave of the entire structure is wave 1{-7}, the initial wave within downtrending wave 3{-6}. Both began on August 16 from 4327.50.

The major trend that will dominate the markets for months to come, maybe for a year or so, is five degrees larger, wave 4{-1}, a downtrending wave that began on January 4 from 4808.25. It is the next-to-the-last wave within a very large expanding Diagonal Triangle, wave 5{0}, that began on December 26, 2018 from 2346.58 and that reached its low, so far, of 2191.86 on February 23, 2020, the end of the early pandemic crash.

Learning and other resources. Elliott wave analysis provides context, not prophecy. As the 20th century semanticist Alfred Korzybski put it in his book Science and Sanity (1933), “The map is not the territory … The only usefulness of a map depends on similarity of structure between the empirical world and the map.” And I would add, in the ever-changing markets, we can judge that similarity of structure only after the fact.

See the menu page Analytical Methods for a rundown on where to go for information on Elliott wave analysis.

By Tim Bovee, Portland, Oregon, September 2, 2022

Disclaimer

Tim Bovee, Private Trader tracks the analysis and trades of a private trader for his own accounts. Nothing in this blog constitutes a recommendation to buy or sell stocks, options or any other financial instrument. The only purpose of this blog is to provide education and entertainment.

No trader is ever 100 percent successful in his or her trades. Trading in the stock and option markets is risky and uncertain. Each trader must make trading decisions for his or her own account, and take responsibility for the consequences.

License
Creative Commons License

All content on Tim Bovee, Private Trader by Timothy K. Bovee is licensed under a Creative Commons Attribution-ShareAlike 4.0 International License.

Based on a work at www.timbovee.com.