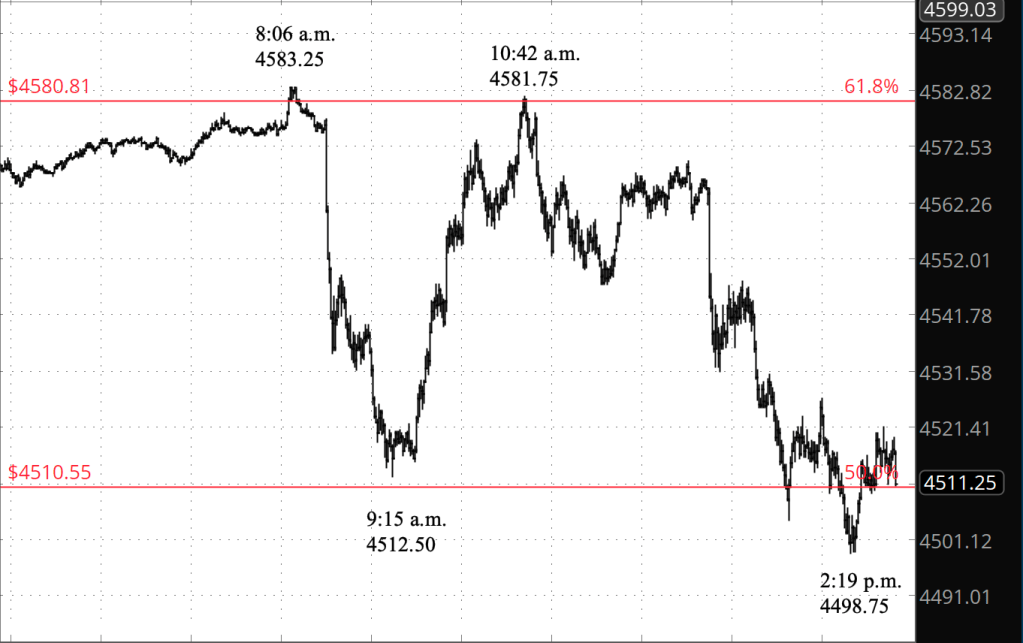
3:30 p.m. New York time
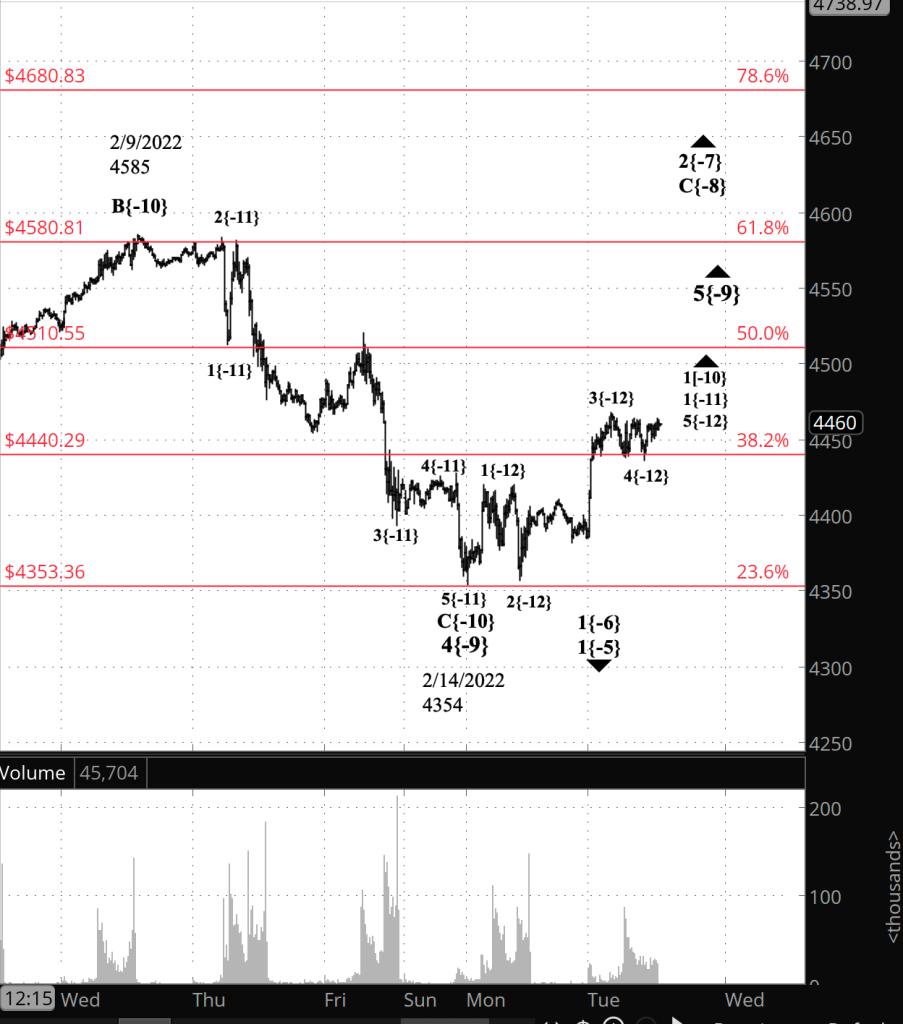
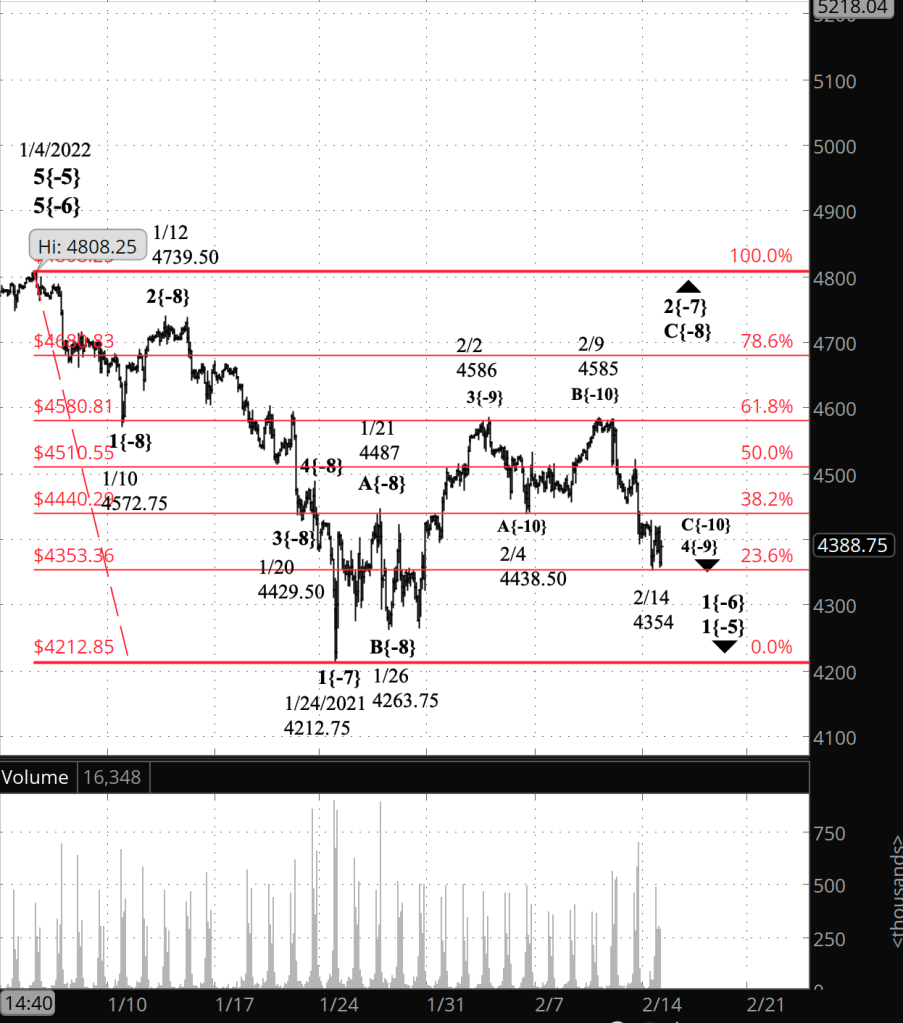
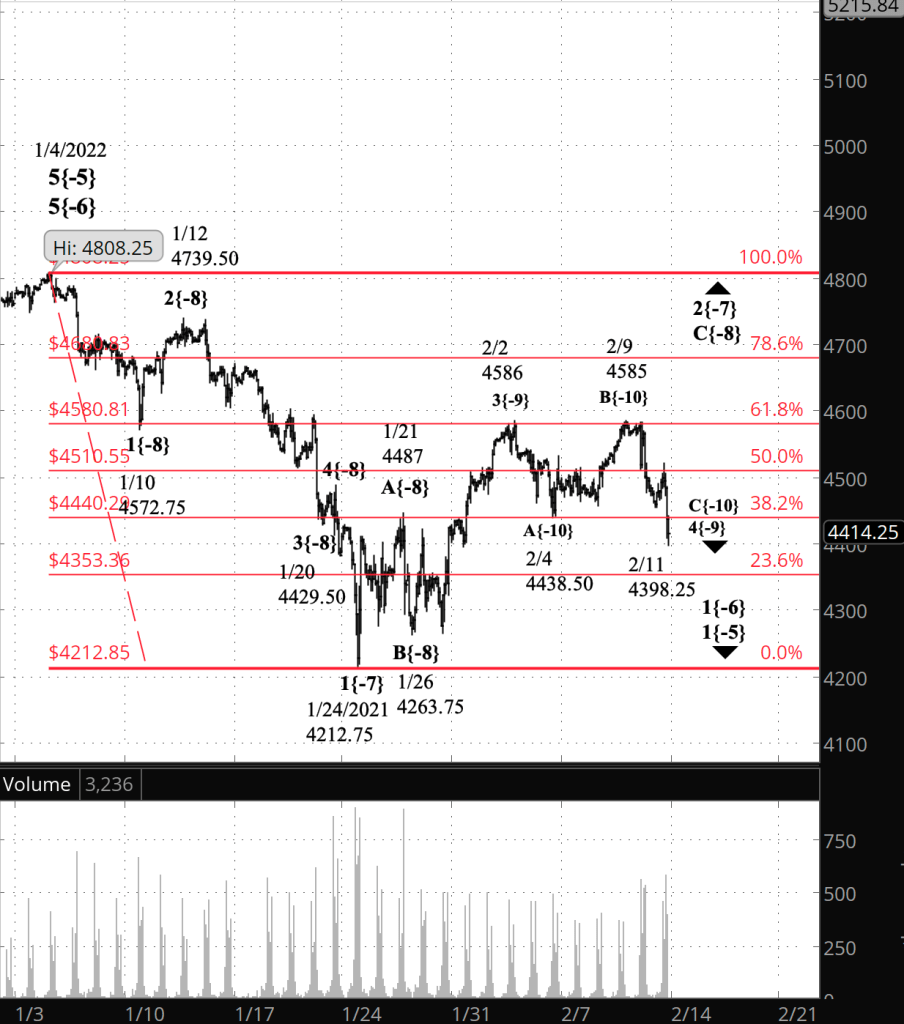
Half an hour before the closing bell. The S&P 500 futures have traded within a 40-point range during the session, continuing a sideways movement. No change in the analysis; wave 5{-9} is in the early stages of its rise. I’ve updated the chart.
10 a.m. New York time
WMT earnings play entry. I’ve entered a short bull put options spread on WMT, timed to coincide with the company’s earnings announcement before the opening bell tomorrow, and have posted an analysis of the trade.
9:35 a.m. New York time
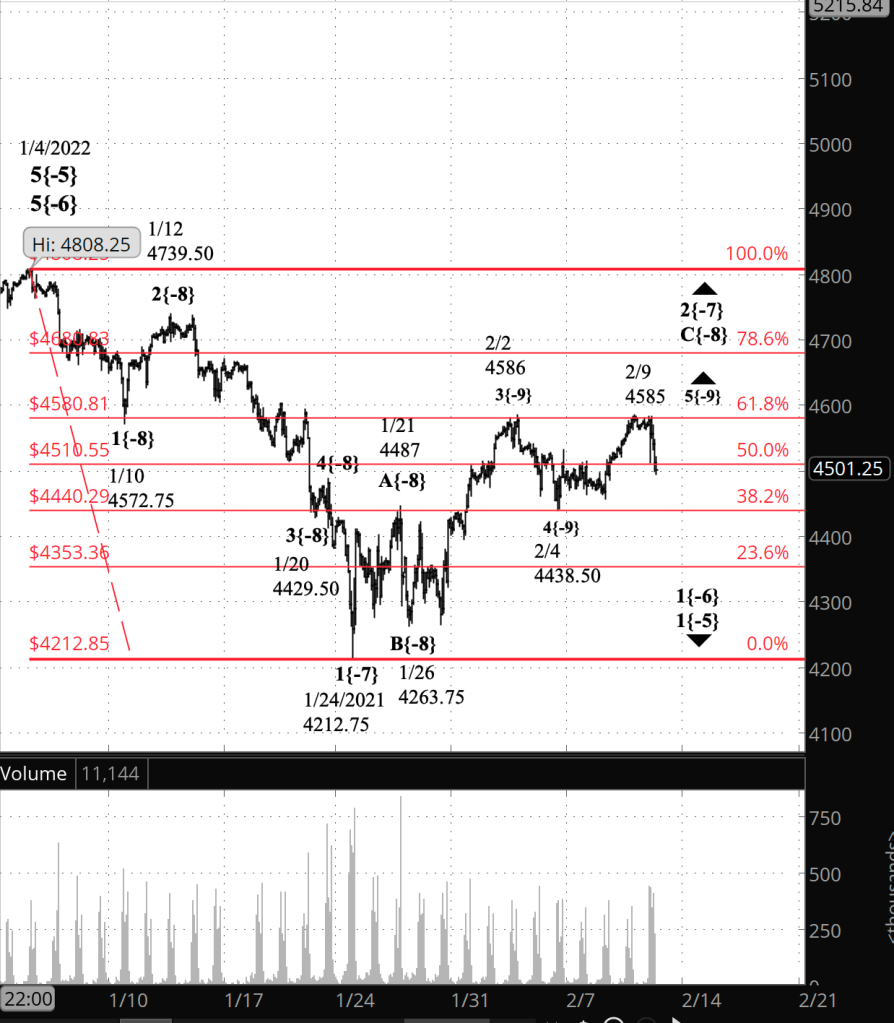
What’s happening now? In overnight trading, the S&P 500 E-mini futures remained close to a 38.2% retracement of the decline from January 4 to January 24.
What does it mean? Under my principal analysis, the sideways movement is a correction within the early portion of a rise that began on February 14 and that will carry the price noticeably higher, perhaps to the 61.8% retracement level. The end of the rise will also mark the end of the upward correction that began on January 24 and will be followed by a decline that will carry the price to 4212 and below, as the downtrend that began on January 4 resumes.
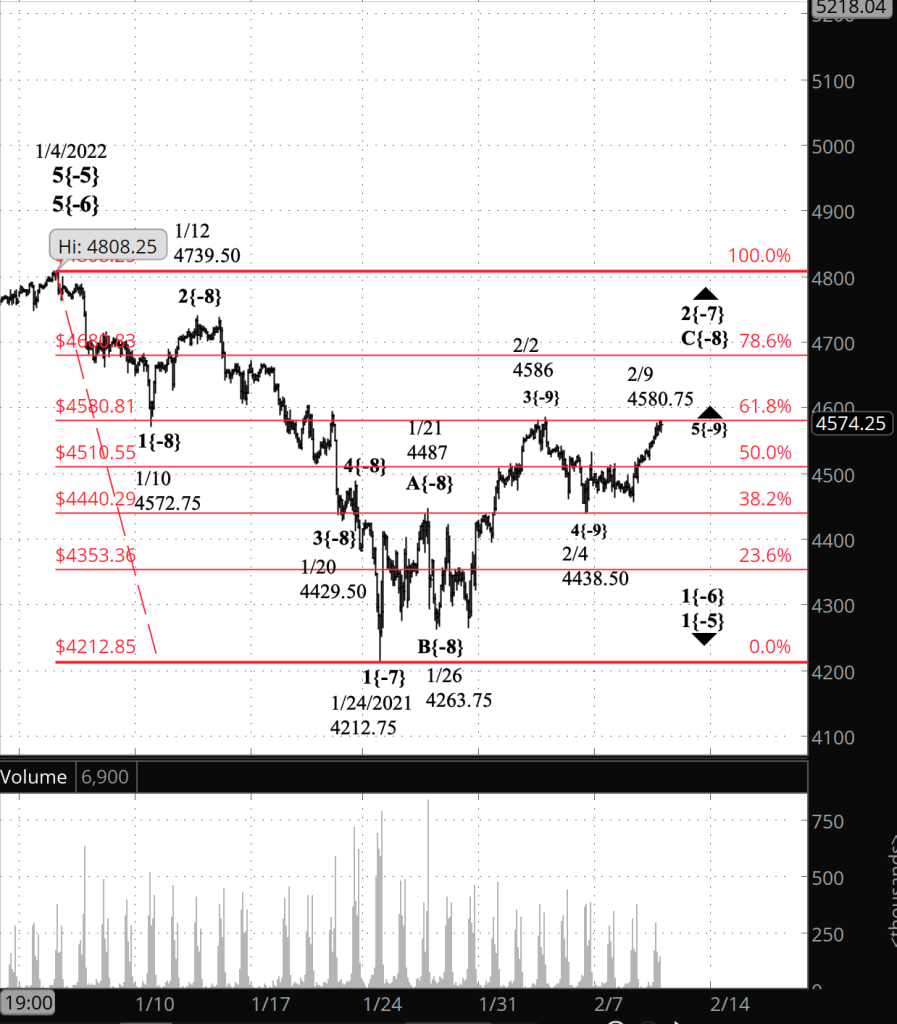
What’s the alternative? The rise from February 14 could be connecting the corrective pattern just ended with a second corrective pattern in a compound correction. Under this scenario, I still anticipate the rise followed by a significant decline, described above in the principal analysis. But they’ll be delayed until the compound correction is complete. Compound corrections can connect up to three corrective patterns.
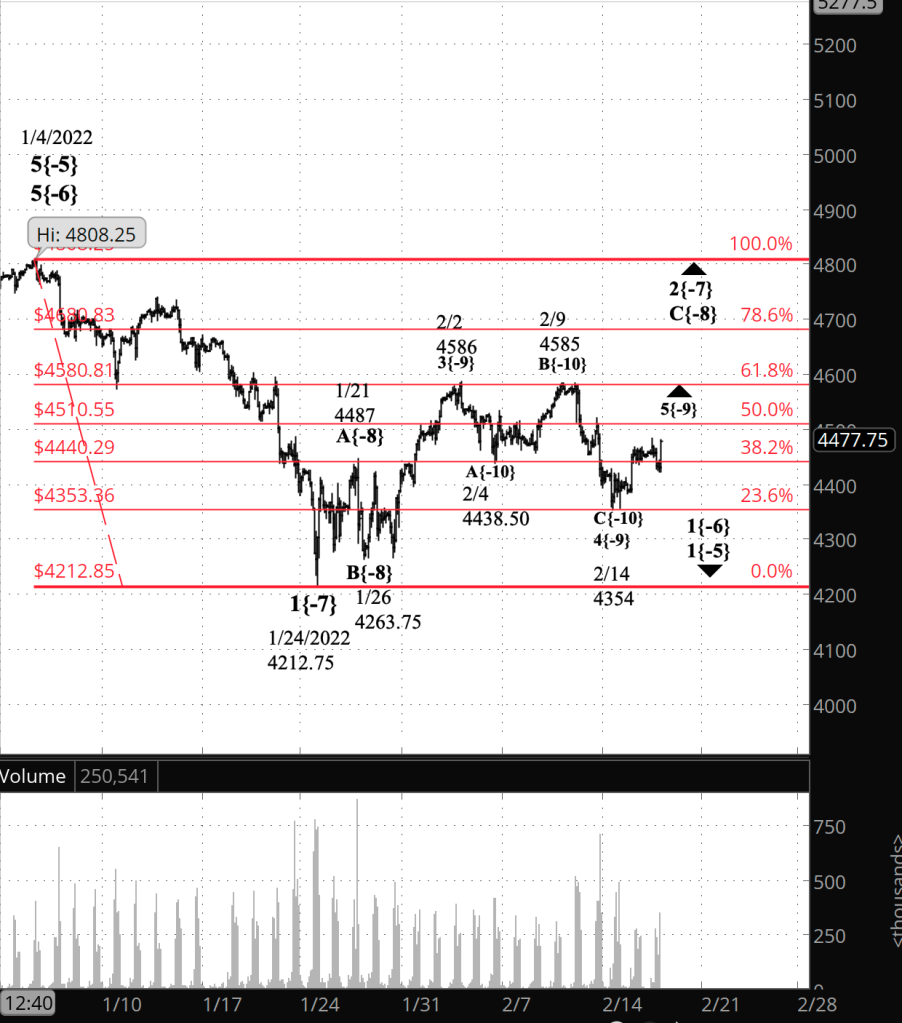
What does Elliott wave theory say? Under my principal analysis, the rise from February 14 is the early stage of wave 5{-9}, the final wave within wave C{-8}, the final wave in wave 2{-7}, an upward correction that began on January 24.
Wave 5{-9}’s endpoint will mark the end of both waves C{-8} and 2{-7}. Wave 3{-7} will follow, resuming the downtrend with the energy associated with 3rd waves. Wave 3{-7} will remove much of the ambiguity from the market, defining with great clarity that the dominant mood of traders is bearish.
Under the alternative analysis, wave 4{-9} is still underway, and the rise from February 14 is wave X{-10}, connecting two corrective patterns. The end of wave 4{-9}, after a compound correction of two or three corrective patterns, will be followed by uptrending wave 5{-9}, ending wave C{-8} and 2{-8}, and then by downtrending wave 3{-7}.
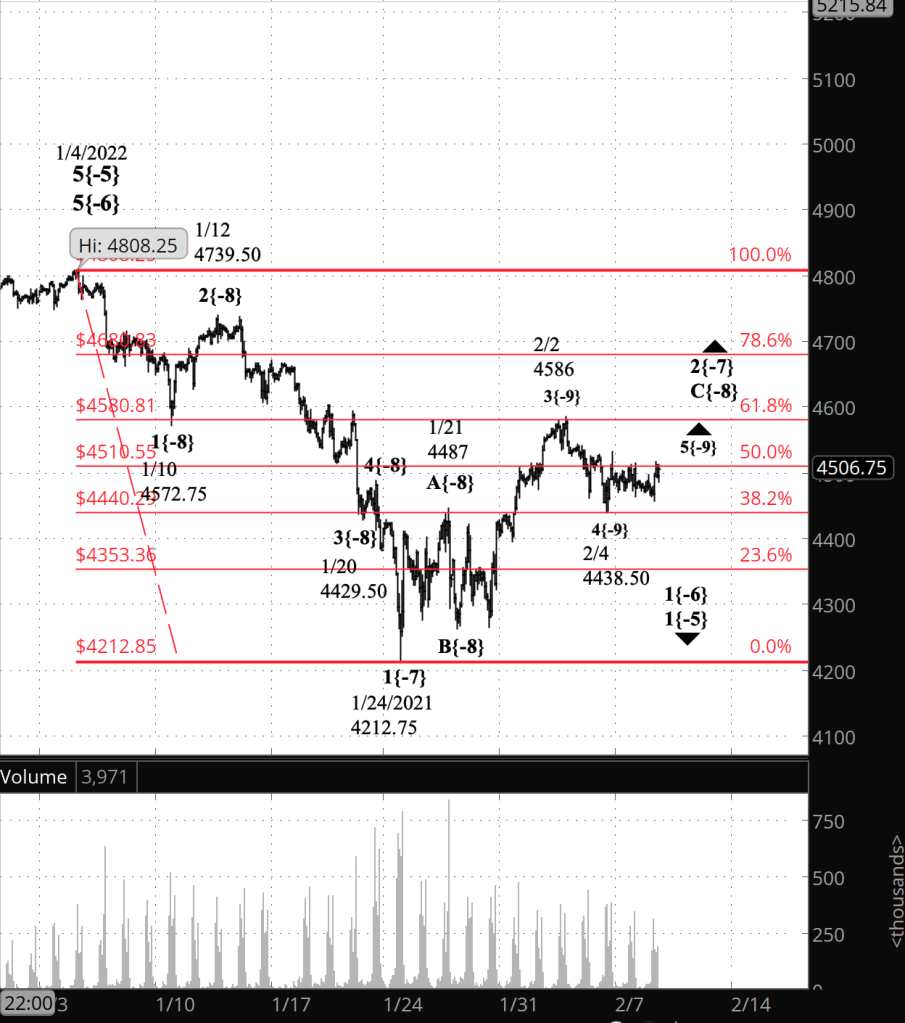
We Are Here.
These are the waves currently in progress under my principal analysis. Each line on the list shows the wave number, with the subscript in curly brackets, the traditional degree name, the starting date, the starting price of the S&P 500 E-mini futures, and the direction of the wave.
- 5{0} Intermediate, 12/21/2018, 2316.75 (up)
- 3{1} Minor, 3/23/2018 2174 (up)
- 5{-2} Minute, 10/4/2020, 4267.50 (up)
- 4{-3} Minuette, 1/4/2022, 4808.25 (down)
- A{-4} Subminuette, 1/4/2022, 4808.25 (down)
- 1{-5} Micro, 1/4/2022, 4808.25 (down)
- 1{-6} Submicro, 1/4/2022, 4808.25 (down)
- 2{-7} Minuscule, 1/24/2022, 4212.75 (up)
- C{-8} Subminuscule, 1/26/2022, 4263.75 (up)
Learning and other resources. Elliott wave analysis provides context, not prophecy. As the 20th century semanticist Alfred Korzybski put it this way in his book Science and Sanity (1933), “The map is not the territory … The only usefulness of a map depends on similarity of structure between the empirical world and the map.” And I would add, in the ever-changing markets, we can judge that similarity of structure only after the fact.
See the menu page Analytical Methods for a rundown on where to go for information on Elliott wave analysis.
By Tim Bovee, Portland, Oregon, February 16, 2022
Disclaimer
Tim Bovee, Private Trader tracks the analysis and trades of a private trader for his own accounts. Nothing in this blog constitutes a recommendation to buy or sell stocks, options or any other financial instrument. The only purpose of this blog is to provide education and entertainment.
No trader is ever 100 percent successful in his or her trades. Trading in the stock and option markets is risky and uncertain. Each trader must make trading decisions for his or her own account, and take responsibility for the consequences.
License
All content on Tim Bovee, Private Trader by Timothy K. Bovee is licensed under a Creative Commons Attribution-ShareAlike 4.0 International License.
Based on a work at www.timbovee.com.

You must be logged in to post a comment.