Thursday, December 24, 2020

12:40 a.m. New York time

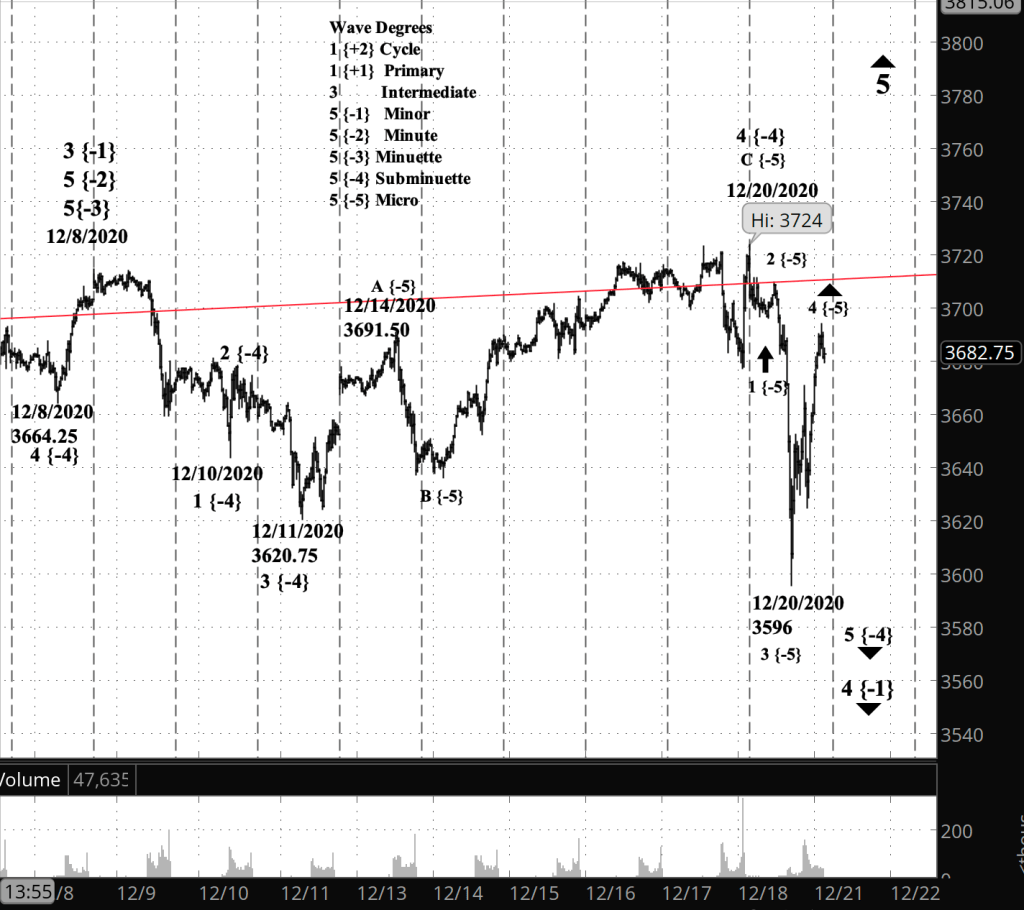
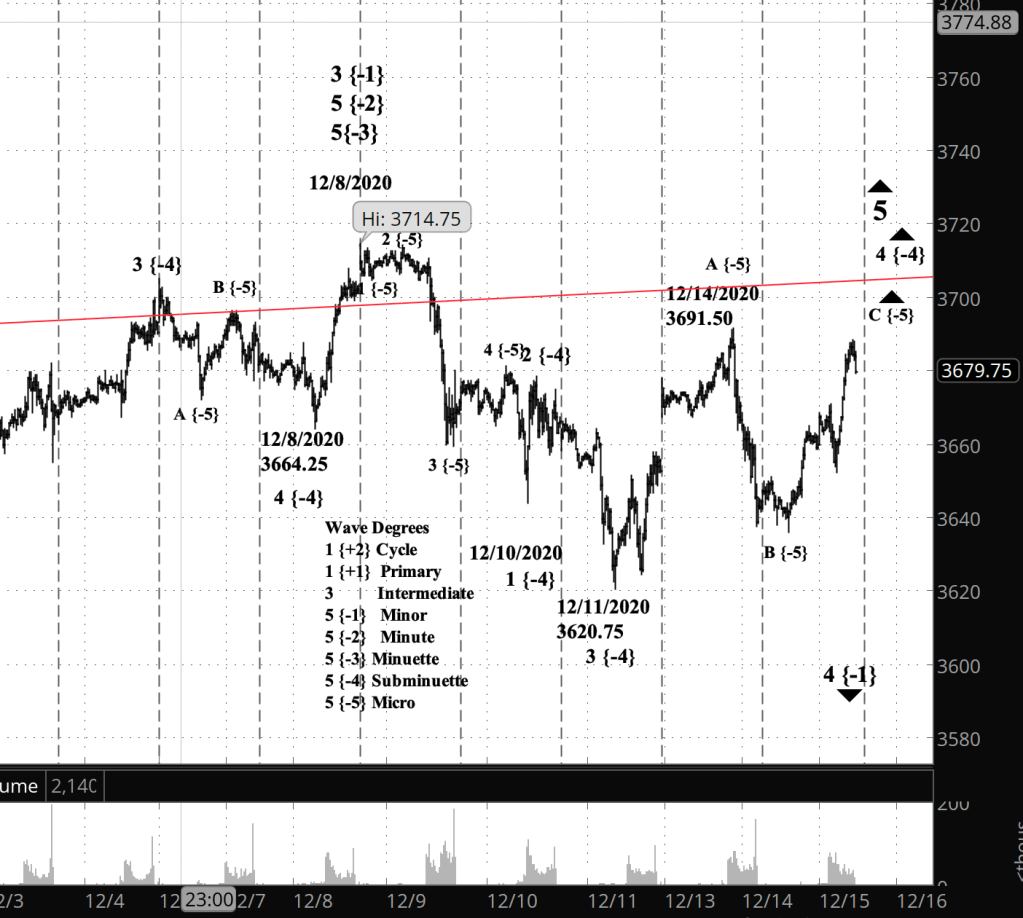
Forty minutes before the closing bell. Very little movement of the S&P 500 in pre-Christmas trading shortly before the early market close. I’ve updated the near-term chart below.

9:55 a.m. New York time

Early close. The U.S. markets will close at 1 p.m. New York time for Christmas Eve, and will be closed all day Friday for the Christmas holiday.

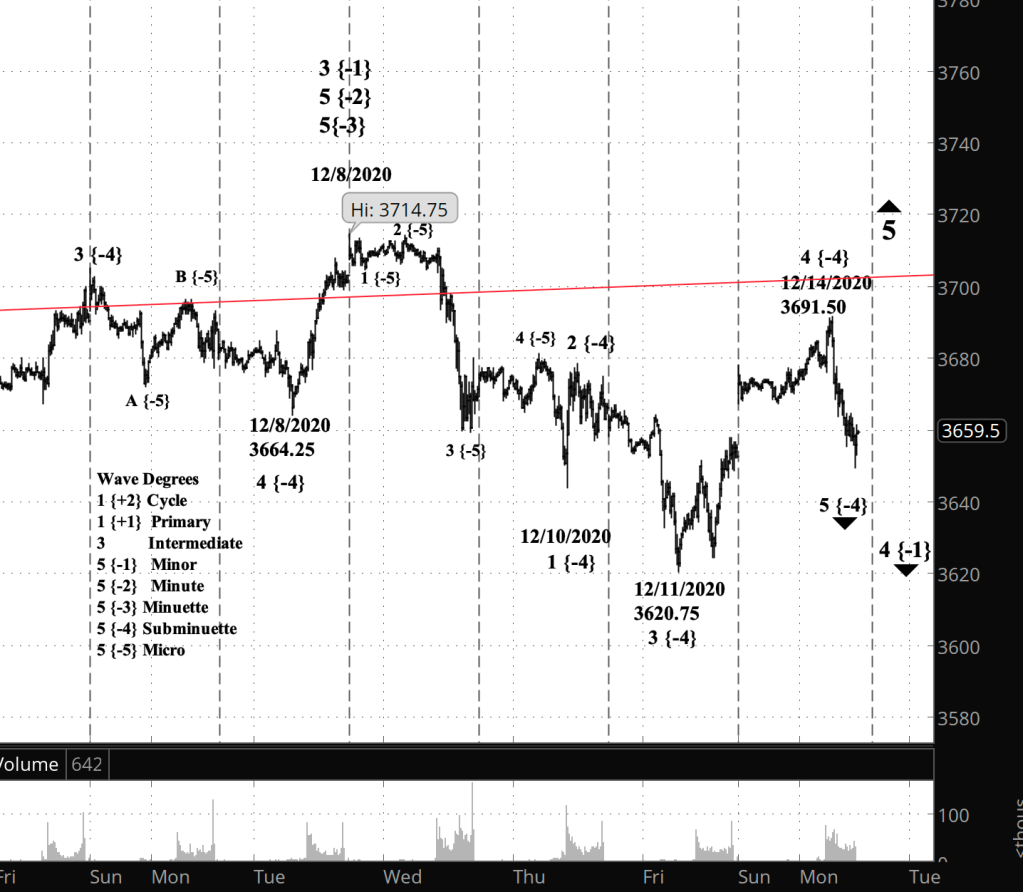
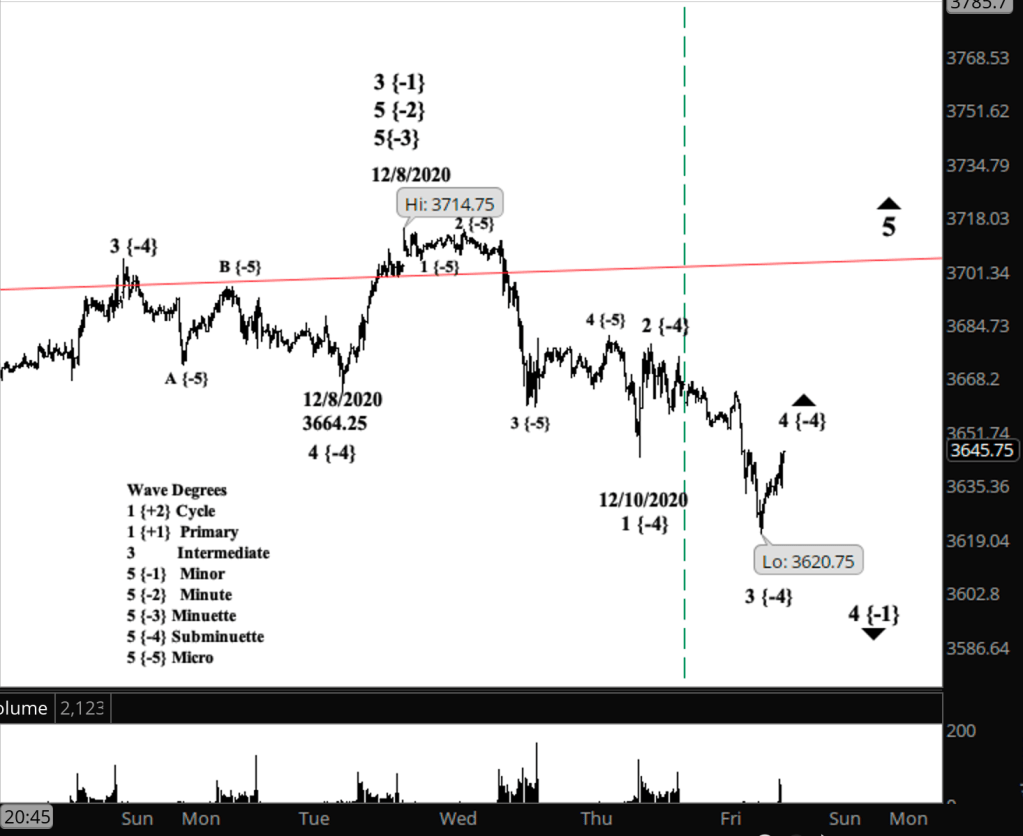
What’s happening now? The S&P 500 future traded narrowly within a 25-point range overnight, tracing a downwave and an upward correction of very small degree.

What does it mean? The decline from yesterday’s peak of 3701.75 could be a step signaling a continuation of the upward correction that began December 20 as a compound structure.

What is the alternative? Or it could be the beginning of a downtrend that will carry the price into the 3500s.

[S&P 500 E-mini futures, at 12:38 p.m., 30-minute bars, with volume]

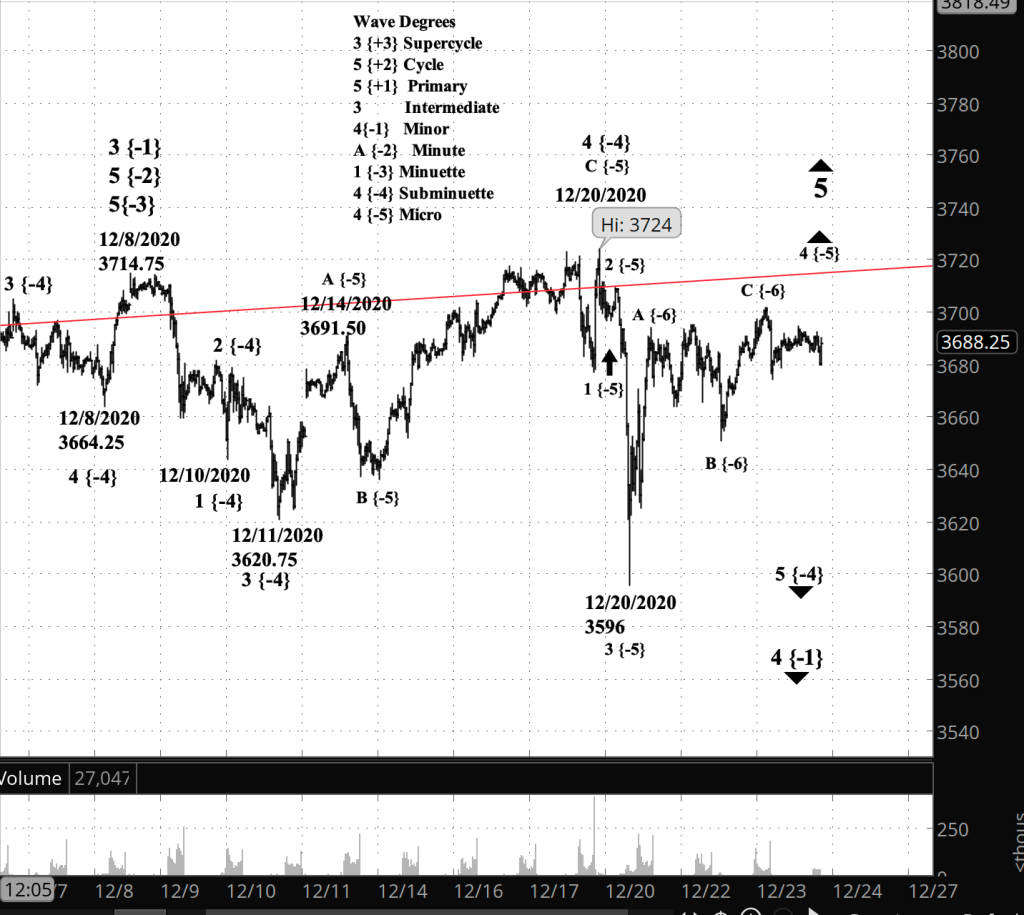
What does Elliott wave theory say? If the correction is still underway, then we’re seeing wave X of Micro degree, to be followed by a second corrective pattern. If the downtrend has resumed, then we’re seeing the first steps of wave 5 of Micro degree.

[S&P 500 index at 9:54 a.m., daily bars]

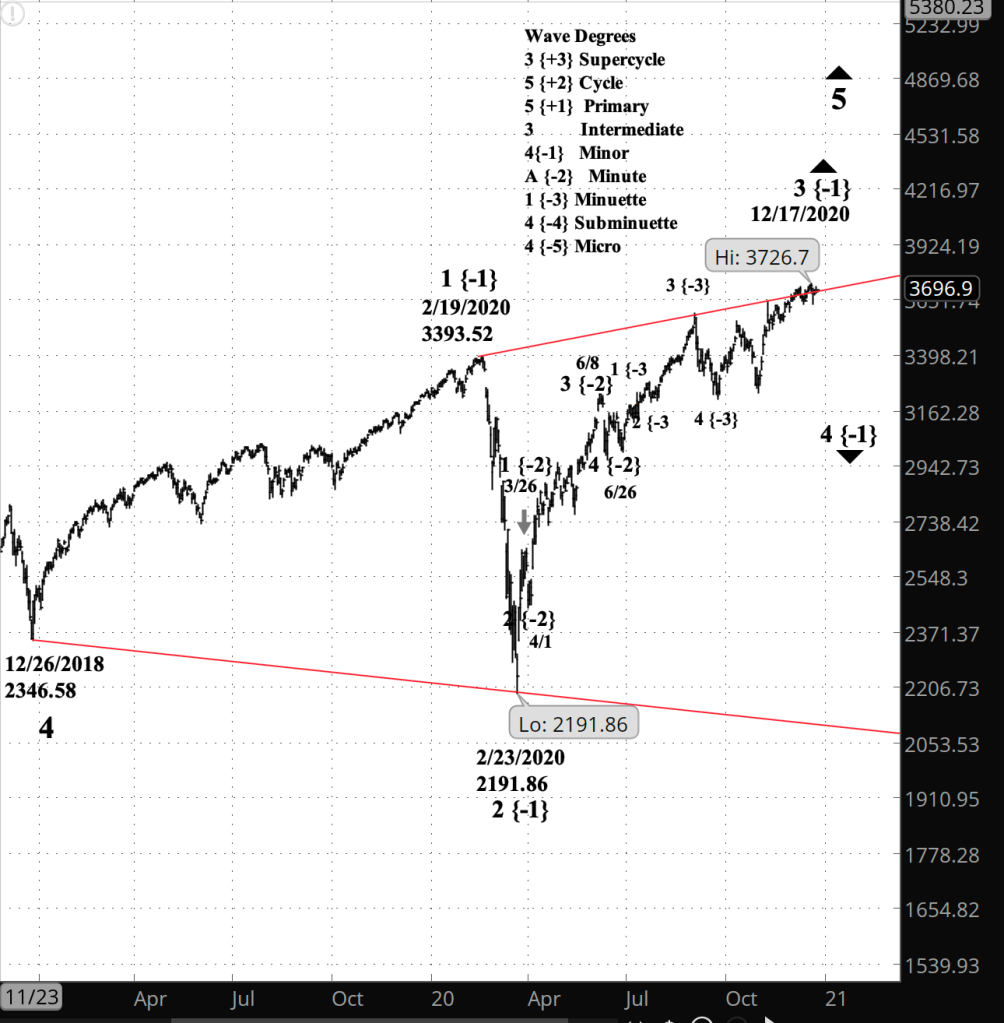
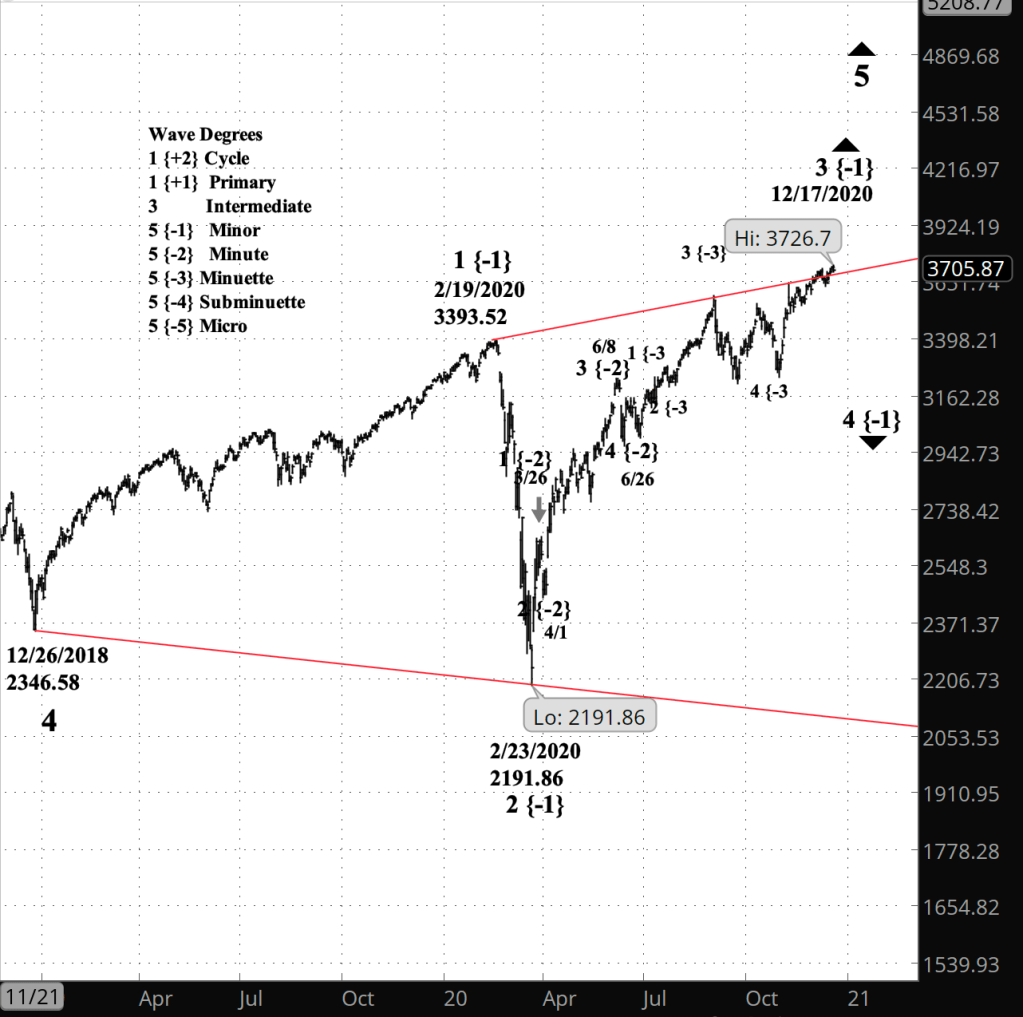
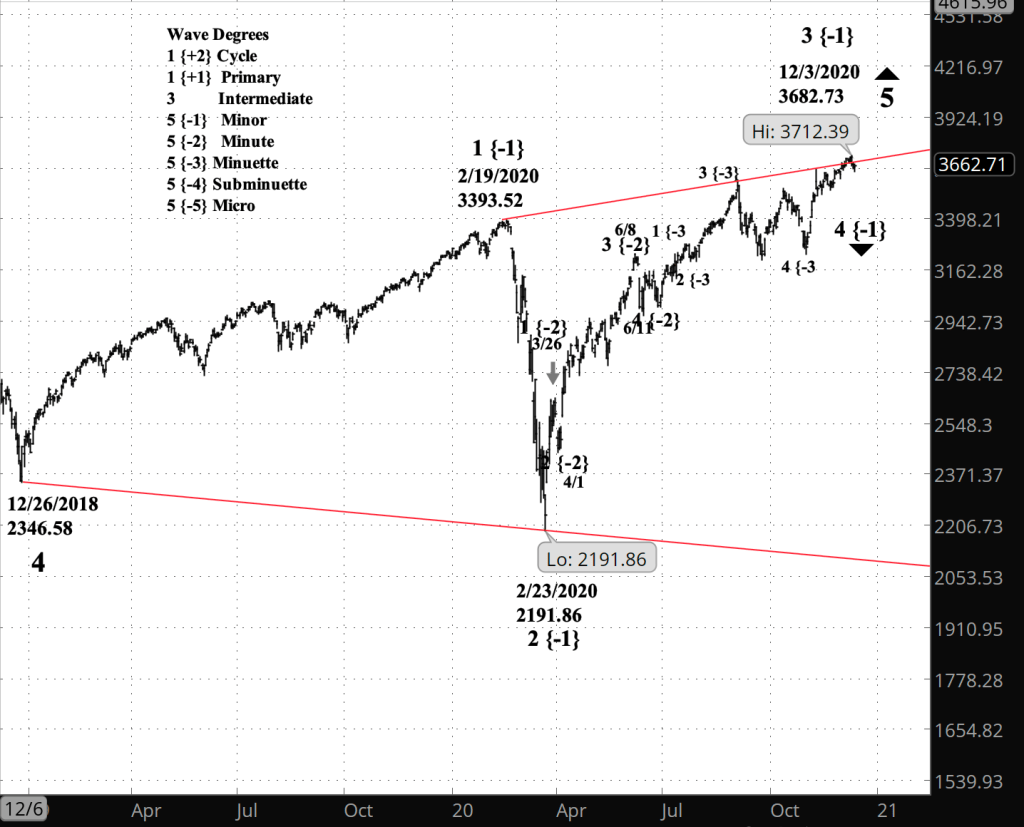
Big picture, the S&P 500 index continues to remain close to the upper boundary of a Diagonal Triangle that began on December 26, 2018. The triangle is the 5th, and final, subwave wave within Primary wave 5, which began in January 2009.

My trading strategy. I manage my profitable options positions 21 days before expiration. My present holdings, short bear call spreads on IWM, expire January 15, and the Christmas holiday on Friday is the day for management. However, IWM remains above 192 — the top of the profit zone — and so the position is presently unprofitable. I’ll hang on to it in the hope it will return to profitability, and if it doesn’t, I’ll pick the moment to take my loss.

Read More »

Wednesday, December 23, 2020

3:30 p.m. New York time

Half an hour before the closing bell. The S&P 500 peaked and drop back a little after — apparently — completing the 5th wave within wave C of Micro degree. If in fact C is indeed complete, then the ensuing decline will be either the first step of Subminuette wave 5 to the downside or the beginning of a downward wave X that will glue the corrective pattern just finished to another, future corrective pattern in a compound structure. I’ve updated the chart below.

10:30 a.m. New York time

What’s happening now? The S&P 500 index E-mini futures are working through the third wave of an upward correction that began December 20.

What does it mean? The correction, once complete, will be followed by a downtrend that initially will reach below the beginning of the correction’s beginning at 3596.

[S&P 500 E-mini futures, at 3:30 p.m., 35-minute bars, with volume]

What does Elliott wave theory say? The correction, the 4th wave of Micro degree, has so far traced three waves internally and is now rising in the C wave. The correction is happening within downtrending wave 5 of Subminuette degree, which began on December 20 from 3724.

There’s a lot of complexity to the chart, especially the interrelation of the degrees. To provide guide, I’ve changed the wave numbers in the “Wave Degrees” box to reflect my count on the chart. The low level movements I’ve been tracking are all part of wave 1 of Minuette degree within descending wave A of Minute degree within wave 4 of Minor degree, the latter being a correction within rising wave 5 of Intermediate degree, which began in 2018.

Read More »

Tuesday, December 22, 2020

3:30 p.m. New York time

Half an hour before the closing bell. The S&P 500 a little and then rose back a little during the day in what could be interpreted as either a continuation of the 4th wave of Subminuette degree or the beginning of Subminuette wave 5. There’s still a great deal of ambiguity. In either case, the potential upside movement is limited under the rules of Elliott Wave analysis, so my expectations lean toward a decline. I’ve updated the chart below.

9:40 a.m. New York time

What’s happening now? The S&P 500 E-mini futures overnight continued the rise that began December 20 and have so far completed three waves. In trading before the opening bell it hooked downward and continued to decline slowly in the early minutes of the session.

What does it mean? The rise is a low-level upward correction within a downtrend that is in its third wave. The correction is likely to extend beyond three waves, tracing a compound structure, delaying the eventual decline.

What is the alternative? The upward correction, when complete, will be followed by a decline that is likely to carry the price back into the 3500s.

[S&P 500 E-mini futures at 3:30 p.m., 30-minute bars, with volume]

What does Elliott wave theory say? The rise from the December 20 low is wave 4 of Subminuette degree. Fourth waves tend to extend and always form a different pattern from the preceding 2nd wave. The parent wave of Subminuette 4 is downtrending wave 5 of Minuette degree, which began from the December 20 peak of 3724, and within it, Subminuette wave 2 was a simple Zigzag pattern. So I expect that we’ll see a compound structure, with the segments being separated by an X wave to the downside.

Read More »

Monday, December 21, 2020

3:30 p.m. New York time

Half an hour before the closing bell. The S&P 500 recovered about three-fourths of its early morning decline, and then faltered a bit. Impossible to say yet whether the rising wave 4 of Micro degree is complete or not. I’ve updated the chart below.

9:40 a.m. New York time

What’s happening now? The S&P 500 E-mini futures fell sharply overnight, from a high of 3724 down to 3596, and then turned a rose to the 3660s.

What does it mean? The speed and scope of the decline suggests that a significant decline has begun that will carry the S&P 500 away from the sideways pattern it has traced all month.

What is the alternative? As before, it’s possible that the S&P 500 still has some upside left. The overnight decline may prove to be yet another false start on the downward track.

[S&P 500 E-mini futures at 3:30 p.m., 25-minute bars, with volume]

What does Elliott wave theory say? By my principal count, wave 4 of the Subminuette degree ended this morning at 3724, and from that point Subminuette wave 5 began.

My trading strategy. IWM, the stock backing my short bear call options spreads, dropped back close to the profit zone for the first time since December 15. I’ll manage the position on December 24 or 26 if it is profitable to any extent, and shall exit earlier if it attains 50% of maximum potential profit.

The S&P 500 has changed. Tesla (TSLA) this morning was added to the S&P 500, replacing Apartment Investment and Management Co. (AIV), a company now trading at $4 plus change.

TSLA’s weight in the index will be far greater than AIV’s, thanks to the automaker’s market cap of $658.79 billion, compared to $703.37 million for AIV. TSLA will rank #7 in the index ranking by market cap, below Facebook (FB) and above the former #7, Berkshire Hathaway (BRK.A and BRK.B).

TSLA is a high beta stock, at 2.25, more than double AIV’s beta of 0.9. So my best guess is that TSLA, because of its greater size and beta, will produce an index that will be more volatile than than it was before.

One thing to watch will be implied volatility and implied volatility rank. The exchange-traded fund SPY tracks the S&P 500. SPY’S at-the-money call options expiring January 15 had an IV of 19.55% on Sunday, before TSLA became part of the index. SPY’s IV rank, which compares the IV to its historical performance, was 13.4% on Sunday.

Read More »

Friday, December 18, 2020

3:30 p.m. New York time

Half an hour before the closing bell. The S&P 500 and its derivatives continued to fall for much of the day, reaching the 3670s. I’ve updated the “Close up” chart, below.

10:20 a.m. New York time

What’s happening now? The S&P 500 E-mini futures moved to a higher high overnight, touching 3723, then reversed and fell nearly 30 points in the minutes before and after the opening bell.

What does it mean? As before, the peak could be the end of the upward correction that began December 11, or at least i’s first phase, a possibility buttressed by the steepness of this morning’s decline. If the correction is indeed over, then the decline would be a resumption of the downtrend that began December 8. If the correction is extending into a compound pattern, then the decline would be a wave that separates two corrective patterns.

What is the alternative? The present pattern within upward correction could still have a bit more upside left.

[Close up: S&P 500 E-mini futures at 3:30 p.m., 20-minute bars, with volume]

What does Elliott wave theory say? If the correction is over, this morning’s peak ended wave 4 of Subminuette degree and began Subminuette wave 5, as shown in the chart above. If the correction is extending in a compound pattern, the peak began downtrending Subminuette wave X, a separator wave.

All of this is happening within downtrending wave A of Minuette degree within wave 4 of Minor degree, which in turn is a subwave of uptrending wave 5 of Intermediate degree, which began December 26, 2018 and has taken the form of a Diagonal Triangle, as seen in the chart below.

[Big Picture: S&P 500 index, daily bars]
Read More »

Thursday, December 17, 2020

3:30 p.m. New York time

Half an hour before the closing bell. The S&P 500 futures continue to trade above the upper boundary of the Diagonal Triangle that began in December 2018 and that continues to define, roughly, the upper boundary of the present rise, the 5th wave of Intermediate degree. In today’s trading the price briefly dropped below the boundary but quickly bounced back, while remaining below the high, 3717.50 (3725.12 on the index), that may mark the peak of the upward correction, wave 4 of Subminuette degree. I’ve updated the chart below.

9:35 a.m. New York time

What’s happening now? In the hour before the opening bell the S&P 500 E-mini futures index rose to 3717.50 and reversed.

What does it mean? That level fulfills all of the qualifications of the final subwave of the upward correction that began December 11. However, the upward correction could move still higher, it could reverse and then add another corrective pattern, or it could signal the end of the upward correction and the beginning of a downtrend reaching into the 3600s or below.

[S&P 500 E-mini futures at 12:31 a.m., 20-minute bars, with volume]

What does Elliott wave theory say? The upward correction is wave 4 of Subminuette degree, which is in its 5th wave and may in fact have completed it. The subwave is wave C of Micro degree, and within it are five subwaves, as required by the rules of Elliott analysis.

Read More »

Wednesday, December 16, 2020

3:30 p.m. New York time

Half an hour before the closing bell. The S&P 500 E-mini futures have eased up to a higher high this afternoon, so wave C of Micro degree still had a bit more rise in it. I’ve updated the chart below.

10:15 a.m. New York time

What’s happening now? The S&P 500 index and its derivatives completed the upward correction that began December 12, or at least the first pattern within it if the correction should prove to be a compound structure. The peak, attained in overnight trading, was 3701.75 on the E-mini futures, and 3698.97 on the index.

What does it mean? Completion of the correction in the Subminuette degree means the beginning of the final Subminuette wave down to below the 3620 mark, and perhaps significantly below.

What is the alternative? If the overnight high is only the end of the first pattern within a compound correction, then the price will fall in an X wave that separates patterns, and will be followed by either a another corrective pattern. An X wave has three subwaves.

[S&P 500 E-mini futures at 3:30 p.m., 20-minute bars, with volume]

What does Elliott wave theory say? The correction that may have peaked overnight, close to 8 a.m. New York time, is the Subminuette 4th wave, a variety of corrective wave that is prone to compounding. If the decline that began this morning is the beginning of the next Subminuette wave — wave 5 — then it will have five subwaves of Micro degree. If the decline is an X wave, it will have three subwaves.

All of this is happening within wave 4 of Minor degree, a downtrending corrective wave, which in turn is within uptrending wave 5 of Intermediate degree.

My trading strategy. Here’s how I approach the complex nested waves structures in Elliott wave analysis: If it’s a short-term play, such as options, I’m paying attention to the Subminuette degree in order to profit from the Minuette degree. If its a longer-term play, such as shares, I’m paying attention to the Minute degree in order to profit from the Minor degree.

Read More »

Tuesday, December 15, 2020

3:40 p.m. New York time

20 minutes before the closing bell. The S&P 500 continued its C-wave rise in the Micro degree and then reversed slightly, which may or may not indicate the rise is over. I’ve updated the chart below.

10:30 a.m. New York time

What’s happening now? The S&P 500 index and its derivatives reversed after a three-wave decline and rose, although remaining below yesterday’s high.

What does it mean? The reversal clarifies that the upward correction that began December 11 is still underway, completing its middle wave in overnight trading and rising in its third, and possibly final, wave.

[S&P 500 E-mini futures, 20-minute bars, with volume]

What does Elliott wave theory say? Wave A of Micro degree began its rise December 11 and ended on December 14, beginning the declining wave B, which ended last night around midnight. The present rise is Micro wave C. All of this is happening within wave 4 of Subminuette degree within wave 5 of Minuette degree.

A 4th wave correction tends to trace a sideways movement — a three-wave Flat rather than a three-wave Zigzag — and quite often will trace a compound pattern, gluing on another Flat or a Zigzag, connected to the first pattern with an X wave. There’s no way to tell at this point whether Subminuette 4 will extend through compounding.

Read More »

Monday, December 14, 2020

3 p.m. New York time

One hour before the closing bell. The S&P 500 and its derivatives fell after peaking at 3691.50. That level marks the end of wave 4 of Subminuette degree and the beginning of Subminuette wave 5. I’ve updated the chart below.

6:40 a.m. New York time

What’s happening now? The S&P 500 E-mini futures gapped up by 18 points when trading resumed Sunday evening New York time. The upward correction continued to rise another 15 points in overnight trading before reversing.

What does it mean? Internally, the rise from Friday’s low has three subwaves, suggesting that the correction is at or nearing its end. Once it is complete, the next move will be to the downside.

[S&P 500 E-mini futures, 15-minute bars, with volume]

What does Elliott wave theory say? The upward correction that began December 11 is wave 4 of Subminuette degree. It breaks down into three subwaves, as is normal for corrective patterns. The final subwave, the C wave of Micro degree, breaks into five subwaves. So it’s very late in the game for the parent 4th wave.

The end of wave 4 will kick off a downtrending wave 5 of Subminuette degree, which will decline past — perhaps significantly past — the end of the preceding 3rd wave, at 3620.75. The end of wave 5 will also complete wave A of Subminuette degree within wave 5 of Minuette degree and wave 5 of Minute degree, which in turn are within wave 4 of Minor degree.

My trading strategy. I’m holding my bear positions.

Read More »

Friday, December 11, 2020

3:30 p.m. New York time

Half an hour before the closing bell. The S&P 500 closes the week continued to run just below the upper boundary of a Diagonal Triangle of Intermediate degree that began two years ago.

[S&P 500 Index, daily bars]

10 a.m. New York time

What’s happening now? The S&P 500 index and its derivatives declined overnight by about 60 points, reaching 3620.75 on the E-mini futures and then bounced by 10 points.

What does it mean? Thursday’s high ended an upward correction within the downward trend that began December 8. Today’s overnight drop is the main leg of downtrend. These are all early steps in a downward correction of greater magnitude. this morning’s bounce upward will be followed by a final downwave within the three-day-old downtrend.

[S&P 500 E-Mini futures, 15-minute bars, with volume]

What does Elliott wave theory say? The decline since yesterday is wave 3 of Subminuette degree, several subwave levels down from Minute wave A within Minor wave 4 to the downside.

Read More »