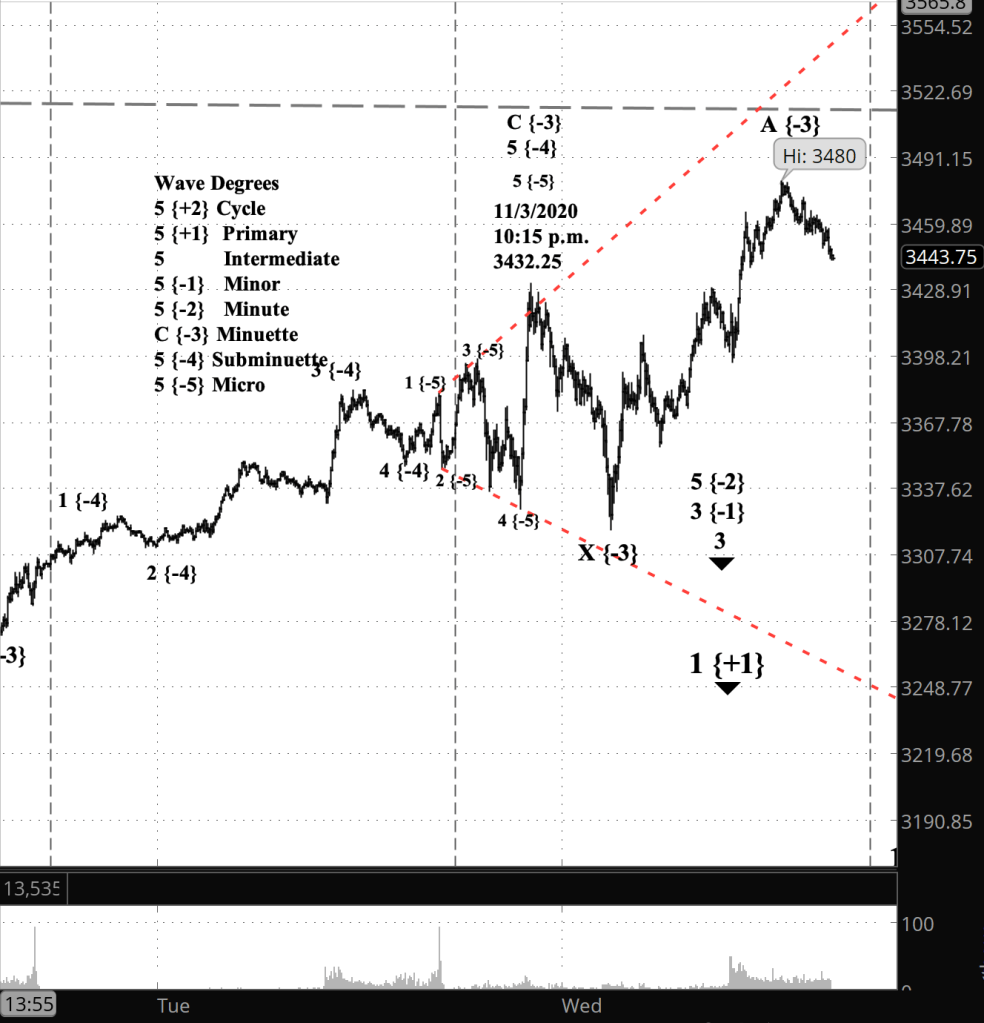
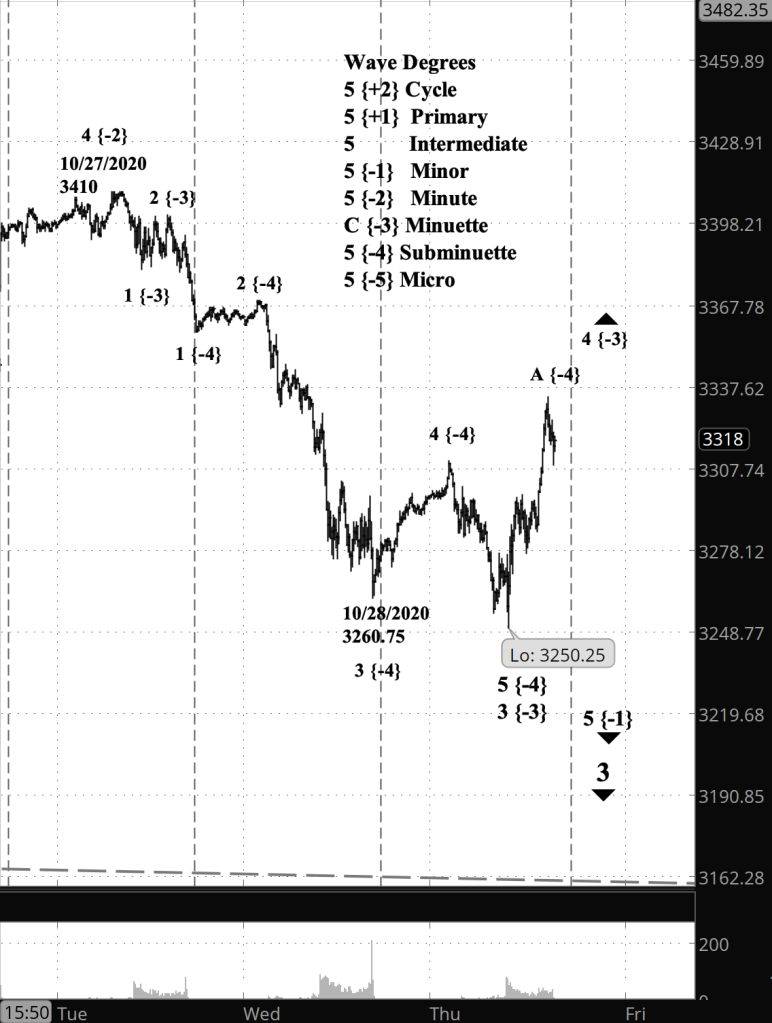
3:20 p.m. New York time
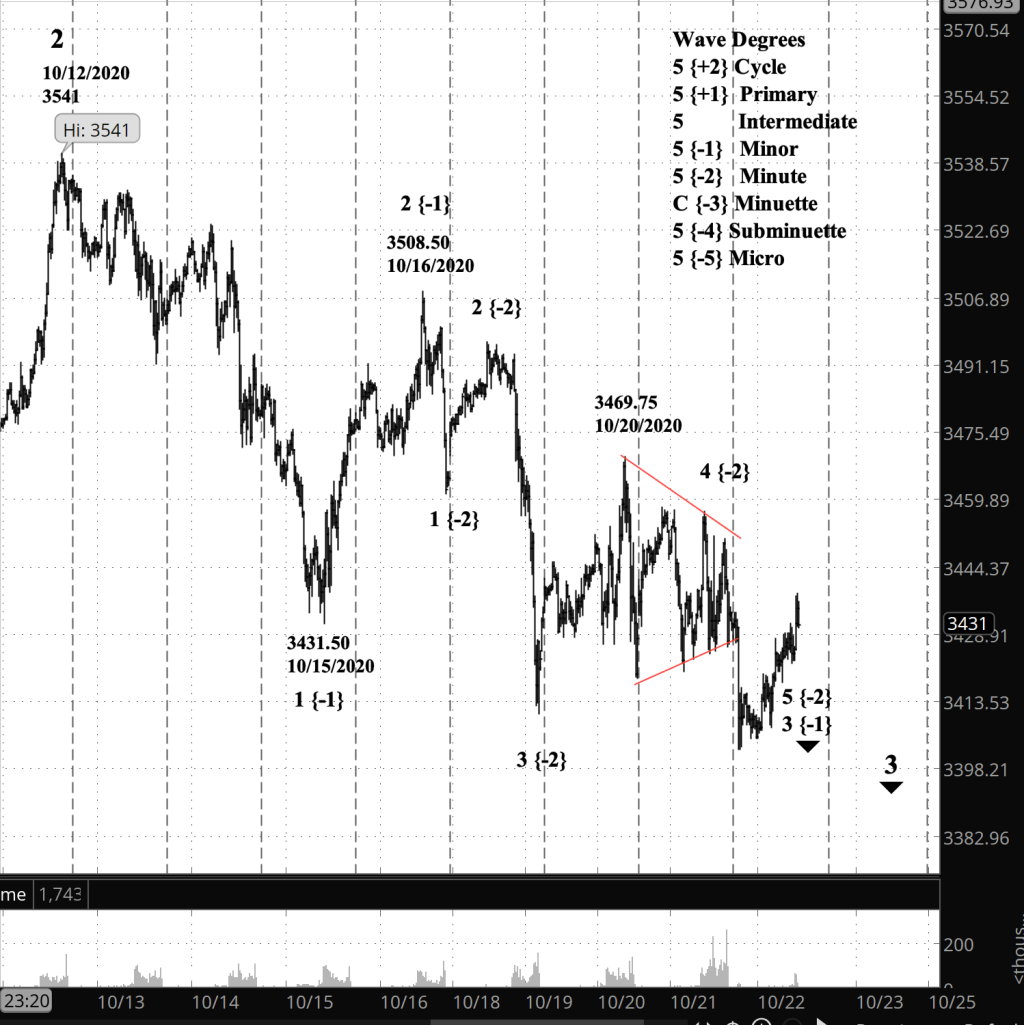
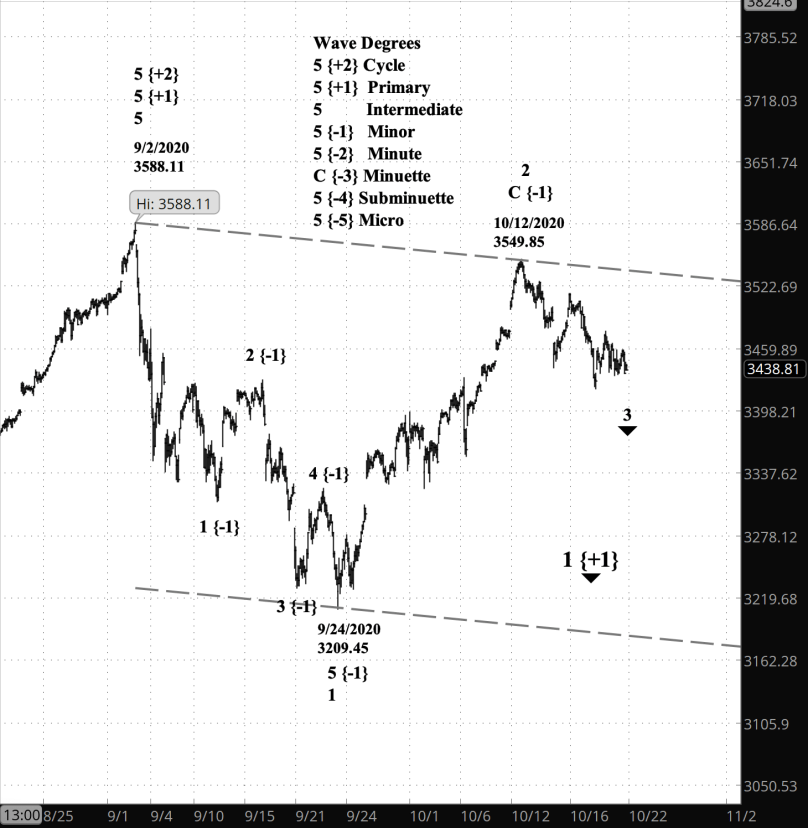
As it turned out, the X-wave alternative proved to be the S&P 500’s pattern. I’ve updated the count, showing today’s rise being an A wave of Minuette degree within a second corrective pattern connected to the first corrective pattern by the overnight decline (X wave of Minuette degree). All of this is happening with a 4th wave of Minute degree.
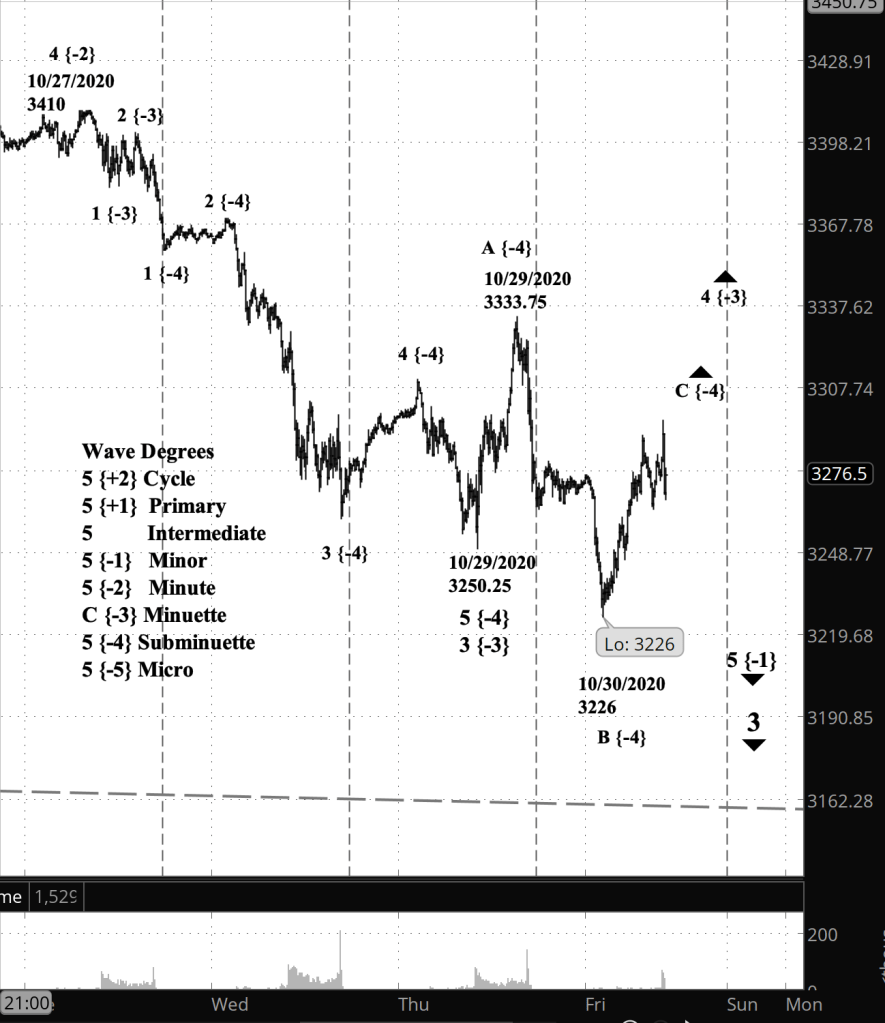
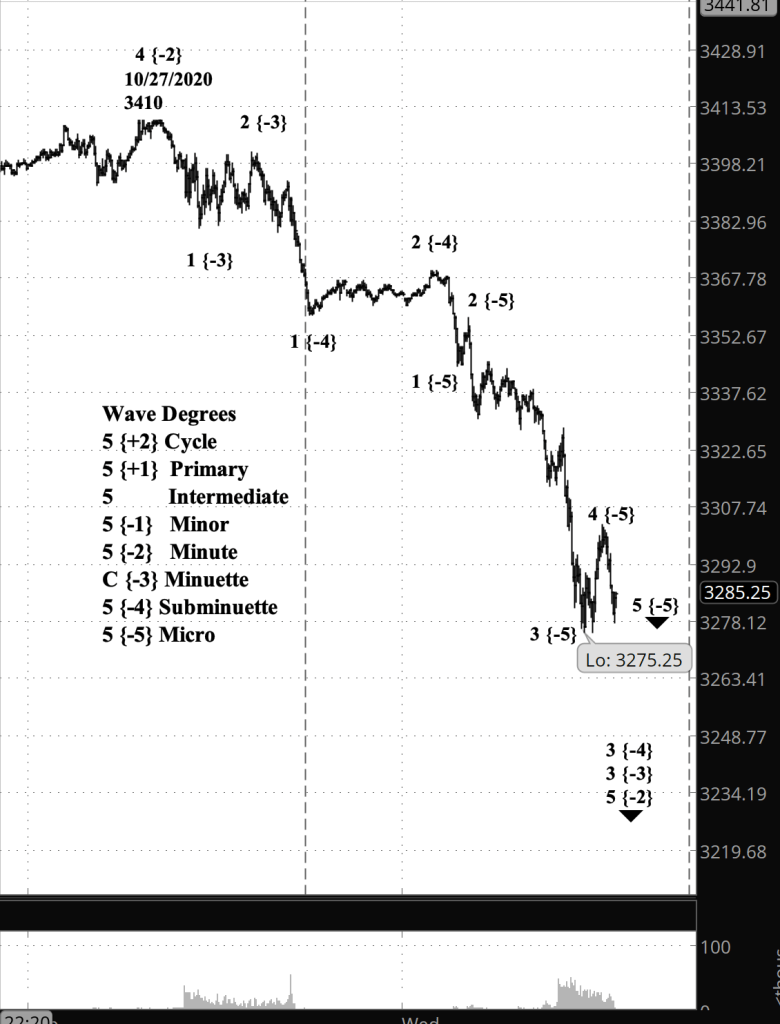
9:40 a.m. New York time
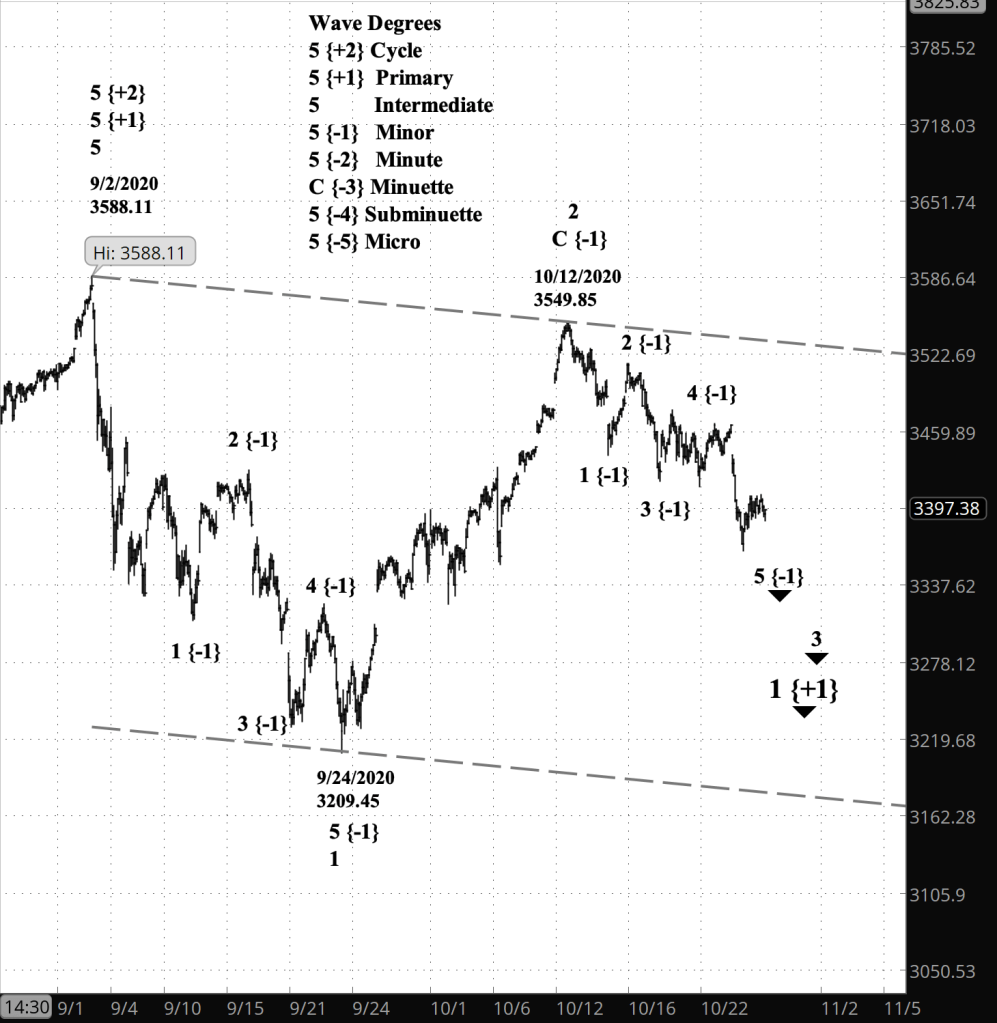
The futures markets on the major indexes had a dramatic night that commentators excitedly credited to the vast uncertainties in the American presidential election vote count. Elliott wave analysts, on the other hand, calmly marked up their charts, concluding that the drama was nothing more than typical 5th wave triangle pattern, setting up a resumption of the decline that began in February.
What’s happening now? The S&P 500 E-mini futures beginning at 9:30 p.m. underwent a rapid swing that in a couple of hours covered about 100 points each way.
What does it mean? The pattern is typical of the concluding movement in the direction of a larger movement. The swing occurred in an upward movement within an upward correction.
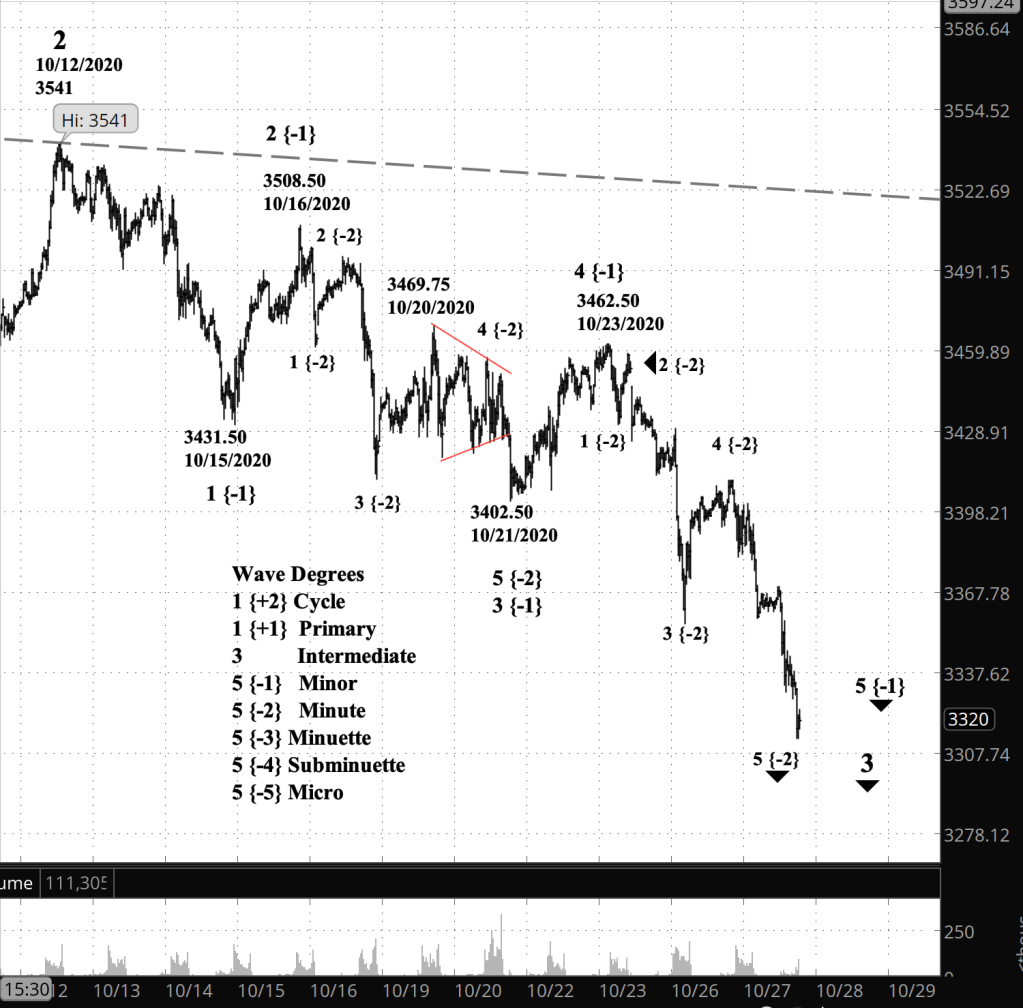
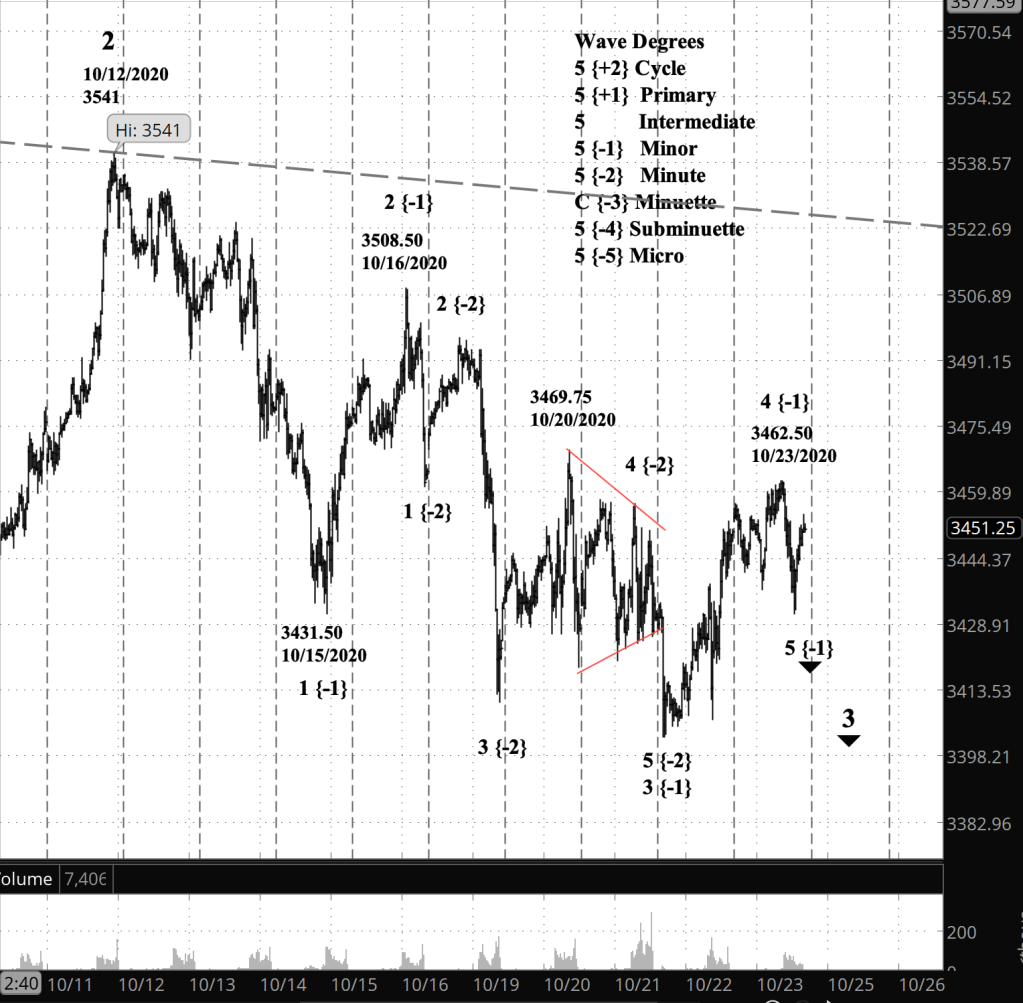
What is the alternative? On the chart I marked last night’s high as the end of the pattern. It’s possible to count the pattern so that an additional high will in fact be the end.
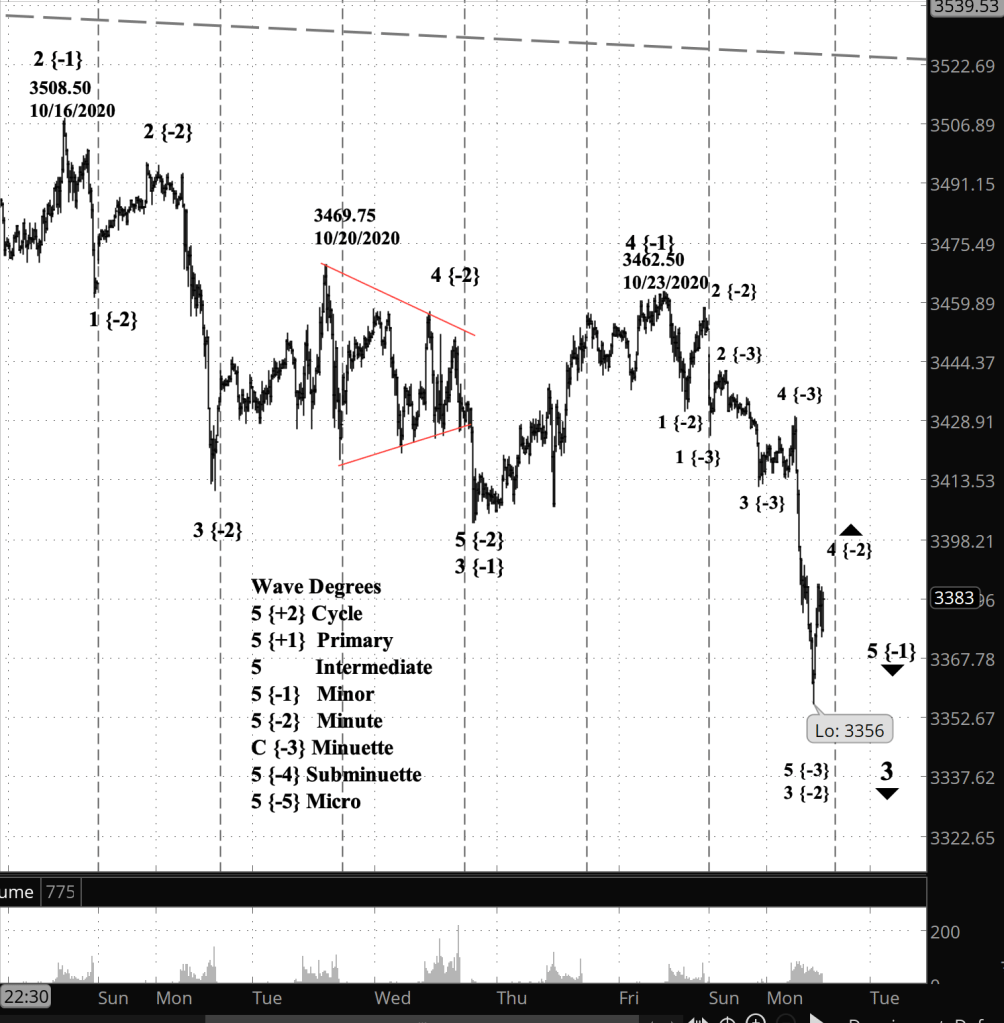
What does Elliott wave theory say? The horizontal triangle, marked in red, is the 5th wave of Subminuette degree within the C wave of Minuette degree, both within and marking the end of the 4th wave correction of Minute degree. The ensuing decline will either be the 5th and final wave, of Minute degree, within the declining 3rd wave of Minor degree. Or it could be an X wave of Minute degree, a boundary between two corrective pattern within a compound structure.
My trading strategy. I’m staying away from any new options position until I understand the present decline: Minute 5 is a trade; Minute X is a warning to stay away.
Read More »

You must be logged in to post a comment.