4:30 p.m. New York time
A funny thing happened on the way to the weekend. The reversal point of July 6, the point at which an upward correction ended and the main trend downward reserved, was pierced on Friday, at the end of trading, by the S&P 500 index.
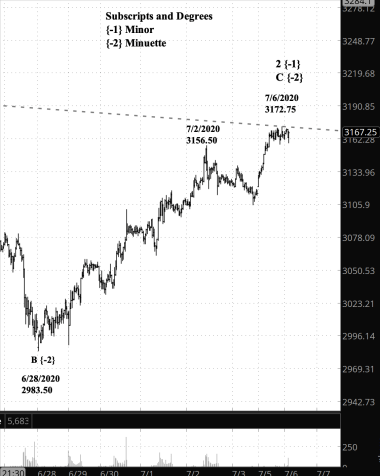
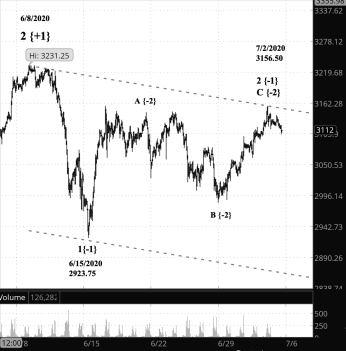
That in itself isn’t strange, except that the S&P 500 E-mini futures, the main object of my daily analysis, fell short of the turning point. Here’s a chart comparison:
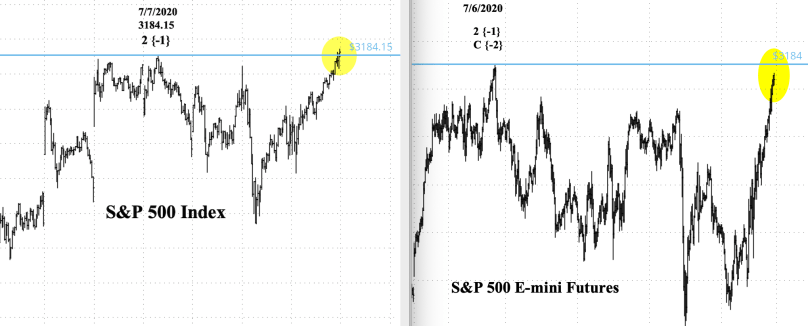
The difference is important in Elliott wave analysis, the method I use to place “You Are Here” sign that brings some order out of the chaos of market price movements. If a 3rd wave in the direction of the main trend breaks beyond its own starting point, then that suggests that the preceding wave 2nd wave is still in progress.
The index broke past its starting point. The futures did not. Both are part of the large ecosystem that relies on the prices 505 stocks issued by 500 companies. It is those stock prices, weighted by capitalization, that make up the index and all products derived from it.
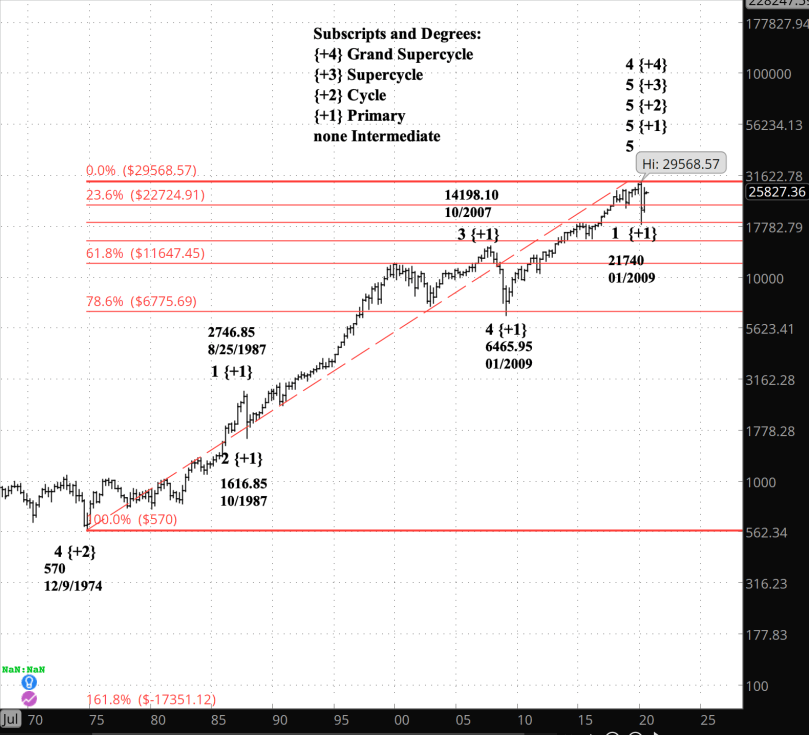
When Elliott developed his analysis, between 1938 and 1946, the blue chips index was the Dow Jones Industrial Average. When people spoke of what the “market” was doing, they meant the Dow. There were no related products to confuse the issue.
Today, it’s different. The S&P 500 index is the primary means of assessing the blue chip stocks, and if the index is the sun, then it is surrounded by a generous solar system of orbiting derivatives: At least 14 exchange-traded funds, some which move inversely to the index, some of which are weighted, and some of which are both, and the the E-mini futures, the most recent contract expiring September 18. And there are of course options on the index and on the exchange-traded fund SPY, the most important of the ETFs.
The problem isn’t that there are differences among the charts for each derivative — it would be shocking if they didn’t diverge a little, given the complex differences in price setting among so many products.
Instead, the question is how, under Elliott’s rules, should the divergence be treated? It’s more than a little nonsensical to think of the S&P 500 index as being in an upward correction wave while its futures are in a downward motive wave. It’s like a an Orwellian 1984 world where Winston Smith says he sees four fingers, not five. “And if the Party says that it is not four but five -— then how many?, asks the high rank party member O’Brien. “Sometimes they are all of them at once.”
Not living in Oceania, happily, we don’t have to endure such a paradox. As traders we get to decide how to interpret the evidence within the bounds of rationality.
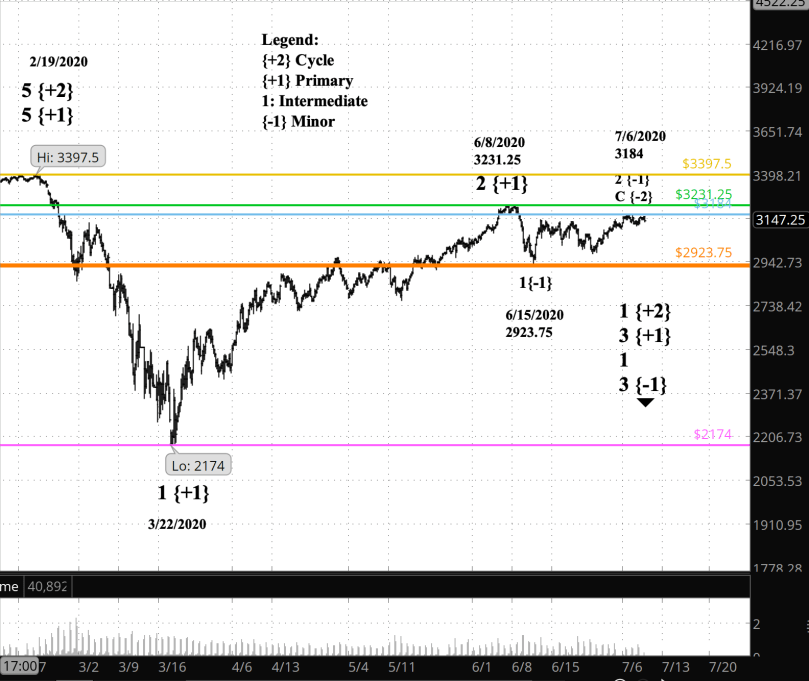
I compared three major S&P 500 products. The July 10 low was the peak reached at the end of trading, shortly before all three products shut down trading for the weekend. The July 6 signal line is the peak on that date that I counted as the end of Minor wave 2 within a larger upward correction.
SYM |
7/10 HIGH |
7/6 SIGNAL LINE |
THROW-OVER? |
7/10 HIGH FROM SIGNAL (absolute) |
DISTANCE, MEAN % |
| E-mini futures | 3181.25 | 3184.00 | no | 0.086% | 0.00149 |
| index | 3186.87 | 3184.15 | yes | 0.085% | 0.00022 |
| SPY x 10 | 3178.80 | 3176.80 | yes | 0.063% | 0.00000 |
Of the three products, two had a throw-over past the July 6 signal line: The index itself and the exchange-traded fund SPY (I’ve multiplied the SPY prices by 10 to give them the same magnitude as the other two products. The “7/10 High from Signal” column shows the distance from the signal line as a percentage, and the “Distance Mean %” column shows the divergence from the percentage mean of the three products (the index at -0.085%).
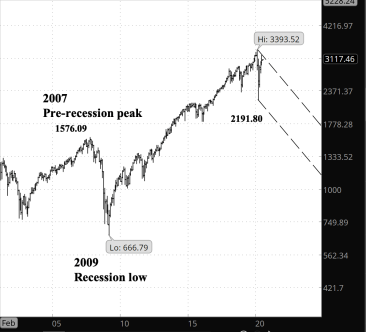
An inverse S&P 500 exchange-traded fund, SDS, also moved beyond the signal line, as did the NASDAQ index. the Down Jones Industrial average, however, did not break through the signal point.
The breakthrough is really not very deep. the distance is so small that a random sample poll would be hard to keep it beyond the margin of error. To put it in perspective: A national opinion poll of voters, to obtain a 3% margin of error (6% confidence interval), would need to interview 0.4% of the nation’s 255.2 million voters, or 1.0 million people. To obtain the 0.172% confidence interval (0.086%) of the three products I analyzed, would need to interview 93% of the nation’s 255.2 million voters, or 236.6 million people. In both cases I used a 95% confidence level.
So, when futures trading resumes Sunday evening, I’m going to consider the count too close to call. Brand new rule: No signal is actionable unless all three of my major S&P 500 charts agree; the futures, the index, and SPY. Also, I shall leave my futures chart analysis as it is until I see what happens next.
The value of Elliott wave theory doesn’t lie in its ability to forecast the future, which is entirely unknowable. Rather, it is valuable because provides a key to what happens next for each of a several possible interpretations. Elliott at its core teases out the significance of interpretations. It allows us to go beyond the “bull!”, “bear!”, “stocks rose today”, “stocks fell today” cheerleader mentality to a space where the no future is knowable, but the meaning of each possible future is clearly assayable. I find that to be incredibly valuable.


You must be logged in to post a comment.