3/29 – 3:30 p.m. New York time
I am calling a close to my trading day, with one new position: EWZ. No exits.
3/29 – 3:30 p.m. New York time
I am calling a close to my trading day, with one new position: EWZ. No exits.
L Brands Inc. (LB)
Update 5/20/2017; LB gapped sharply to the downside immediately upon the publication of earnings, recovered about half the decline, moved further to the downside and then returned several times to the 50% retracement level. I exited the bear call spread portion of the position on May 15, allowing the bull put spread side to expire without value on May 20.
During the lifepsan of the position, shared rose by a net 43.1% over 53 days, or a +297% annual rate. The options position produced a +4.2% yield on debit for a +29% annual rate.
LB has sufficiently high implied volatility by several measures to support a trade.
I shall use the MAY series of options, which trades for the last time 52 days hence, on May 19.
Implied volatility stands at 31%, which is 2.7 times the VIX, a measure of the volatility of the S&P 500 index.
LB’s IV stands in the 52nd percentile of its annual range and the 39th percentile of its most recent broad movement.
SPDR S&P Retail ETF (XRT)
Update 5/12/2017: XRT rose steadily beyond my position’s zone of profitability and then, in last five trading days, retreated, allowing me to exit at $1.46, or 25.1% of maximum potential profit, almost precisely at my target.
Shares showed a net rise of 2.7% over 46 days, or a +21% annual rate. The options position produced a 33.6% yield on debit for a +266% annual rate
XRT has sufficiently high volatility to qualify for trading.
I shall use the MAY series of options, which trades for the last time 53 days hence, on May 19.
Implied volatility stands at 20%, which is 1.5 times the VIX, a measure of the volatility of the S&P 500 index.
XRT’s IV stands in the 43rd percentile of its annual range and the 47th percentile of its most recent broad movement.
SPDR S&P Regional Banking ETF (KRE)
Update 5/10/2017: KRE swung in the zig-zag pattern characteristic of a sideways correction, with time decay eventually bringing it to profitability I exited at 25% of maximum potential profit.
Shares produced a net rise of 3.0% over 44 days, or a 25% annual rate. The options position produced a 33.3% yield on debit for a 277% annual rate.
KRE’s implied volatility stands sufficiently high for me to meet my standards for trading.
I shall use the MAY series of options, which trades for the last time 53 days hence, on May 19.
Implied volatility stands at 26%, which is double the VIX, a measure of the volatility of the S&P 500 index.
KRE’s IV stands in the 43rd percentile of its annual range and the 52nd percentile of its most recent broad movement.
A third and final estimate of 4th quarter gross domestic product will be published on Thursday. Other major reports: International trade in goods on Tuesday and personal income and outlays on Friday.
All three reports will be released at 8:30 a.m. New York time.
Federal Reserve Chair Janet Yellen addresses the National Community Reinvestment Coalition’s annual conference in Washington, D.C. on Tuesday at 12:50 p.m. Her topic: Addressing Workforce Development Challenges in Low-Income Communities.
SPDR S&P 500 ETF (SPY)
Update 3/31/2017: SPY rose continually after I entered the position. I exited with 21 days before expiration and with the profit at 6% of its maximum potential. Further upward movement will make the position unprofitable.
My goal was 25% of the maximum, but I decided to eliminate the risk of a loss for two reasons.
First, the spread I constructed had quite a narrow profit zone. That’s what the options grid allowed. In retrospect, it might have been better to have simply passed on the trade.
Second, the Elliott wave analysis of short-term movements presents an uncertain view of the future. I count the price as having being in an A wave upward retracement of a 3rd wave to the downside within a higher-level downward movement that began on March 1. The upward thrust has retraced a Fibonoacci 61.8% of the 3rd wave, reaching a common reversal point.
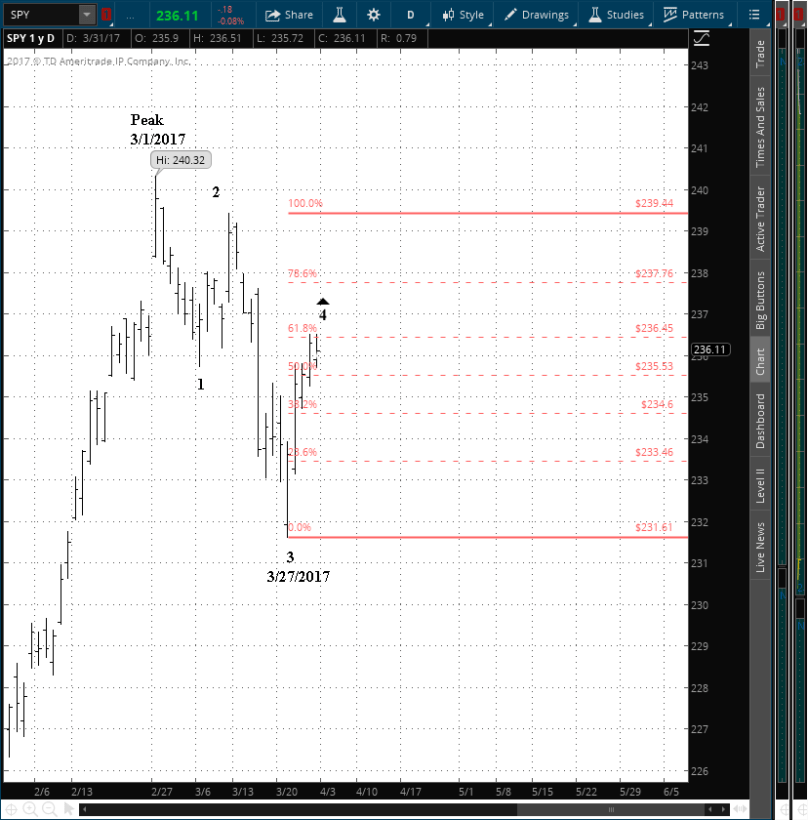
Fibonacci retracements come with no guarantees. Moreover, a 4th wave like as not will take a sideways form, such as a Flat. Rather than risk the loss, it made more sense to me to take what profits I could and come back another day with a structure more likely to succeed.
Shares rose by 1.2% over seven days, or a +64% annual rate. The options position produced a 6.4% yield on debit for a +336% annual rate.
SPY’s implied volatility has risen to a relatively high level within a very narrow range.
I shall use the apr series of options, which trades for the last time 28 days hence, on April 21.
Implied volatility stands at 13% and, by definition, is nearly identical with the VIX, a measure of the volatility of the S&P 500 index.
SPY’s IV stands in the 21st percentile of its annual range and the 79th percentile of its most recent broad movement.
3/24 – 3:08 p.m. New York time
I entered positIon on SPY based on a high position within a very narrow range and exited COST for a loss.
I am attempting to exit NKE but it has not yet been filled. If the order should be filled, I shall update the live feed and add results to the analysis after the market close.
Micron Technology Inc. (MU)
Update 4/4/2017: MU gapped upward after earnings were published and then fluctuated within a narrow sideways band. I considered the pattern to be unlikely to return to profitability prior to expiration and I exited.
At the close shares were up 8.2% over 12 days, or a +249% annual rate. The options position produced an 11.8% loss on debit for a -360% annual rate.
MU publishes earnings on Thursday after the closing bell.
I shall use the APR series of options, which trades for the last time 29 days hence, on April 21.
Implied volatility stands at 49%, which is 3.9 times the VIX, a measure of the volatility of the S&P 500 index.
MU’s IV stands in the 37th percentile of its annual range and the 56th percentile of its most recent broad movement.


You must be logged in to post a comment.