SP500 Analysis

1:30 p.m. New York time

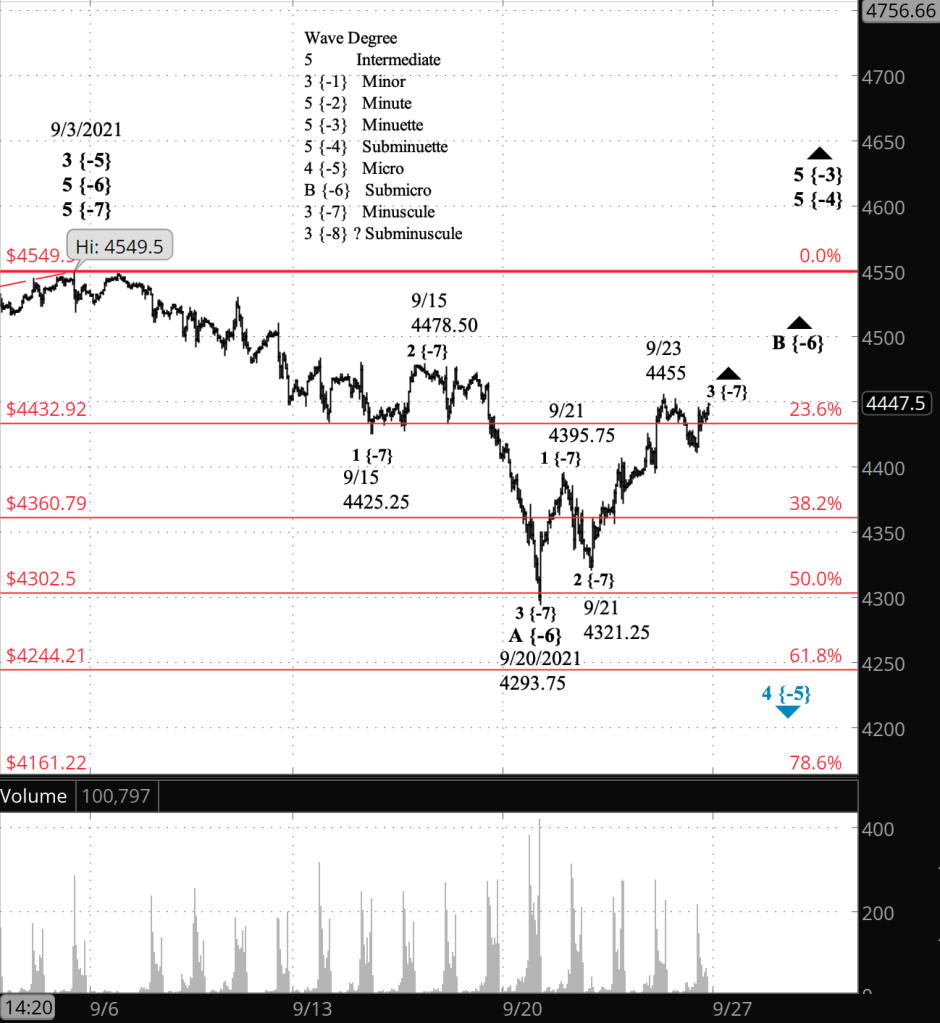
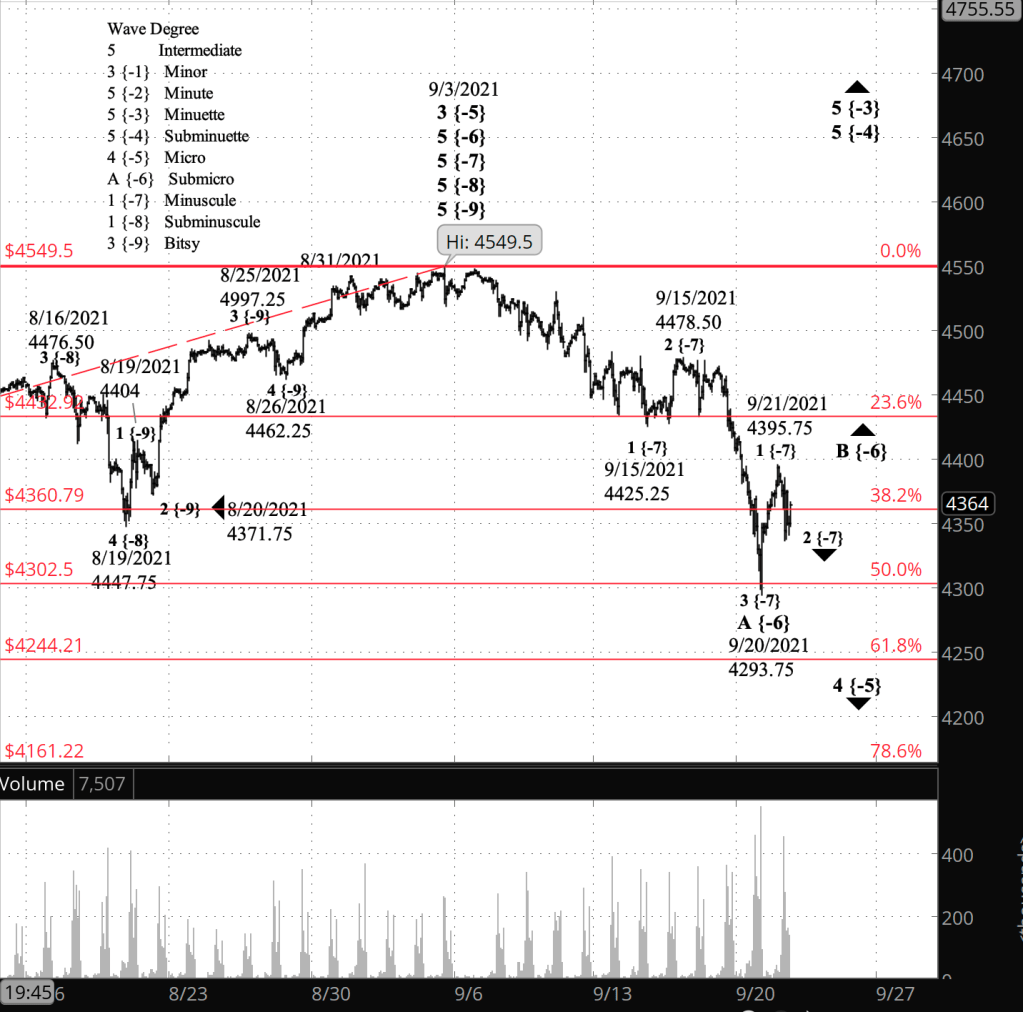
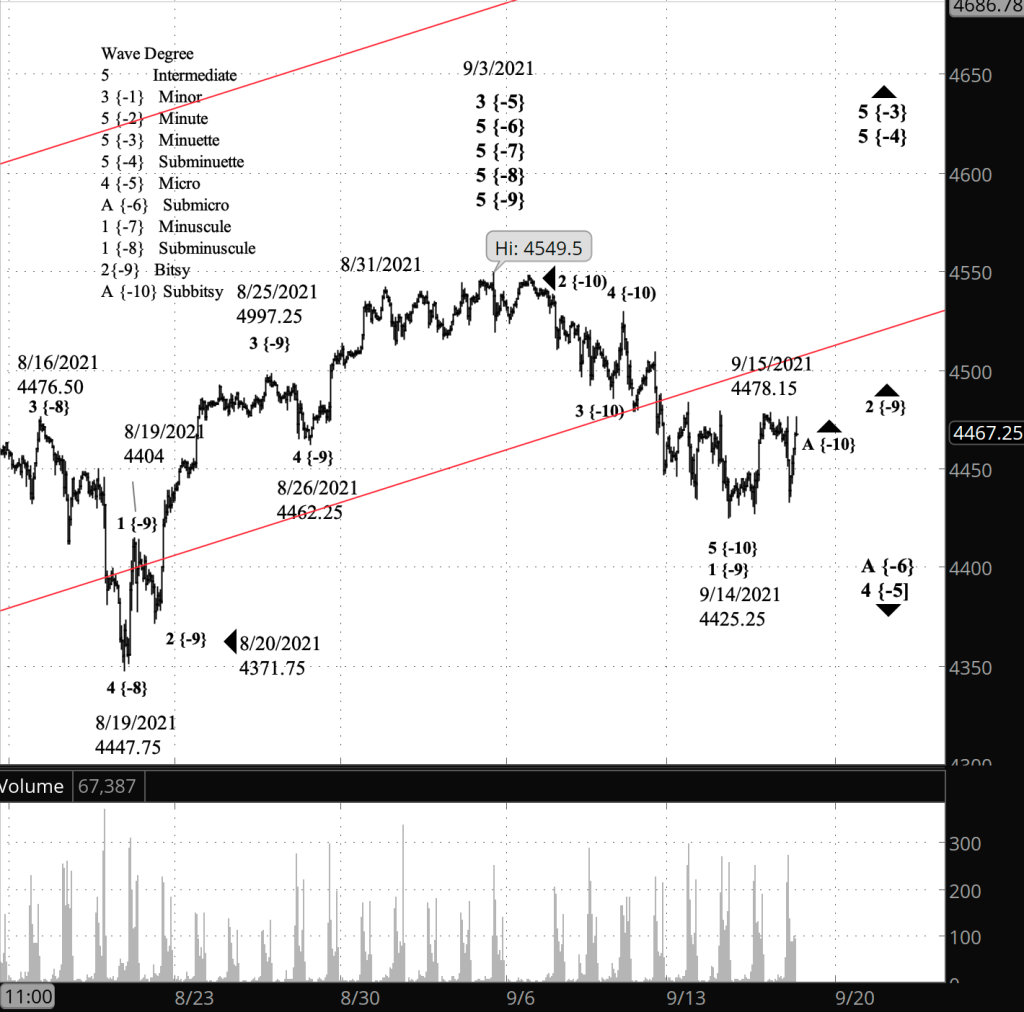
Two and a half hours before the closing bell. I’m breaking off early in order to get a Covid-19 booster jab. The S&P 500 has barely budged during the regular trading session. No change in the analysis. I’ve updated the chart.

9:40 a.m. New York time

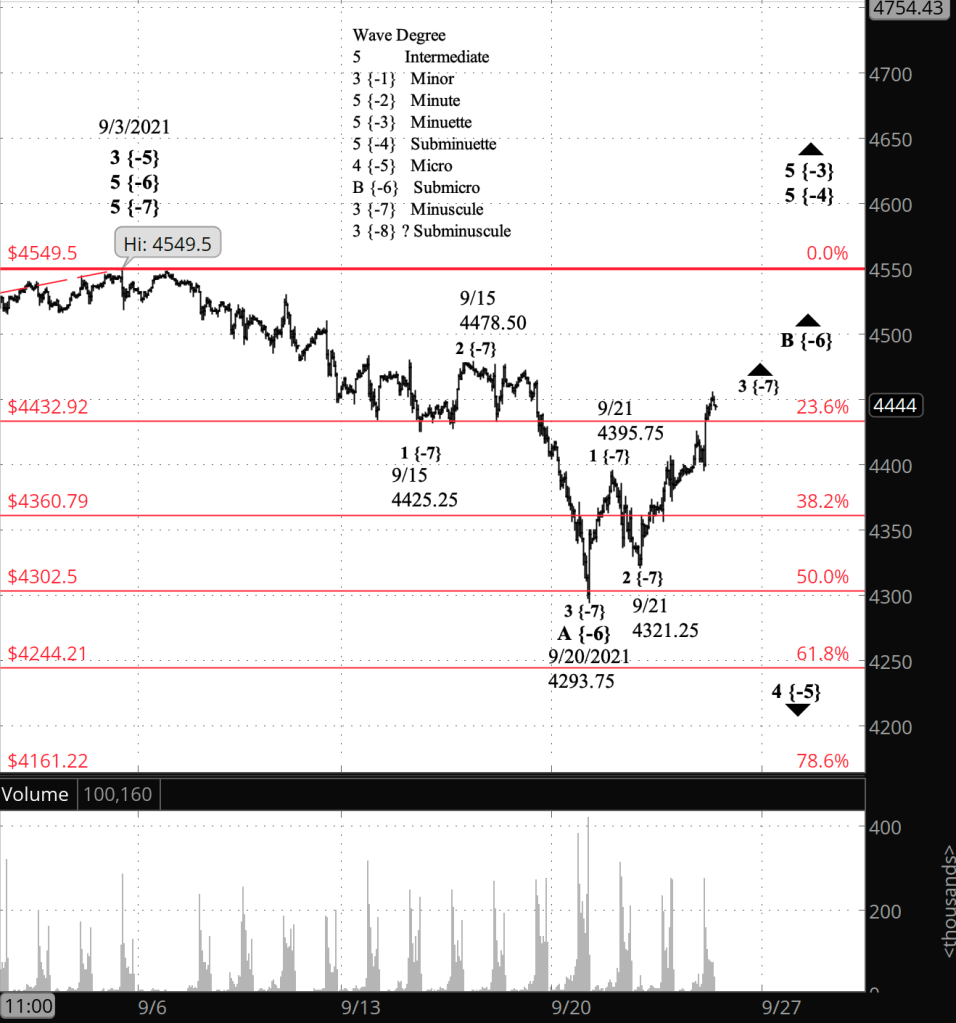
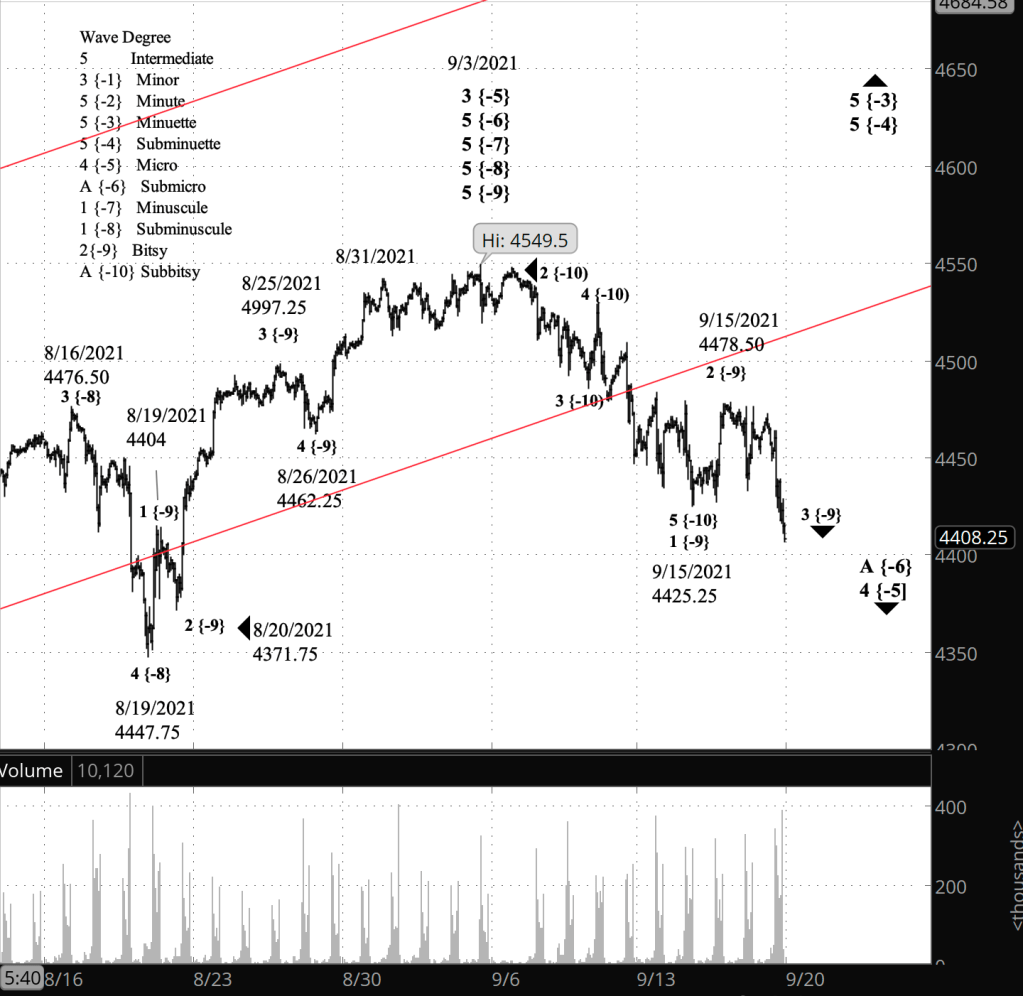
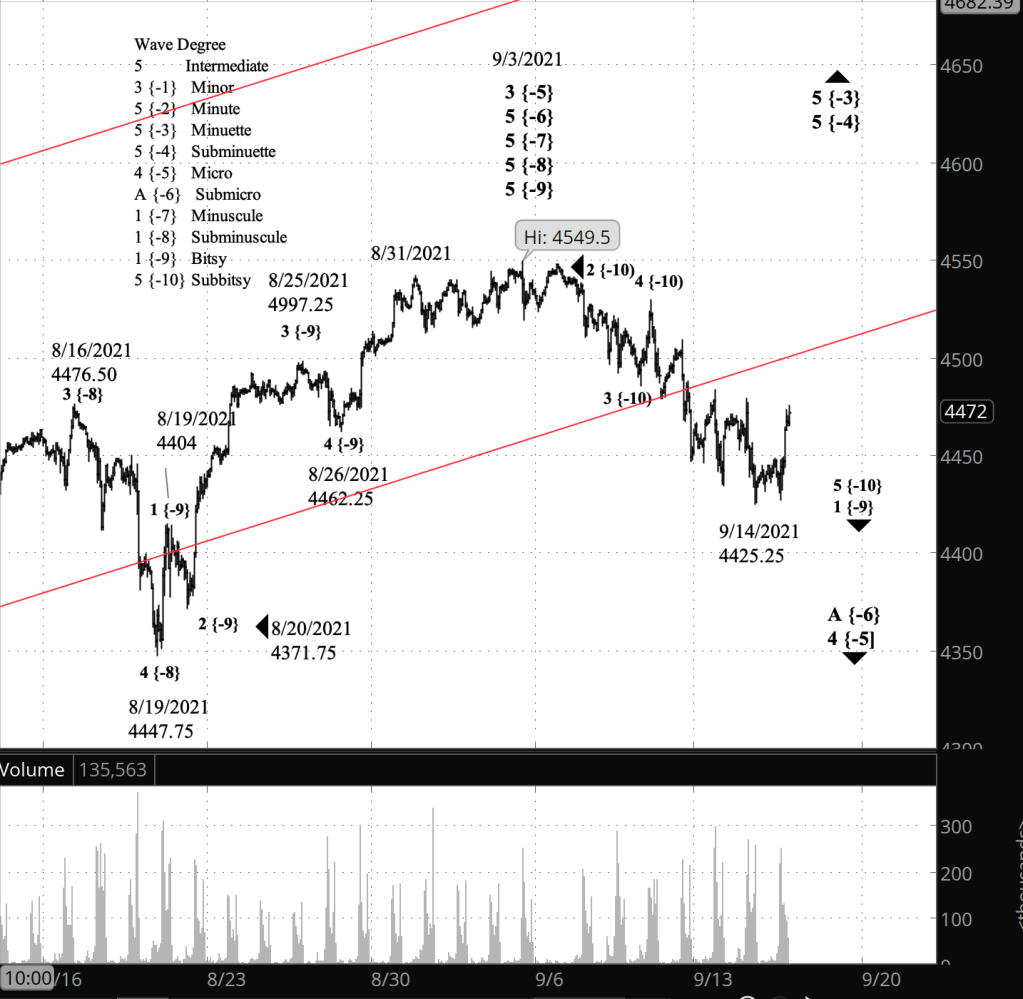
What’s happening now? The S&P 500 E-mini futures reached a high of 4472 in overnight trading and then fell.

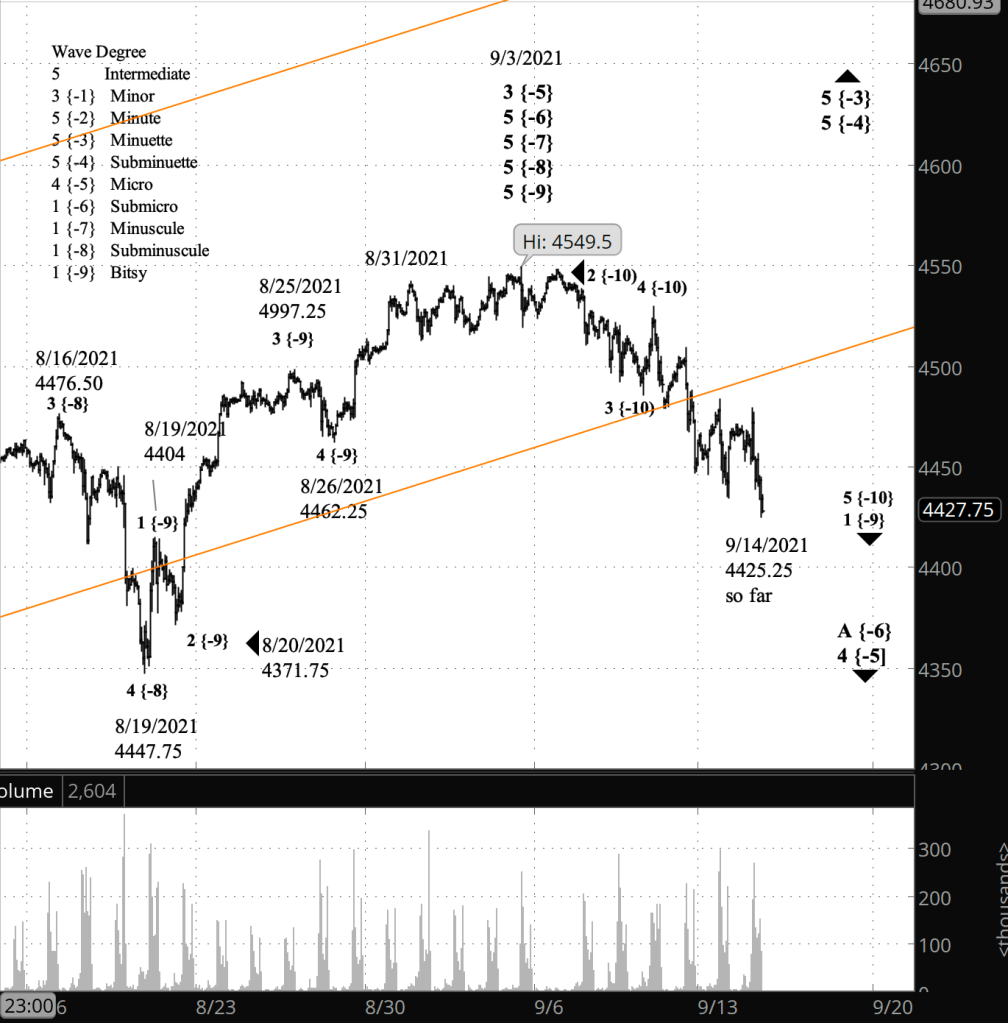
What does it mean? If the correction that began September 3 is a sideways pattern, as I think it will prove to be, then the rise that began September must reach at least 4523.93 before it ends, a 90% retracement of the preceding decline that began September 3. Under this pattern, the decline which will follow the present rise will return to the 4290s.

What’s the alternative? If the rise falls short of 4523.93 then the correction is tracing a more directional pattern. I.e., at it’s completion, it likely will reach a lower level than the 4290s, probably much lower.

[S&P 500 E-mini futures at 1:30 p.m., 55-minute bars, with volume]

What does Elliott wave theory say? The decline from September 3 is wave 4 of Micro decree, which appears to be taking a Flat pattern. Internally, the price is in wave B of Submicro. Within a Flat correction, the B wave must retrace at least 90% of the preceding A wave. In this correction, that means the price must rise to at least 4523.93.

If the price moves above 4523.93, then the wave 4 pattern is something other than Flat: Perhaps a Zigzag or a Triangle of some sort.

Learning and other resources. Elliott wave analysis provides context, not prophecy. As the 20th century semanticist Alfred Korzybski put it in his book Science and Sanity (1933), “The map is not the territory … The only usefulness of a map depends on similarity of structure between the empirical world and the map.” And I would add, we can judge that similarity of structure only after the fact.

See the menu page Analytical Methods for a rundown on where to go for information on Elliott wave analysis.

By Tim Bovee, Portland, Oregon, September 27, 2021

Disclaimer

Tim Bovee, Private Trader tracks the analysis and trades of a private trader for his own accounts. Nothing in this blog constitutes a recommendation to buy or sell stocks, options or any other financial instrument. The only purpose of this blog is to provide education and entertainment.

No trader is ever 100 percent successful in his or her trades. Trading in the stock and option markets is risky and uncertain. Each trader must make trading decisions for his or her own account, and take responsibility for the consequences.

License
Creative Commons License

All content on Tim Bovee, Private Trader by Timothy K. Bovee is licensed under a Creative Commons Attribution-ShareAlike 4.0 International License.

Based on a work at www.timbovee.com.

SP500 Analysis

3:30 a.m. New York time

Half an hour before the closing. The S&P 500 fell in overnight trading and then rose during the day, remaining about 40 points below yesterday’s high. No change in the analysis. I’ve updated the upper chart.

9:35 a.m. New York time

What’s happening now? The S&P 500 E-mini futures declined in overnight trading, from a high of 4455.

What does it mean? The decline is a downward correction within the middle, rising wave in a larger downward correction. The middle wave has not yet reached its target; see the Elliott wave theory section, below.

What’s the alternative? If the middle wave fails to reach that target, then the form taken by the larger correction is different than I expected. More below in the Elliott wave theory section.

Charts. The upper chart examines the near term, from the beginning of September. The lower chart examines the long term, from the start of October 2018. The Fibonacci retracement ladder on the near-term chart shows retracement of wave 3 of Micro degree, which began on May 19.

[S&P 500 E-mini futures at 3:30 p.m., 50-minute bars, with volume]
[S&P 500 index at 9:30 a.m., 2-day bars]

What does Elliott wave theory say? First, the near term. The rise that began September 20 is wave B of Submicro degree within wave 4 of Micro degree. I expect the 4th wave to take the form of a Flat — a shallow correction, alternating with the Zigzag form of the preceding 2nd wave.

In a Flat, wave B must retrace at least 90% of the preceding wave A — that’s a firm rule in Elliott wave analysis. A 90% retracement of the A wave that began on September 3 would bring the price up to 4523.93. Wave B’s high so far is 4455, so the wave has at least another 69 points to go before meeting that requirement.

Although the alternation of form between a 2nd wave and a 4th wave is common, it’s not a requirement in Elliott wave theory. Although 2nd waves tend to take the Zigzag form and 4th waves, the Flat form, it is not unheard of for both to be Zigzags or both to be Flats. If the 4th wave is taking a Zigzag form, then wave B commonly retraces 38% to 79% of wave A. The Zigzag retracement range would be from 4391 to 4497, and so wave B has met this tendency (not a requirement).

Next, the long term. The expanding Diagonal Triangle of Intermediate degree that began December 26, 2018 is still underway. With it, wave 3 of Micro degree ended on September 3 and wave 4 of Micro degree is now underway. The 4th wave will eventually reach, come near to or exceed the lower boundary of the Diagonal Triangle, which keeps moving lower every day. At present, the boundary stands at about 2000. The 4th wave will be followed by a 5th wave back to the upper boundary, which is moving higher every day. The end of wave 5 of Micro degree will mark the Diagonal Triangle, and the end of wave 5 of Intermediate degree, as well as the end of 5th waves the next three levels higher, of Primary, Cycle and Supercycle degrees, the latter having begun in the Great Depression of the 1930s. (In several earlier posts I misidentified the Supercycle degree underway as the 3rd wave. The 5th wave is correct.)

Learning and other resources. Elliott wave analysis provides context, not prophecy. As the 20th century semanticist Alfred Korzybski put it in his book Science and Sanity (1933), “The map is not the territory … The only usefulness of a map depends on similarity of structure between the empirical world and the map.” And I would add, we can judge that similarity of structure only after the fact.

See the menu page Analytical Methods for a rundown on where to go for information on Elliott wave analysis.

By Tim Bovee, Portland, Oregon, September 24, 2021

Disclaimer

Tim Bovee, Private Trader tracks the analysis and trades of a private trader for his own accounts. Nothing in this blog constitutes a recommendation to buy or sell stocks, options or any other financial instrument. The only purpose of this blog is to provide education and entertainment.

No trader is ever 100 percent successful in his or her trades. Trading in the stock and option markets is risky and uncertain. Each trader must make trading decisions for his or her own account, and take responsibility for the consequences.

License
Creative Commons License

All content on Tim Bovee, Private Trader by Timothy K. Bovee is licensed under a Creative Commons Attribution-ShareAlike 4.0 International License.

Based on a work at www.timbovee.com.

SP500 Analysis

3:30 p.m. New York time

Half the hour before the closing bell. The S&P 500 moved above the 23.6% Fibonacci retracement level during today’s trading session. The present rise, wave B of Submicro degree, can be expected to retrace 90% or more of the preceding wave A, which gives an upside target of at least 4523.93. After the B wave peaks, a C wave will carry the price down to the low 4300s or a bit below, completing the corrective pattern within wave 4 of Micro degree.

9:40 a.m. New York time

What’s happening now? The S&P 500 E-mini futures continued to rise in overnight trading.

What does it mean? The rise is, possibly, the final leg of a smaller upward correction that began on September 20, within the middle leg of a larger downward correction that began on September 3. The correction could extend in a compound pattern — two corrective patterns in a row.

What’s the alternative? It’s possible that the smaller upward correction is one level smaller than my labelling would indicate, meaning that the correction has further to go that I thought.

[S&P 500 E-mini futures at 3:30 p.m., 50-minute bars, with volume]

What does Elliott wave theory say? The analysis is unchanged from yesterday’s post: A rising wave B of a Submicro degree correction within a declining wave 4 of Micro degree correction. Submicro wave A fell from its September 3 starting point down to a Fibonacci retracement level of 50% of the preceding wave 3 rise. Submicro wave B has risen to just below the 23.6% retracement level.

Learning and other resources. Elliott wave analysis provides context, not prophecy. As the 20th century semanticist Alfred Korzybski put it in his book Science and Sanity (1933), “The map is not the territory … The only usefulness of a map depends on similarity of structure between the empirical world and the map.” And I would add, we can judge that similarity of structure only after the fact.

See the menu page Analytical Methods for a rundown on where to go for information on Elliott wave analysis.

By Tim Bovee, Portland, Oregon, September 23, 2021

Disclaimer

Tim Bovee, Private Trader tracks the analysis and trades of a private trader for his own accounts. Nothing in this blog constitutes a recommendation to buy or sell stocks, options or any other financial instrument. The only purpose of this blog is to provide education and entertainment.

No trader is ever 100 percent successful in his or her trades. Trading in the stock and option markets is risky and uncertain. Each trader must make trading decisions for his or her own account, and take responsibility for the consequences.

License
Creative Commons License

All content on Tim Bovee, Private Trader by Timothy K. Bovee is licensed under a Creative Commons Attribution-ShareAlike 4.0 International License.

Based on a work at www.timbovee.com.

SP500 Analysis

3:30 p.m. New York time

Half an hour before the closing bell. The S&P 500 continued its rise throughout the day. Wave 3 of Minuscule degree within wave B of Submicro degree continues. No change in the analysis. I’ve updated the chart.

9:35 a.m. New York time

What’s happening now? The S&P 500 E-mini futures in overnight trading continued to work their way up the second part of an upward correction that began September 20.

What does it mean? A corrective pattern comes in three parts — down, up, down in this case — and the correction is presently in the middle, rising portion of its pattern. Internally, the middle leg has completed two waves and is presently in its third.

What’s the alternative? The open question is the relative size of the waves internal to the middle leg. More on that in the Elliott wave theory section, below.

[S&P 500 E-mini futures at 3:30 p.m., 45-minute bars, with volume]

What does Elliott wave theory say? The present correction is wave 4 of Micro degree. It is taking the form of a Flat, which means that internally, waves A and B will have three waves, and wave C will have five. Because of the fractal nature of market patterns, each internal wave within A, B and C will have its own, smaller internal waves that fit the patterns of Elliott wave theory. The patterns of the markets are identical at all levels, from a 50-year chart with quarterly bars down to the a daily chart with one-minute bars.

Waves A, B and the future C are of Submicro degree, and I have labelled the internal waves one level smaller, as Minuscule degree. But is that correct? Assessing the relative size of a wave in an ongoing pattern is often a matter of luck and intuition. If my Minuscule degree labelling is correct, then wave B will have three waves internally. If those waves should instead be one level lower, at Subminuscule degree with a subscript {8}, then we can expect five waves before Minuscule wave 1 within Subicro wave B is complete.

The price is presently near a 38.2% Fibonacci retracement of the preceding wave 3 of Micro degree, or 4360.79. The next major stopping point on the Fibonacci ladder is 23.6%, and the price at that level is 4432.92.

Learning and other resources. Elliott wave analysis provides context, not prophecy. As the 20th century semanticist Alfred Korzybski put it in his book Science and Sanity (1933), “The map is not the territory … The only usefulness of a map depends on similarity of structure between the empirical world and the map.” And I would add, we can judge that similarity of structure only after the fact.

See the menu page Analytical Methods for a rundown on where to go for information on Elliott wave analysis.

By Tim Bovee, Portland, Oregon, September 22, 2021

Disclaimer

Tim Bovee, Private Trader tracks the analysis and trades of a private trader for his own accounts. Nothing in this blog constitutes a recommendation to buy or sell stocks, options or any other financial instrument. The only purpose of this blog is to provide education and entertainment.

No trader is ever 100 percent successful in his or her trades. Trading in the stock and option markets is risky and uncertain. Each trader must make trading decisions for his or her own account, and take responsibility for the consequences.

License
Creative Commons License

All content on Tim Bovee, Private Trader by Timothy K. Bovee is licensed under a Creative Commons Attribution-ShareAlike 4.0 International License.

Based on a work at www.timbovee.com.

SP500 Analysis

3:30 p.m. New York time

Half an hour before the closing bell. The S&P 500 completed the first of three parts of its rise that began yesterday and began the second part, a downward correction within an upward correction. In Elliott wave terms, wave B of Submicro degree began yesterday, the present decline is wave 2 of Minuscule degree. Alternatively, what I’ve labeled as Minuscule degree could be one level smaller, a movement of Subminuscule degree, meaning that Minuscule wave 1 is still underway. As labeled, it’s an awfully short 1st wave, covering only 100 points of a retracement of a decline that covered nearly 260 points. I’ve updated the chart. No change in this morning’s analysis.

9:35 a.m. New York time

What’s happening now? The S&P 500 E-mini futures reversed from yesterday’s low of 4293.75, rising to 4395.74 in overnight trading.

What does it mean? Yesterday’s low marked the the first part of a three-part correction that began on September 3, and the subsequent rise is the beginning of the second, middle segment of the correction.

What’s the alternative? The still open question is what size the first two movements are in relation to the broader scope of the market. I discuss the issue in the Elliott wave theory section, below.

[S&P 500 E-mini futures at 3:30 apm., 75-minute bars, with volume]

What does Elliott wave theory say? As I noted yesterday, the size of the decline from September 3 suggested that the small-degree labels I had tentatively used for the decline need to be revised. And I have revised them, moving the decline from September 3 to September 20 up by two degrees, from wave 1 of Subminuscule degree to wave A of Submicro degree. The deciding factor was the movement of the price down to a 50% Fibonacci retracement of wave 1 of Micro degree. For a sideways correction, that’s about as much retracement as I can reasonably expect. So the decline defines the whole initial wave of the correction rather than a subwave within that initial movement.

So, the context. The low of September 20 marked the end of wave A of Submicro degree within a correction, wave 4 of Micro degree, within wave 5 of Subminuette degree, within wave 5 of Minuette degree, within wave 5 of Minute degree, within wave 3 of Minor degree, which began more than a year ago,on February 23, 2020, from the low 2000s.

But dropping back to the small scale, how do we know that wave A of Submicro degree is complete? The two most common corrective patterns are Zigzags and Flats. Zigzags cover more territory than Flats, and the two alternate; if a 2nd wave is a Zigzag, then the 4th wave will almost always be a Flat. The number of subwaves within each segment of the correction provides a clue as to the form that market is tracing out. A Zigzag has five waves in the first segment, three in the middle, and five in the final segment, a 5-3-5 pattern. A Flat has a 3-3-5 pattern.

On the chart, the decline from September 3 to September 20 has three subwaves internally, suggesting that we’re seeing a Flat pattern for wave 4. Also, the preceding wave 2 correction was a Zigzag, so a Flat an be expected for the 45th wave.

We can expect to see three waves to the upside for wave B of Submicro degree, and then a C wave back to around 4300. At that point, either the wave 4 of MIcro degree correction is over and wave 5 of Micro degree has begun, eventually carrying the price to new heights. Or, as often happens, there will be an X wave to the upside that will divide the first corrective pattern from a second one in a compound structure.

Learning and other resources. Elliott wave analysis provides context, not prophecy. As the 20th century semanticist Alfred Korzybski put it in his book Science and Sanity (1933), “The map is not the territory … The only usefulness of a map depends on similarity of structure between the empirical world and the map.” And I would add, we can judge that similarity of structure only after the fact.

See the menu page Analytical Methods for a rundown on where to go for information on Elliott wave analysis.

By Tim Bovee, Portland, Oregon, September 21, 2021

Disclaimer

Tim Bovee, Private Trader tracks the analysis and trades of a private trader for his own accounts. Nothing in this blog constitutes a recommendation to buy or sell stocks, options or any other financial instrument. The only purpose of this blog is to provide education and entertainment.

No trader is ever 100 percent successful in his or her trades. Trading in the stock and option markets is risky and uncertain. Each trader must make trading decisions for his or her own account, and take responsibility for the consequences.

License
Creative Commons License

All content on Tim Bovee, Private Trader by Timothy K. Bovee is licensed under a Creative Commons Attribution-ShareAlike 4.0 International License.

Based on a work at www.timbovee.com.

SP500 Analysis

3:30 p.m. New York time

Half an hour before the closing bell. The S&P 500 continued to fall during the day, reaching below 4300. The decline brings wave 4 of Micro degree into the region of a 50% Fibonacci retracement of the preceding 3rd wave. That’s good stopping point. However, internally the wave 4 of Micro degree is still in wave A of Submicro degree. If it’s a sideways Flat-pattern correction, then that would work. If it’s tracing out a Zigzag correction, then it has further to go to the downside.

Given the distance covered by the decline, it’s possible that what I’ve labelled as Bitsy degree is instead a larger degree, perhaps Minuscule, subscript {-7}.

I’ve updated the chart, adding in a Fibonacci retracement ladder for wave 4 of Micro degree, which began on September 3 at 4549.50. The preceding 3rd wave began on May 19 from 4055.5 and ended on September 3.

9:35 a.m. New York time

What’s happening now? The S&P 500 E-mini futures resumed trading early in the evening yesterday at 4411.75 and fell, reaching a low of 4340 shortly after the opening bell.

What does it mean? The sharp decline removes any ambiguity about whether the low-level correction that began on September 15 is complete. It ended later that same day, and the subsequent decline is a resumption of the main downward trend that began on September 3.

What’s the alternative? It remains possible that the decline from September 3 is a correction within the uptrend that began on May 19 from 4055.50. The lower the decline, the less likely this alternative becomes.

[S&P 500 E-mini futures at 3:30 p.m., 75-minute bars, with volume]

What does Elliott wave theory say? In Friday’s post I said that over the weekend I would re-visit my analysis that labelled the September 15 peak as the end of wave 2 of Bitsy degree. I decided at the time that the label was correct, despite the truncated nature of that 2nd wave. The overnight decline supports my decision.

The decline from September 15 is wave 3 of Bitsy degree within wave 1 of Subminuscule degree within wave 1 of Minuscule degree.

Then it gets complicated. Minuscule wave 1 is within a correction, wave A of Submicro degree within wave 4 of Micro degree, which will likely prove to be a sideways correction. That 4th wave is correcting the 3rd wave that came before it — both of Micro degree. That 3rd wave of Micro degree began on May 19 from 4055.50 and ended on September 3 at 4549.50.

The correction is already at the 38.2% Fibonacci level. The next one down is the 50% Fibonacci level, at 4302.50. Either level would be definable as a shallow correction, a characteristic that is common in 4th waves.

The end of Bitsy wave 3 will be followed by a small 4th wave correction to the upside, and then a decline to a new low in the movement. I think that makes the 50% Fibonacci level the more likely end point, but that’s an intuitive guess, not a prediction.

I’m confident enough that wave 4 of MIcro degree is underway that I’ve removed from the chart the price channel for wave 3 of Micro degree.

The end of wave 4 of Micro degree will be followed a rising wave 5, which will carry the price above the September 3 high, 4549.50 on the futures, 4545.85 on the index. The completion of that 5th wave will also mean the end of a series of increasingly larger 5th waves leading up four levels to wave 3 of Minor degree, the rise that began on February 23, 2020 in the low 2000s at the end of the early pandemic crash. The following 4th wave of Minor degree will carry the price down to 2000 or lower.

The alternate scenario, that wave 3 of Micro degree is sill underway, seems less and less likely, given the power of the overnight decline. However, each degree is a structure of its own, and a powerful move at Bitsy degree doesn’t necessarily have meaning for a great-great-great grandparent degree like Micro.

Learning and other resources. Elliott wave analysis provides context, not prophecy. As the 20th century semanticist Alfred Korzybski put it in his book Science and Sanity (1933), “The map is not the territory … The only usefulness of a map depends on similarity of structure between the empirical world and the map.” And I would add, we can judge that similarity of structure only after the fact.

See the menu page Analytical Methods for a rundown on where to go for information on Elliott wave analysis.

By Tim Bovee, Portland, Oregon, September 20, 2021

Disclaimer

Tim Bovee, Private Trader tracks the analysis and trades of a private trader for his own accounts. Nothing in this blog constitutes a recommendation to buy or sell stocks, options or any other financial instrument. The only purpose of this blog is to provide education and entertainment.

No trader is ever 100 percent successful in his or her trades. Trading in the stock and option markets is risky and uncertain. Each trader must make trading decisions for his or her own account, and take responsibility for the consequences.

License
Creative Commons License

All content on Tim Bovee, Private Trader by Timothy K. Bovee is licensed under a Creative Commons Attribution-ShareAlike 4.0 International License.

Based on a work at www.timbovee.com.

SP500 Analysis

3:30 p.m. New York time

Half an hour before the closing bell. The S&P 500 E-mini futures fell below the September 15 low of 4425.25, so far reaching 4416.25. The decline altered the meaning of the September 15 high of 4478.50 — it’s the end of a rather smallish wave 2 of Bitsy degree and the beginning of the wave 3 decline to new lows. I’ll be looking at that portion of the chart over the weekend and on Monday to try to understand whether there’s a more likely count; the truncation of what I’ve called wave 2 is somewhat inelegant. I’ve updated the near-term chart below.

1:40 p.m. New York time

My trades. This week marked the end of my trading in options expiring October 15. I had positions in BABA and FXI, and exited both for a profit.

Here’s what lies ahead. The next option I’ll trade will expire on November 19, 2021, with expiration day — the day I exit positions no matter how small the profit — coming on October 29. The entry period under my rules stretches from September 28 through October 12, with the optimal entry date being October 5.

And so, I have an 11-day vacation from options, and then I’ll start looking for prospects.

9:50 a.m. New York time

What’s happening now? The S&P 500 E-mini futures continue their upward correction within a downtrend that began on September 3.

What does it mean? The correction will remain below the September 3 high of 4549.50 on the futures, 4545.85 on the index. When complete, the downtrend will continue.

What’s the alternative? If the rise exceeds the September 3 high, then the uptrend that began May 19, and indeed much earlier, is still underway, and the decline since September 3 is a downward correction within that long-running uptrend.

The Chart. On the top, a near-term chart of the futures since mid-August. On the bottom, a long-term chart of the index since late 2018.

[S&P 500 E-mini futures at 5 p.m., 70-minute bars, with volume]
[S&P 500 index at 9:56 a.m., two-day bars]

What does Elliott wave theory say? In the near-term, there is no change to my analysis posted yesterday, to which I refer you. The futures price has remained above 4425.25 — the low of September 14 — and below the high set on Wednesday, 4478.15.

For the longer term, the S&P 500 index has been tracing an expanding diagonal triangle that began on December 26, 2018. The triangle is a 5th wave of Intermediate degree. Such structures have five internal waves, and at present wave 3 of Minor degree has been under way since February 23, 2020, the low point of the early-pandemic crash. When wave 3 is complete, the price will spend a few years dropping down to the lower boundary of the triangle, which now stands a bit above 2,000 but which will continue to decline, as the upper and lower boundaries continue to move further apart of one another. Minor 3 internally is within wave 3 of Minute degree.

Learning and other resources. Elliott wave analysis provides context, not prophecy. As the 20th century semanticist Alfred Korzybski put it in his book Science and Sanity (1933), “The map is not the territory … The only usefulness of a map depends on similarity of structure between the empirical world and the map.” And I would add, we can judge that similarity of structure only after the fact.

See the menu page Analytical Methods for a rundown on where to go for information on Elliott wave analysis.

By Tim Bovee, Portland, Oregon, September 17, 2021

Disclaimer

Tim Bovee, Private Trader tracks the analysis and trades of a private trader for his own accounts. Nothing in this blog constitutes a recommendation to buy or sell stocks, options or any other financial instrument. The only purpose of this blog is to provide education and entertainment.

No trader is ever 100 percent successful in his or her trades. Trading in the stock and option markets is risky and uncertain. Each trader must make trading decisions for his or her own account, and take responsibility for the consequences.

License
Creative Commons License

All content on Tim Bovee, Private Trader by Timothy K. Bovee is licensed under a Creative Commons Attribution-ShareAlike 4.0 International License.

Based on a work at www.timbovee.com.

SP500 Analysis

3:30 p.m. New York time

Half an hour before the closing bell. The S&P 500 E-mini futures ended their decline at 4433.25, eight points above the September 14 low, and then resumed their rise in an upward correction, wave A of Subbitsy degree within wave 4 of Bitsy degree, that began on September 14. No change in the analysis. I’ve updated the chart.

9:35 a.m. New York time

What’s happening now? The S&P 500 E-mini futures rose in overnight trading, reaching 4478.15, and then reversed, staying well above Tuesday’s low.

What does it mean? By my count Tuesday’s low, 4425.25, marks the end of the first leg of the decline that began September 3, from 4549.50. The subsequent rise is the beginning of an upward correction that will remain below the September 3 peak, although it may well approach it quite closely.

What’s the alternative? There are two. 1) The first leg of the decline from September 3 is still underway. This analysis is correct if the price falls below 4425.25 on the futures, 4435.46 on the index.

2) The entire decline is a correction within a still ongoing rise that began May 19. This analysis is correct if the price rises above 4549.50 on the futures, 4545.85 on the index.

[S&P 500 E-mini futures at 3:30 p.m., hourly bars, with volume]

What does Elliott wave theory say? By my principal count, wave 1 of Bitsy degree (subscript {-9}) ended with Tuesday’s low, having completed a five-wave decline, and the subsequent rise is wave 2 of Bitsy degree. Within Bitsy 2, wave A of Subbitsy degree is now underway. Second waves often retrace much of the preceding 1st wave, bringing renewed optimism to traders. However, they remain below the start of the preceding 1st wave, and in the end all hopes are dashed when the correction ends and wave 3 resumes the decline (in this case), brining the price to new lows. This is all happening within wave 4 of Micro degree, which began May 19 and ended at the September 3 peak.

Under the first alternate analysis, Tuesday’s low is not yet the end of wave 1 of Bitsy degree, and it still has a bit more distance downward to go. After that, the 2nd wave begins, as described in the principal anaysis.

Under the second alternate anaysis, wave 3 of Micro degree didn’t end on September 3 and is still underway. The decline that began on that date is a smaller correction within a still rising wave 3 Micro degree.

Learning and other resources. Elliott wave analysis provides context, not prophecy. As the 20th century semanticist Alfred Korzybski put it in his book Science and Sanity (1933), “The map is not the territory … The only usefulness of a map depends on similarity of structure between the empirical world and the map.” And I would add, we can judge that similarity of structure only after the fact.

See the menu page Analytical Methods for a rundown on where to go for information on Elliott wave analysis.

By Tim Bovee, Portland, Oregon, September 16, 2021

Disclaimer

Tim Bovee, Private Trader tracks the analysis and trades of a private trader for his own accounts. Nothing in this blog constitutes a recommendation to buy or sell stocks, options or any other financial instrument. The only purpose of this blog is to provide education and entertainment.

No trader is ever 100 percent successful in his or her trades. Trading in the stock and option markets is risky and uncertain. Each trader must make trading decisions for his or her own account, and take responsibility for the consequences.

License
Creative Commons License

All content on Tim Bovee, Private Trader by Timothy K. Bovee is licensed under a Creative Commons Attribution-ShareAlike 4.0 International License.

Based on a work at www.timbovee.com.

SP500 Analysis

3:30 p.m. New York time

Half an hour before the closing bell. The S&P 500 rose nearly 50 points during the day, from yesterday’s low of 4425.25. No change in the analysis. I’ve updated the chart.

10 a.m. New York time

My trades. I’ve exited by short bear call spread options position on FXI and have updated the entry analysis with results.

9:35 a.m. New York time

What’s happening now? The S&P 500 E-mini futures traded in a narrow range overnight in a low level sideways correction.

What does it mean? The downtrend that began on September 3 continues.

What’s the alternative? The September 3 high marked a turning point within the rise that began May 19, which is still underway.

On the chart. I’ve marked the low-degree waves within the decline that began September 3 as being of Subbitsy degree (with a {-10} subscript). I’ve based that decision on the number of days it takes each wave to reach completion. However, since the decline so far lacks the context of parent waves of larger degree, I’ve have little confidence that Subbitsy is correct. I’ll change my degree label if events should prove it to be too small a degree (I doubt that it will prove too large).

[S&P 500 E-Mini futures at 3:30 p.m., hourly bars, with volume]

What does Elliott wave theory say? The decline is wave 5 of Subbitsy degree within wave 1 of Bitsy degree within a series of 1st waves of progressively higher degree, up two steps to Minuscule degree. Encompassing them all is wave A of Submicro degree, the first wave within its parent, wave 4 of Micro degree, a downward correction.

Wave 4 of Micro degree will be followed by a 5th wave to the upside that will approach the upper boundary of the price channel, which is based on the Micro degree’s parent, wave 5 of Subminuette degree.

Learning and other resources. Elliott wave analysis provides context, not prophecy. As the 20th century semanticist Alfred Korzybski put it in his book Science and Sanity (1933), “The map is not the territory … The only usefulness of a map depends on similarity of structure between the empirical world and the map.” And I would add, we can judge that similarity of structure only after the fact.

See the menu page Analytical Methods for a rundown on where to go for information on Elliott wave analysis.

By Tim Bovee, Portland, Oregon, September 15, 2021

Disclaimer

Tim Bovee, Private Trader tracks the analysis and trades of a private trader for his own accounts. Nothing in this blog constitutes a recommendation to buy or sell stocks, options or any other financial instrument. The only purpose of this blog is to provide education and entertainment.

No trader is ever 100 percent successful in his or her trades. Trading in the stock and option markets is risky and uncertain. Each trader must make trading decisions for his or her own account, and take responsibility for the consequences.

License
Creative Commons License

All content on Tim Bovee, Private Trader by Timothy K. Bovee is licensed under a Creative Commons Attribution-ShareAlike 4.0 International License.

Based on a work at www.timbovee.com.

SP500 Analysis

3:30 p.m. New York time

Half an hour before the closing bell. The S&P 500 E-mini futures rose slightly during the day and then resumed its downward course, reaching new lows. No change in the analysis. I’ve updated the chart.

11:35 a.m. New York time

My positions. I have exited my bear call options spread position on BABA and updated the entry analysis with results.

9:35 a.m. New York time

What’s happening now? The S&P 500 E-mini futures in overnight trading stayed above the low of 4434.50 set late in yesterday’s session.

What does it mean? The early steps in a downward correction of the rise that began May 19 from 4059.50 on the index continues. The preceding uptrend peaked on September 3.

What’s the alternative? A correction within the rise that began on May 19 is still underway. The September 3 peak was a turning point within that larger rise.

[S&P 500 E-mini futures at 3:30 p.m., hourly bars, with volume]

What does Elliott wave theory say? Under my principal analysis, wave 3 of Micro degree, which began on May 19, peaked on September 3, and wave 4 of Micro degree is now underway.

Under my alternate analysis, wave 3 of Micro degree is still underway, with the decline since September 3 being a correction within that wave. Wave 4 still lies in the future.

A price rise above the September 3 peak, 4549.50 on the futures and 4545.85 on the index, would mean that the alternate count is correct: wave 3 of Micro degree is not yet complete. Such an event would invalidate my present principal analysis and would promote the alternate count to principal count.

Learning and other resources. Elliott wave analysis provides context, not prophecy. As the 20th century semanticist Alfred Korzybski put it in his book Science and Sanity (1933), “The map is not the territory … The only usefulness of a map depends on similarity of structure between the empirical world and the map.” And I would add, we can judge that similarity of structure only after the fact.

See the menu page Analytical Methods for a rundown on where to go for information on Elliott wave analysis.

By Tim Bovee, Portland, Oregon, September 14, 2021

Disclaimer

Tim Bovee, Private Trader tracks the analysis and trades of a private trader for his own accounts. Nothing in this blog constitutes a recommendation to buy or sell stocks, options or any other financial instrument. The only purpose of this blog is to provide education and entertainment.

No trader is ever 100 percent successful in his or her trades. Trading in the stock and option markets is risky and uncertain. Each trader must make trading decisions for his or her own account, and take responsibility for the consequences.

License
Creative Commons License

All content on Tim Bovee, Private Trader by Timothy K. Bovee is licensed under a Creative Commons Attribution-ShareAlike 4.0 International License.

Based on a work at www.timbovee.com.