3:30 p.m. New York time
Half an hour before the closing bell. The S&P 500 continued its rise today, reaching 4178.25 on the E-mini futures and 4183.13 on the index. No change in the analysis. Chart updated.
9:50 a.m. New York time
What’s happening now? The S&P 500 E-mini futures rose overnight from yesterday’s low of 4029.25.
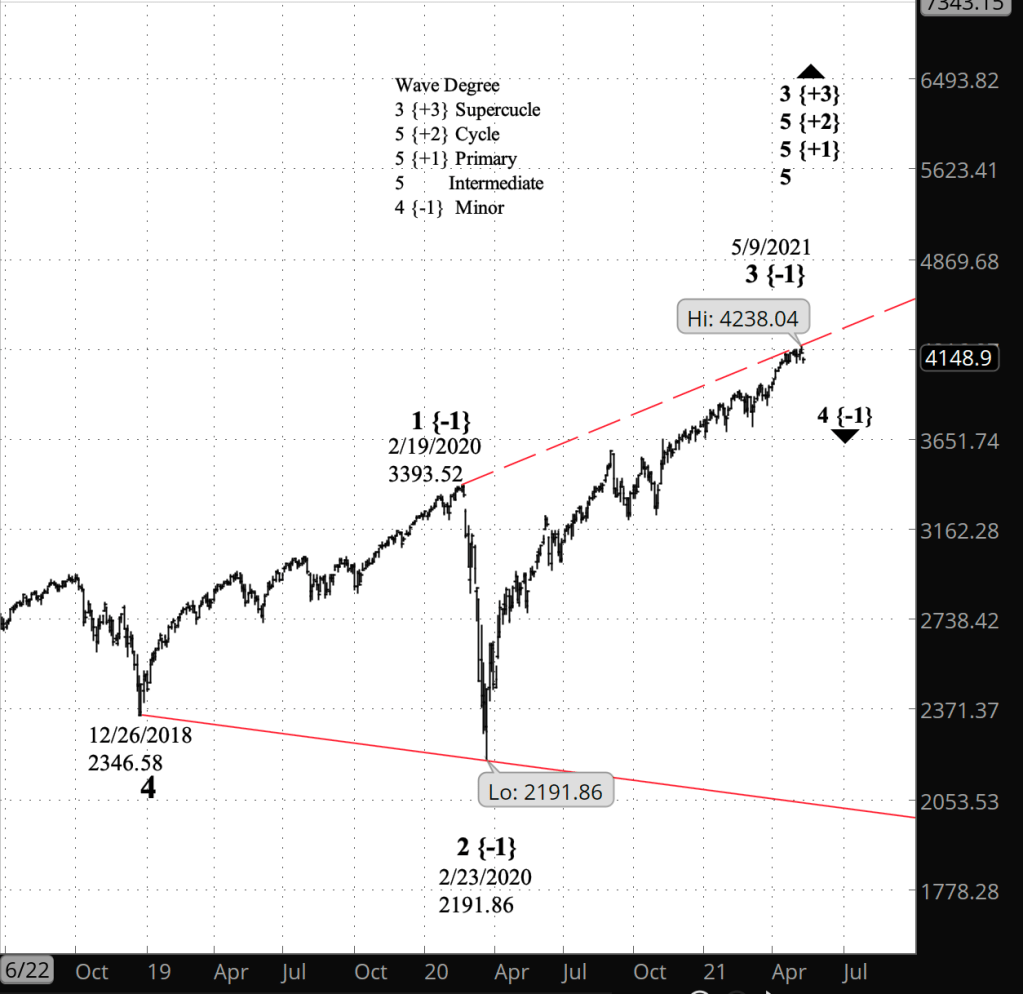
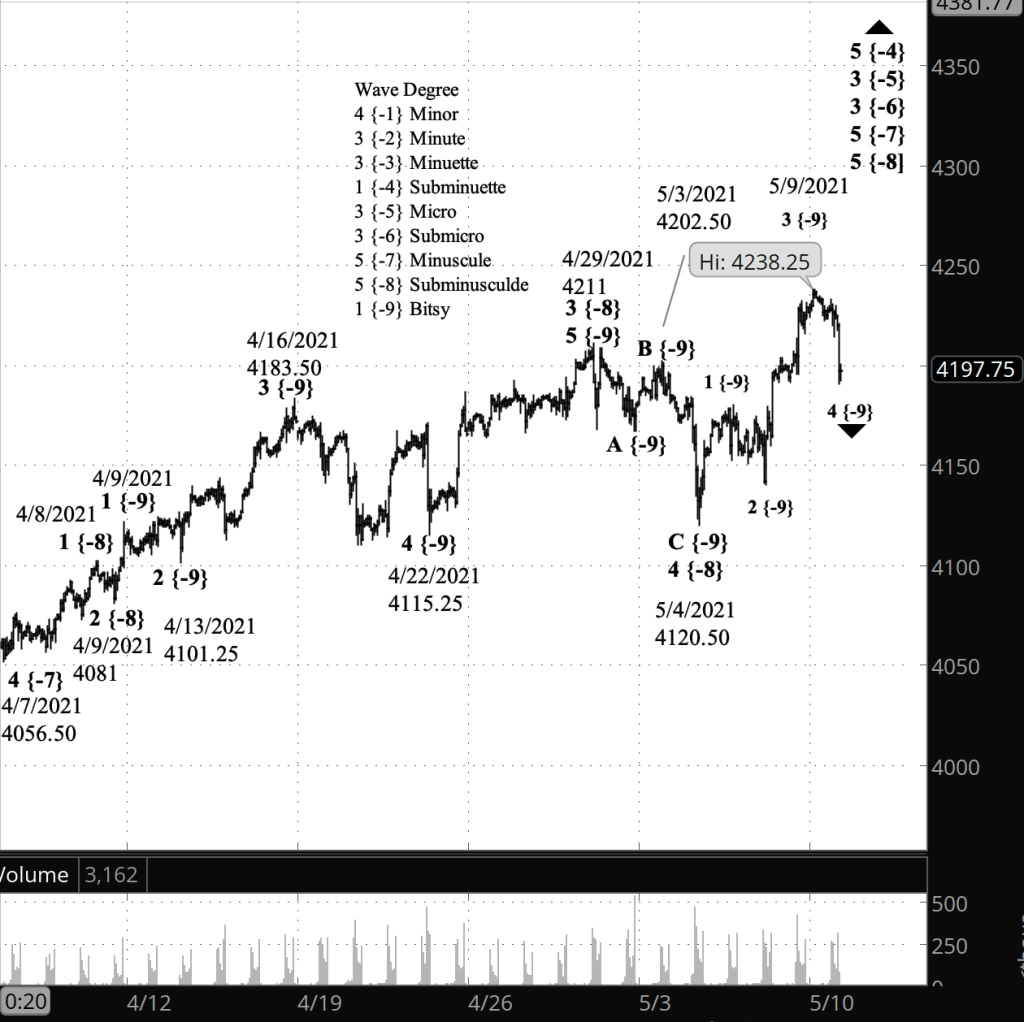
What does it mean? My principle analysis sees the bounce as an upward correction within a downtrend, both of small degree. The rise might well retrace most of the decline from the May 9 high of 4238.25. These small moves are happening within a far larger downtrend.
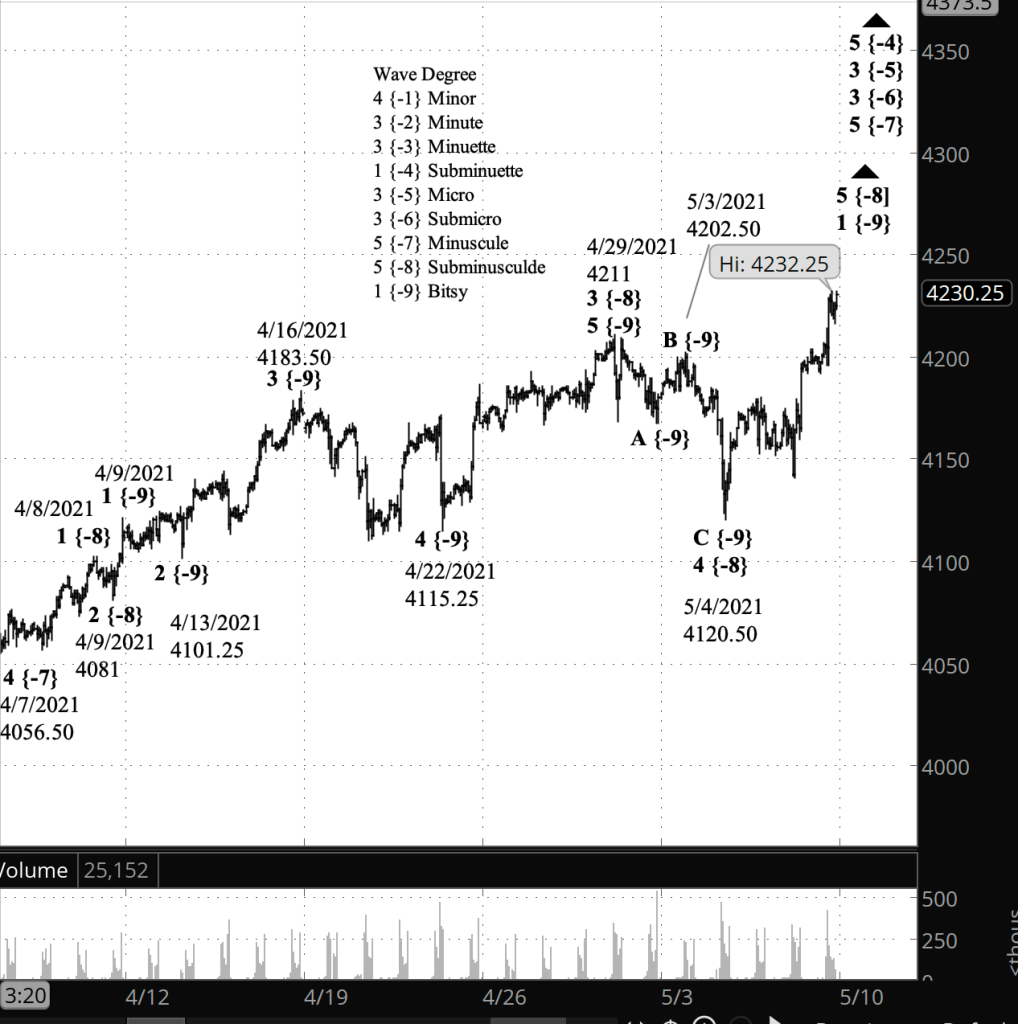
What’s the alternative? If the price moves above the May 9 high, then the alternative analysis comes into play, seeing the decline from May 9 as a small correction within a larger uptrend.
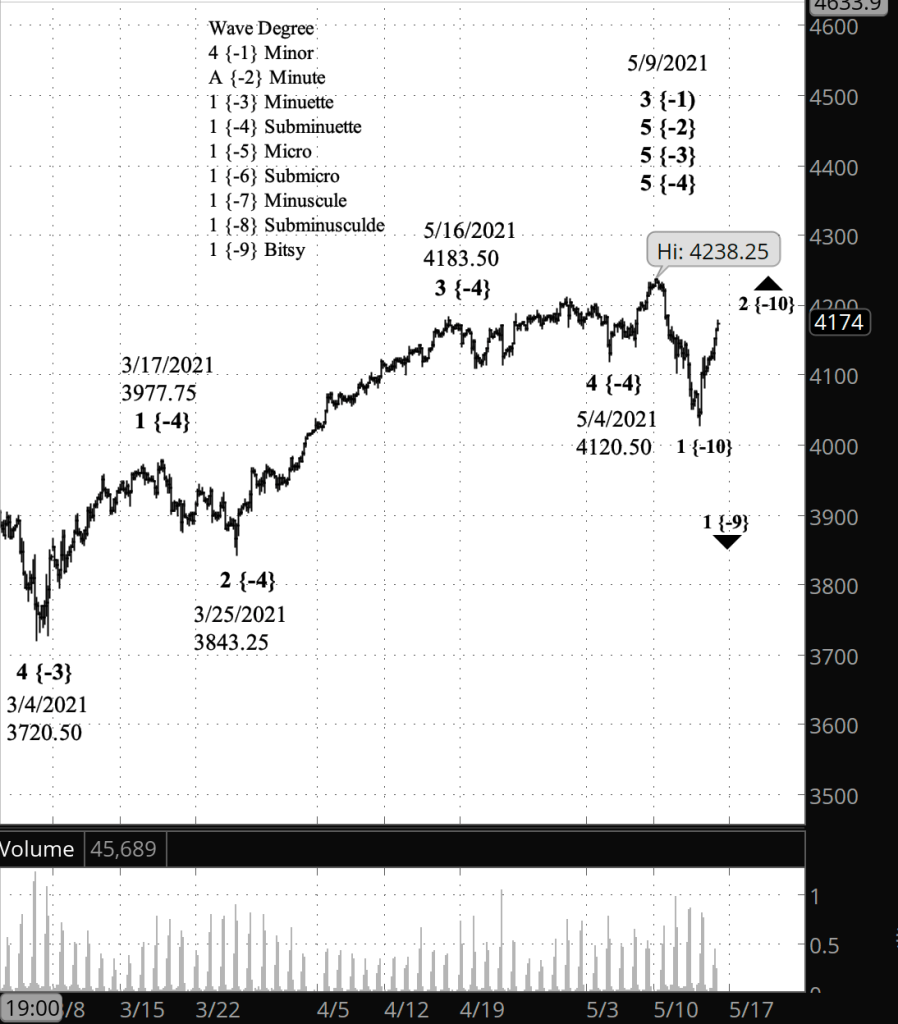
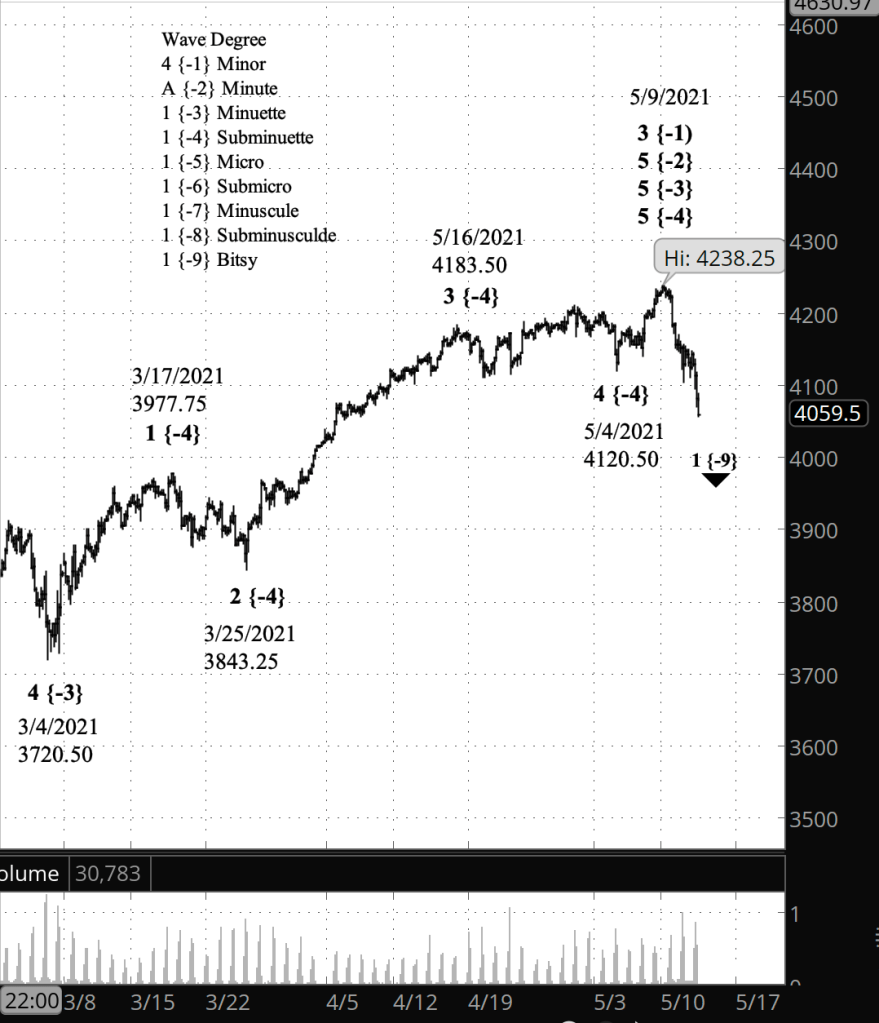
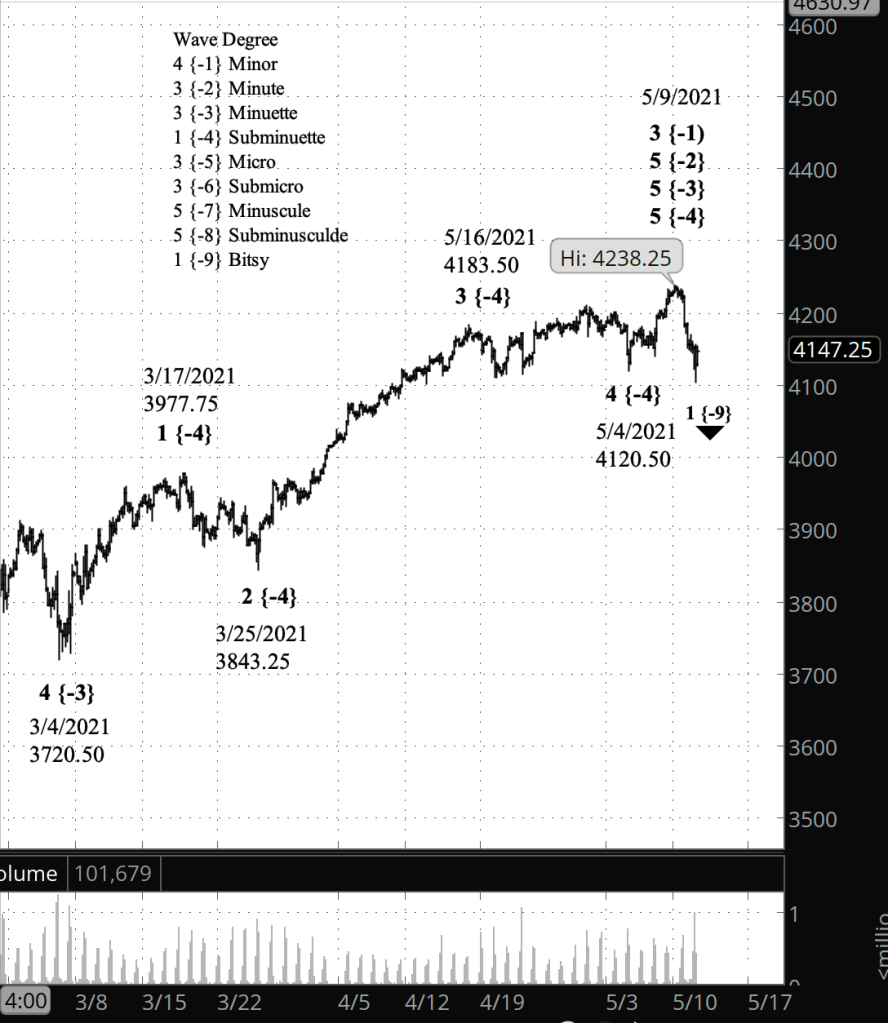
What does Elliott wave theory say? By my principle count, the decline from the May 9 high is wave 1 of Bitsy degree, the first small step of a very large downtrend. Within Bitsy 1, yesterday’s low marked the end of wave 1 of Subbitsy degree and the beginning of Subbitsy 2. Second waves often retrace much of the preceding first wave. The upward correction will be followed by further decline, in an energetic wave 3 of Subbitsy degree.
By my alternative count, the decline from May 9 is a very low level A wave correction, which will be followed waves B and C, and perhaps be extended in a compound structure before resuming the rise and exceeding the May 9 high.
Read More »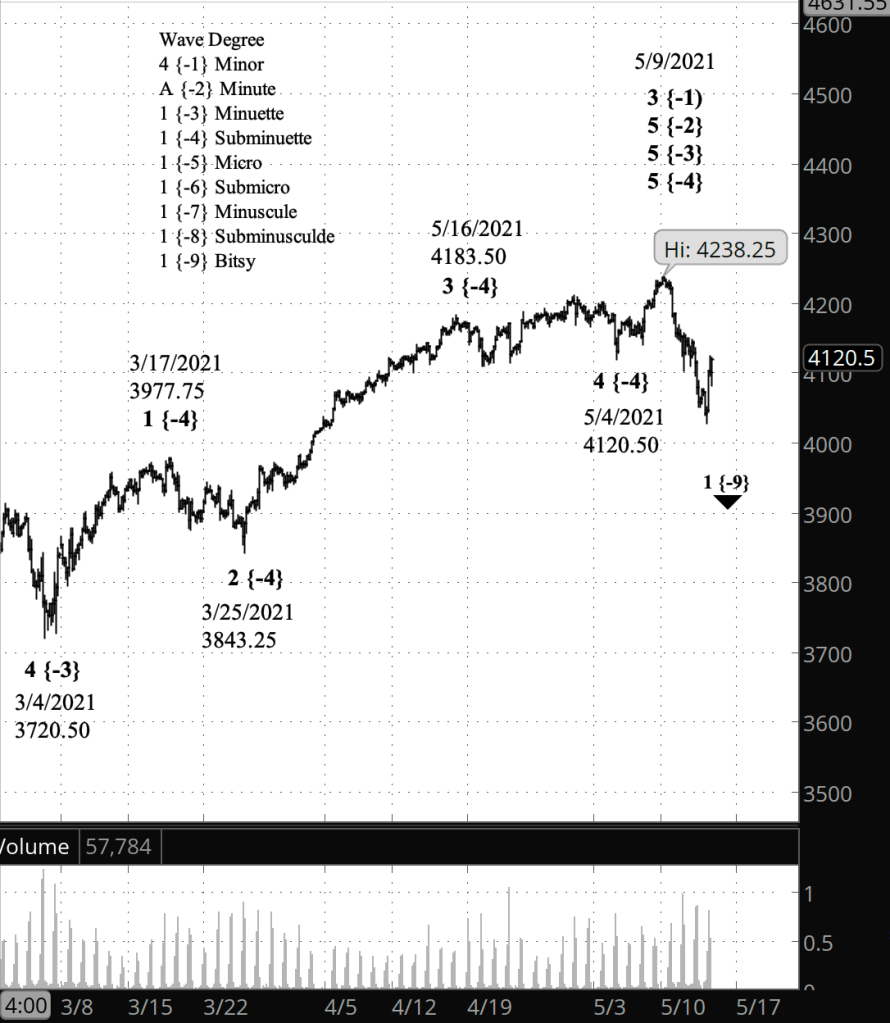
 Tim Bovee, Private Trader
You must be logged in to post a comment.