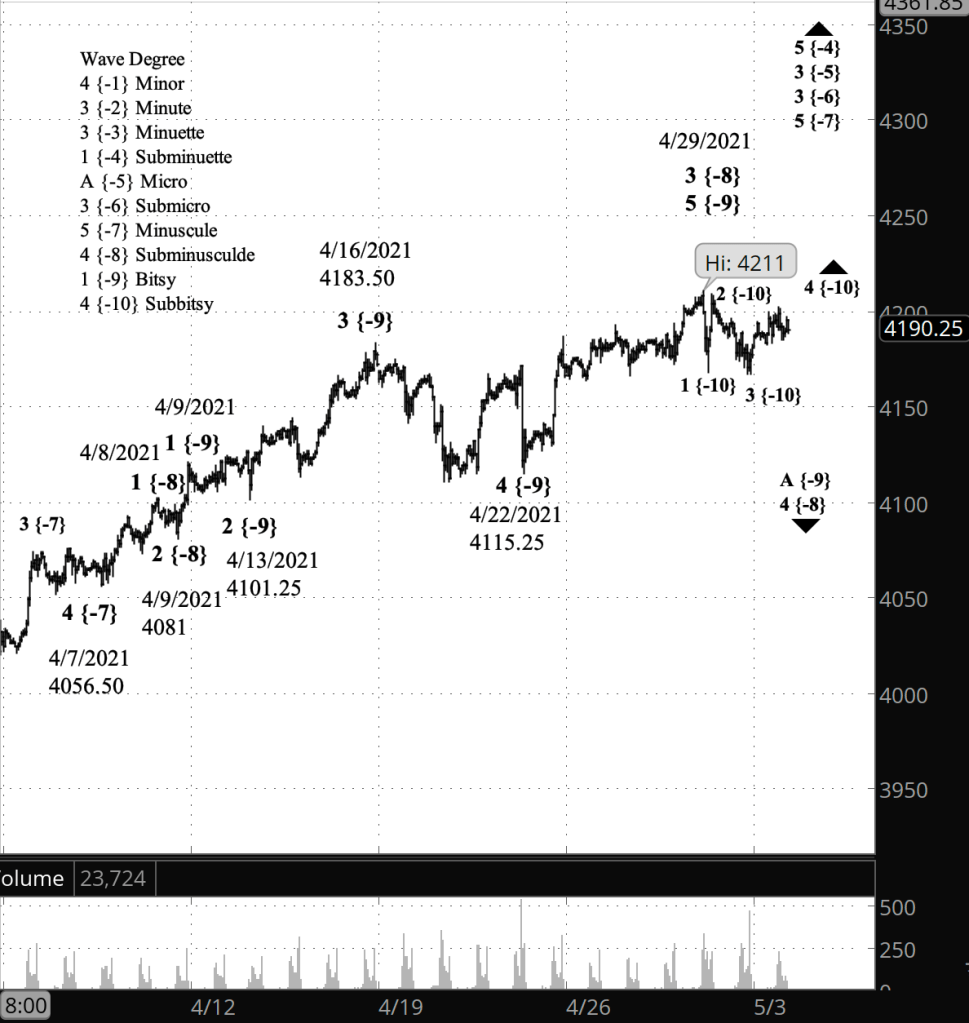
Half an hour before the closing bell. The S&P 500 traded in a narrow range today, dawdling along at same pace as in the overnight session. No change in the analysis. I’ve updated the chart.
9:50 a.m. New York time
What’s happening now? The S&P 500 E-mini futures continued a slow rise through the 4190s after trading resumed overnight in a counter-trend movement within a downward correction.
What does it mean? The correction will be followed by a reversal to the downside that will reach below 4115.25, perhaps significantly below.
What’s the alternative? By my analysis the peak of 4211, reached on April 29, ended the rise that began April 22. It is possible that the decline since late April has been a pullback within the continuing rise and that the price will move to new highs.
[S&P 500 E-mini futures at 3:30 p.m., hourly bars, with volume]
What does Elliott wave theory say? The peak of April 29 ended wave 5 of Bitsy degree and its parent degree, wave 3 of Subminuscule degree. The decline that followed is the early sub-waves of wave A of Bitsy degree within wave 4 of Subminuscule degree.
The low degree Zigzag that I’ve labeled as waves 1 through 4 of Bitsy degree may in fact be of a smaller degree. In Elliott, there’s much ambiguity about the magnitude of a movement until it has had time to mature.
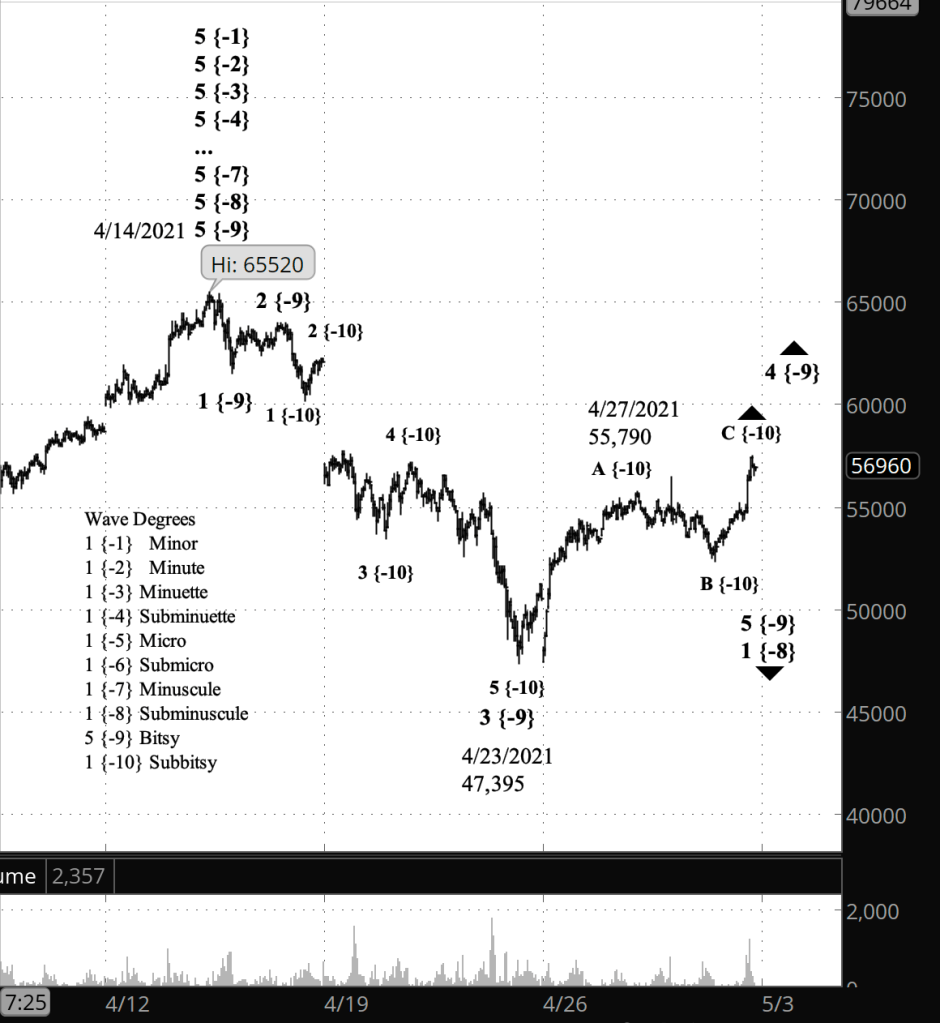
What’s happening now? Bitcoin futures continue their correction and now are on the third and possibly last leg of an upward movement within a larger downtrend.
What does it mean? The correction upon completion will be followed by a resumption of the downtrend.
What’s the alternative? If the correction extends into a compound structure, then the present final leg will be followed by a shallow downward movement, and the another corrective structure.
[Bitcoin futures at 2:15 p.m., 55-minute bars, with volume]
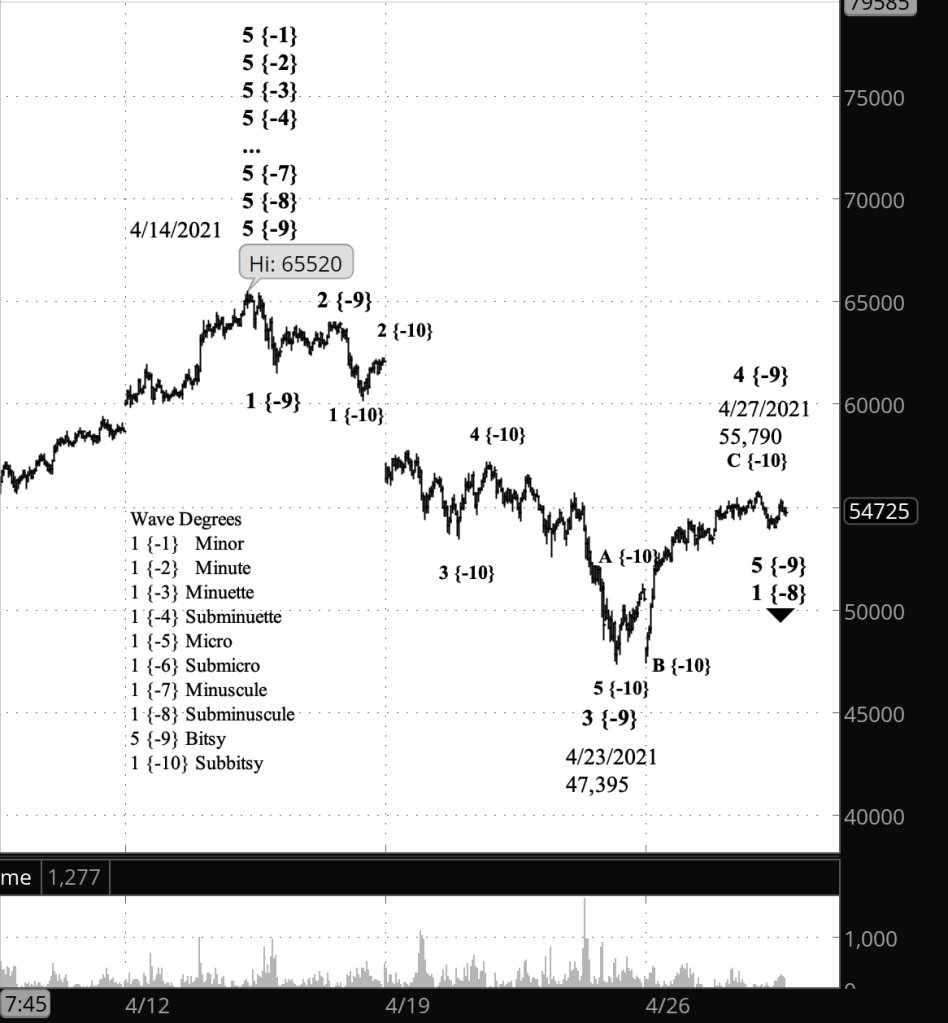
What does Elliott wave theory say? Bitcoin peaked on April 14 at 65,520, and a significant downtrend has begun. So far, the downtrend has completed waves 1 through 3 of Bitsy degree within wave 1 of Subminuscule degree and is dow in a 4th wave correction of Bitsy degree. Within the 4th wave, waves A and B of Subbitsy degree are complete and wave C is underway.
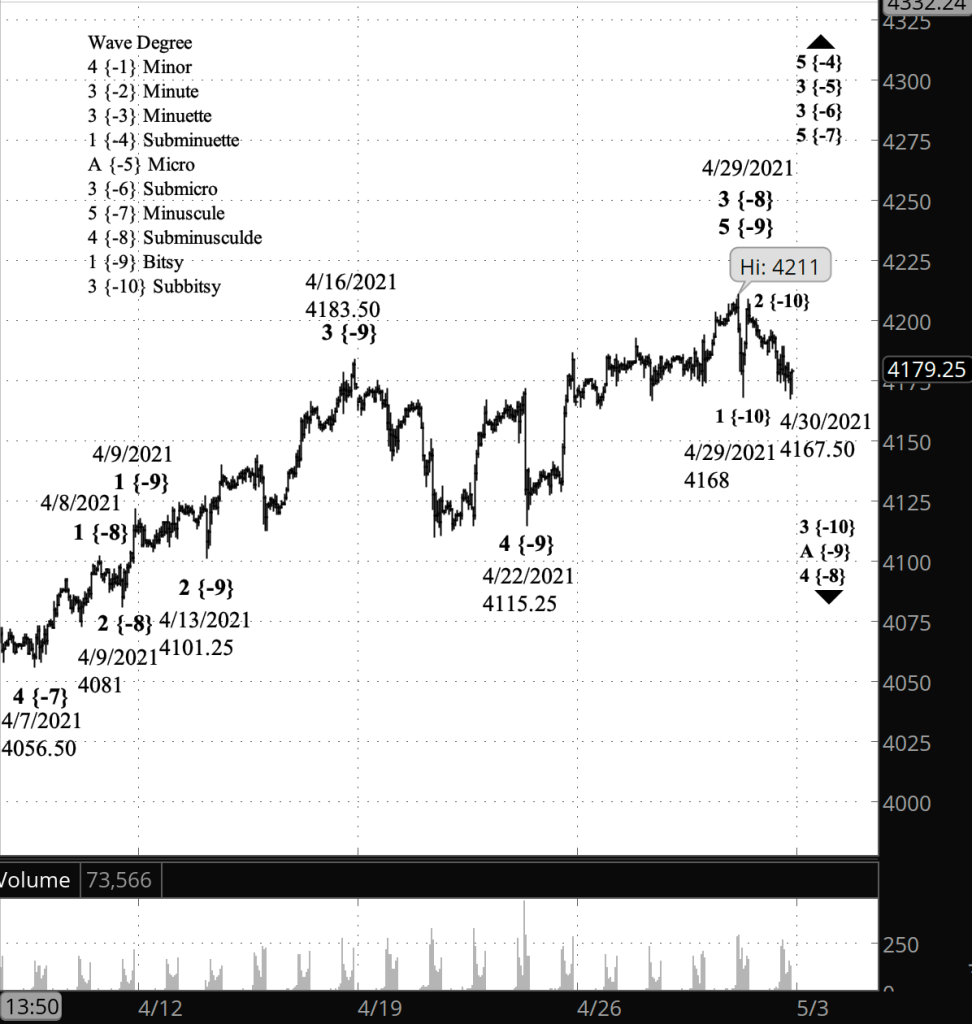
Half an hour before the closing bell. The S&P 500 continued downward, falling below Thursday’s low of 4168, to 4167.50 so far today. No change in the analysis. Chart updated.
9:40 a.m. New York time
What’s happening now? The S&P 500 e-mini futures resumed their downward movement after a rise that remained below the April 29 peak of 4211.
What does it mean? The failure to reach a new high suggests that 4211 marks the end of the rise that began on April 22 from 4115.25 and the beginning of a downward correction of the rise that began on April 9 from 4081.
What’s the alternative? The decline has yet to move below yesterday’s low of 4168, so it’s possible that the decline is a step within the rise that began on April 22. A move below 4168 will reduce the likelihood of this alternative analysis.
[S&P 500 E-mini futures at 3:30 p.m., 55-minute bars, with volume]
What does Elliott wave theory say? I’ve marked the chart according to the primary analysis, treating the high of April 29 as the end of wave 5 of Bitsy degree and also of the parent wave 3 of Subminuscule degree. The subsequent Subminuscule 4 correction is underway. Within Subminuscule 4, the decline in overnight trading was wave 1 of Subbitsy degree within wave A of Bitsy degree. If the Subminuscule 4 correction is taking the form of a Flat, then Bitsy wave A will have three waves internally at the Subbitsy level. If it is a Zigzag pattern, then Bitsy A will have five internal waves.
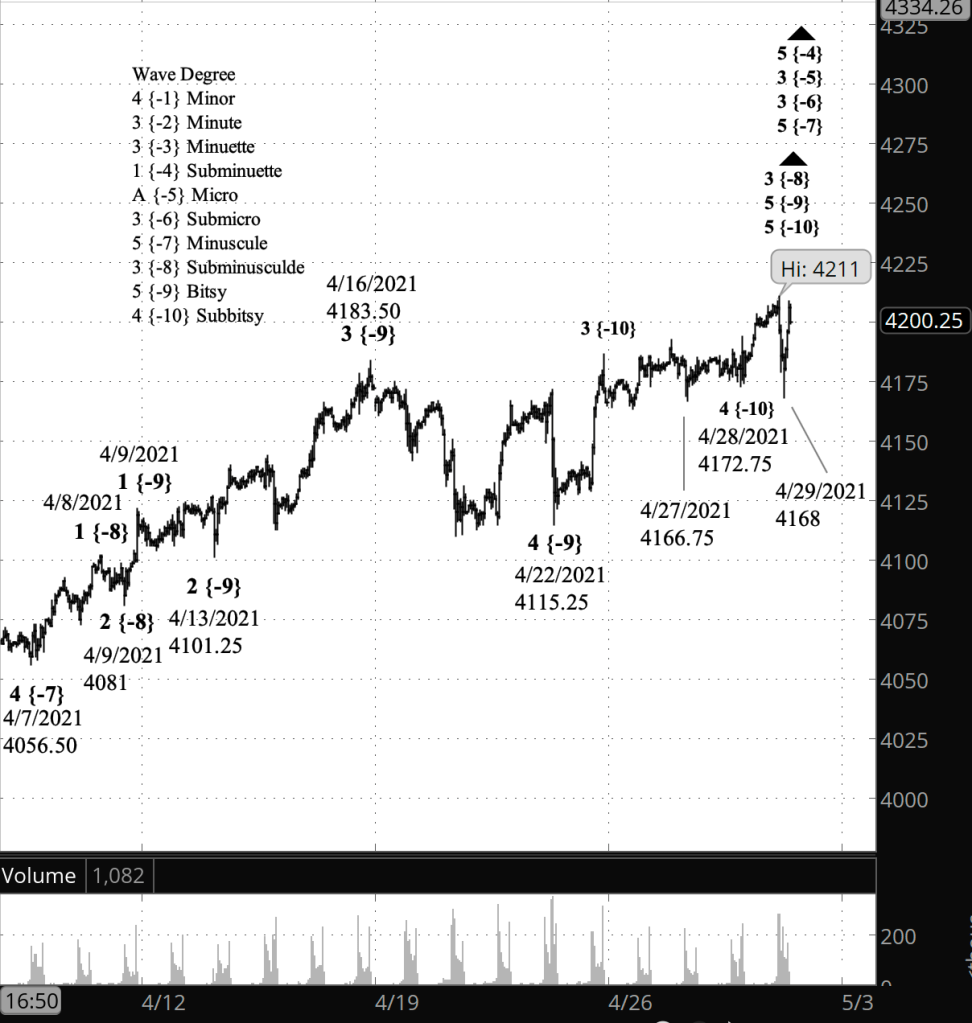
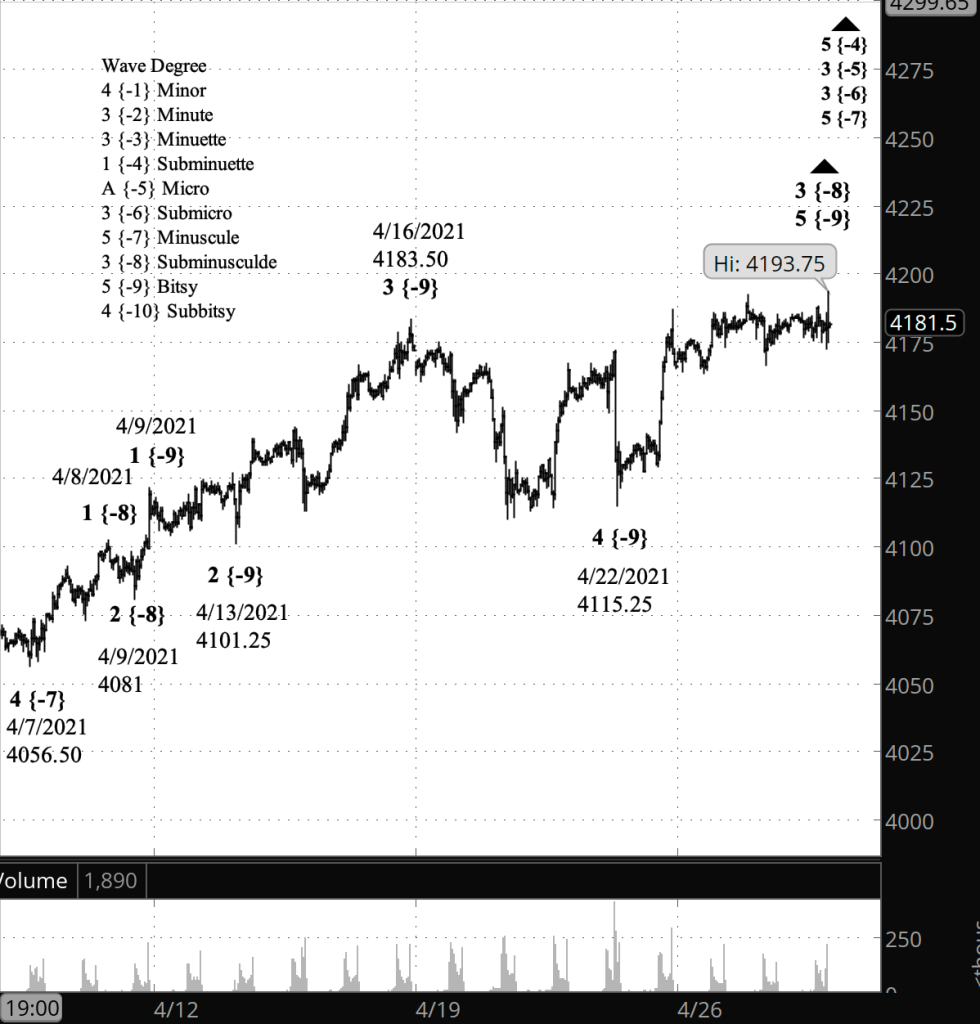
Half an hour before the closing bell. The S&P 500 E-mini futures, having risen to a new high in wave 5 of Subbitsy degree, dropped to below the take-off point of that 5th wave, opening the possibility that wave 5 is developing into a triangle structure. Here are the numbers that lie behind that suggestion:
–April 27, low point of a sideways Subbitsy wave 4, at 4166.75.
–April 28, end of Subbitsy 4 and beginning of Subbitsy 5, at 4172.75
–April 29, high so far of Subbitsy 5, at 4211
–April 29, the price drops to 4168, below the beginning of the 1st wave within Subbitsy wave 5.
That final drop, below the end Subbitsy 4 and the beginning of Subbitsy 5, is consistent with the beginning of a triangle. On the other hand, the final drop is above the low point of Subbitsy 4, so there’s ambiguity.
Alternatively, 4211 could be the end of Subbitsy 5, and the drop from the level could be the early stages of wave 1 within a wave 4 of Subminuscule degree.
We’ll see which analysis wins out as wave 5 develops. I’ve updated the chart, with the numbering based on an analysis that Subbitsy wave 5 is still underway.
10 a.m. New York time
Notethe new naming convention for the S&P 500 analyses that are the backbone of Private Trader. “SP500 Analysis” for the S&P 500 and its derivatives. Other analyses will also have the name or symbol of the product being analyzed, e.g., “Bitcoin Analysis” or “TSLA Analysis”. Analyses for a trade will be replace “Analysis” with “Trade”, as in “NIO Trade”.
What’s happening now? The S&P 500 E-mini futures rose sharply in overnight trading, to 4211 (4218.78 on the index). It is the final leg of the rise that began April 22 from 4115.25.
What does it mean? The late April rise is nearing completion and will be followed by shallow correction and then a further rise.
[S&P 500 E-mini futures at 3:30 p.m., 50-minute bars, with volume]
What does Elliott wave theory say? The overnight rise is wave 5 of Subbitsy degree within wave 5 of Bitsy degree within wave 3 of Subminuscule degree. There is no limit to how high a 5th wave can go, beyond the tendency to be proportional to the degree of which it is a part. Subminuscule wave 3 began on April 9 from 4081 and in 20 days has covered 130 points. A 4th wave correction of Subminuscule degree, if it takes the form of a Flat, which is usually, tends to have an end point within the 4th wave of Bitsy degree — one degree smaller — within the preceding Subminuscule 3rd wave. The would give us a correction target between 4115.25 and 4183.50. The further rise after Subminuscule wave 4 will be wave 5 of Subminuscule degree, which could carry the price a good distance higher.
What’s happening now? Bitcoin continues to trade below yesterday’s peak of 55,790 in what appears to be a correction within the the rise that began April 23.
What does it mean? The upward correction, if it is in fact complete, will be followed by a resumption of the downtrend that began on April 14 from 65,520.
What’s the alternative? Yesterday’s peak may in fact not be the end of the rise from April 23, although the rise has met the basic requirements of Elliott wave analysis.
[Bitcoin futures at 10:35 a.m., 45-minute bars, with volume]
What does Elliott wave theory say? The April 14 peak appears to be the start of a major trend reversal, with the new downtrend in its early stages: Wave 1 of Subminuscule degree. Within that degree, the price has just completed or is about to complete wave C of Subbitsy degree within wave 4 of Bitsy degree. The upward 4th wave correction is being (or will be) followed by a Bitsy 5th wave movement downward.
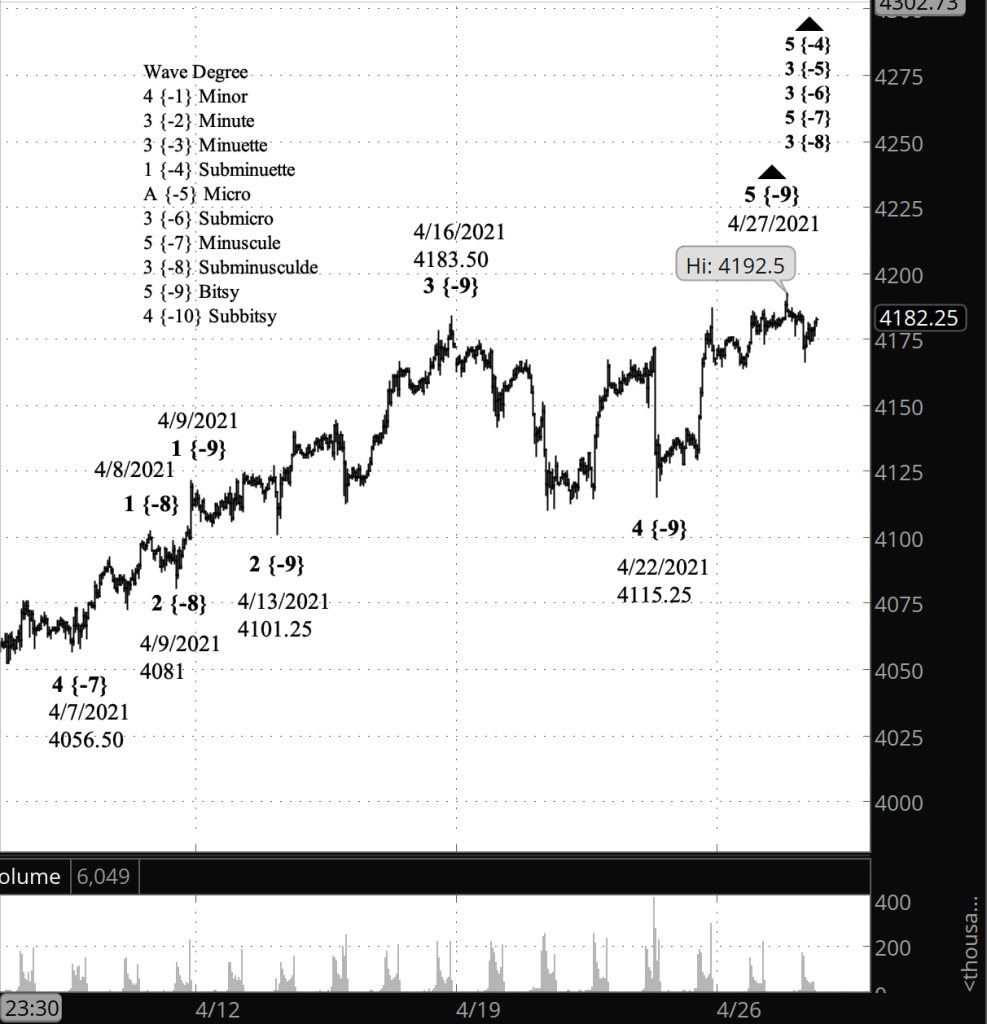
45 minutes before the closing bell. The S&P 500 rose to a new high, 4192.50 on the futures and 4201.53 on the index, meaning that the uptrend that began on April 22 is still underway. In terms of Elliott wave analysis, the rise is wave 5 of Bitsy degree within wave 3 of Subminuscule degee. I’ve updated the chart.
9:45 a.m. New York time
What’s happening now? The S&P 500 remained below yesterday’s peak, 4192.50, in overnight trading.
What does it mean? Two possibilities: Either 4192.50 completes the rise that began April 22 from 4115.25…
What’s the alternative? … or the meandering since yesterday is a correction, with fresh highs yet to come within a few days. It’s impossible to choose between the two. I’ve marked the chart to show the rise is complete, but I have little confidence in that choice.
[S&P 500 E-mini futures at 3:15 p.m., 45-minute bars, with volume]
What does Elliott wave theory say? The rise since April 22 is wave 5 of Bitsy degree. It’s completion will also mark the end of wave 3 of Subminuscule degree, which will be followed by a sideways correction. Subminuscule 3 began on April 8.
Half an hour before the closing bell. The S&P 500 dropped slightly from overnight high and then rose a little, in what is either a continuation of wave 5 of Bitsy degree to the upside or the early steps in a wave 4 correction of Subminuscule degree, one step larger than Bitsy. I’ve updated the chart.
9:40 a.m. New York time
What’s happening now? The S&P 500 E-mini futures reached a new high in overnight trading, 4192.50. I count that rise as part of the final leg of the uptrend that began April 22.
What does it mean? Completion of that uptrend will be followed by a shallow correction at a larger degree, the uptrend that began April 9.
What’s the alternative? It’s possible that the present high marks the end of the April 22 uptrend.
[S&P 500 E-mini futures at 3:30 p.m., 45-minute bars, with volume]
What does Elliott wave theory say? By my count, the price is in the 5th wave of Subbitsy degree within wave 5 of Bitsy degree within wave 3 of Subminuscule degree.
My trades. Today begins the entry period for positions using options that expire on June 21. The period extends to May 11, with May 4 being the midpoint. I’ll be aiming for a May 4 entry, assuming I can find a prospect with sufficiently high implied volatility that allows me to avoid an earnings announcement.
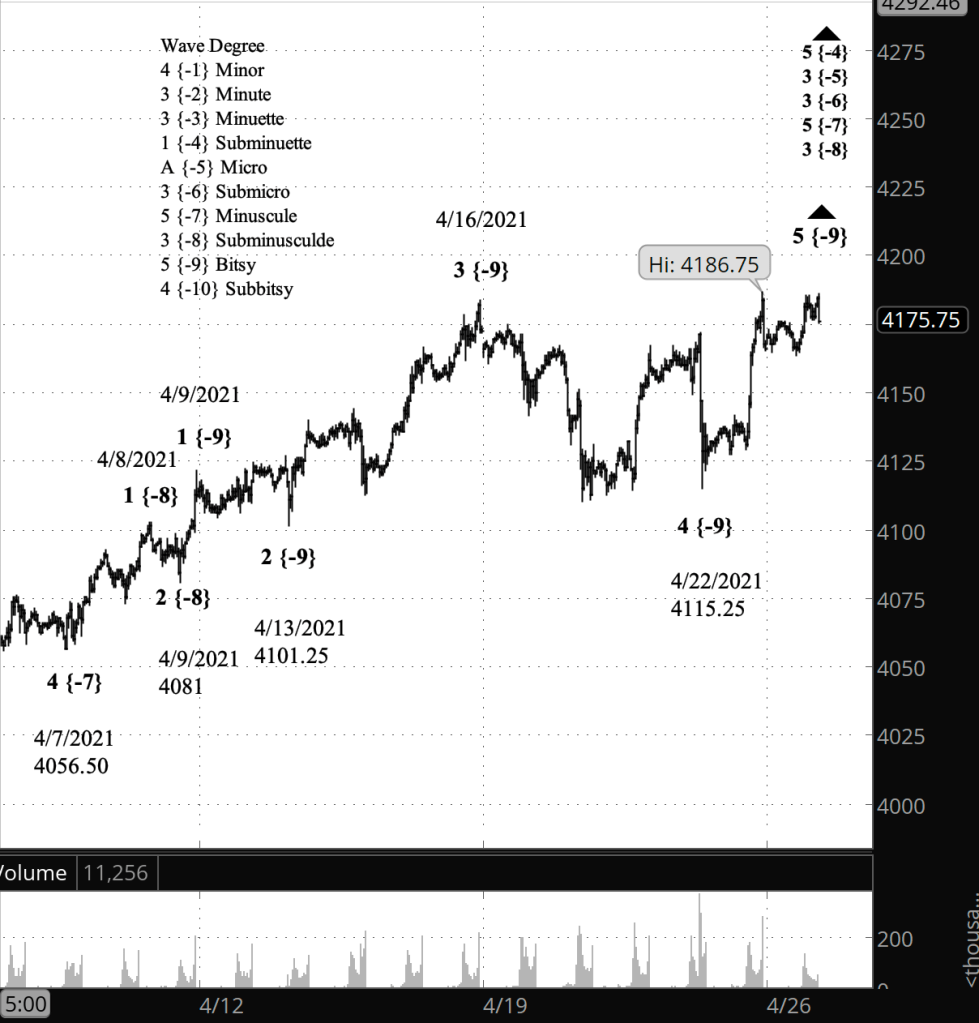
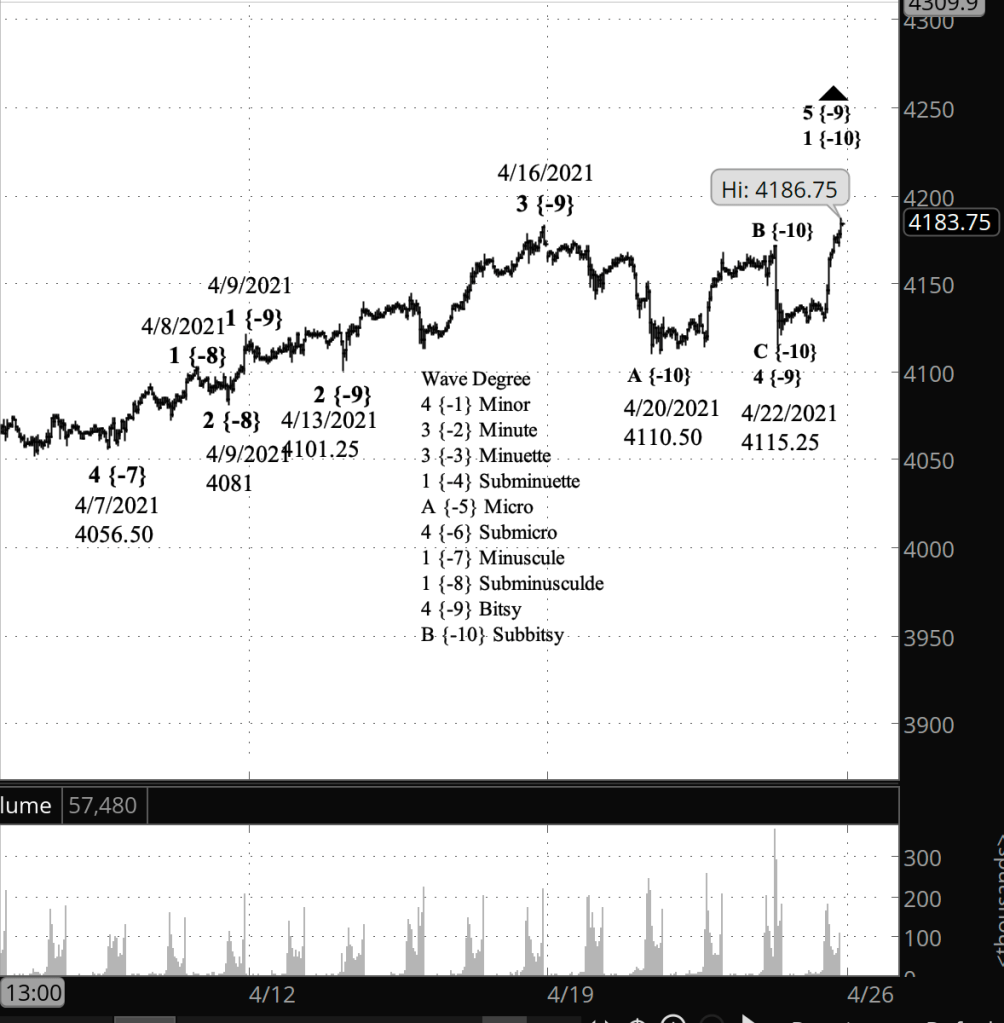
Half an hour before the closing bell. The S&P 500 has been trading in a narrow range today, leaving Friday’s high, 4186.75, intact so far, although the price is only around 3 points below that level. I’ve updated the chart below.
9:50 a.m. New York time
What’s happening now? The S&P 500 E-mini futures, in overnight trading, remained below Friday’s high of 4186.75.
What does it mean? The rise that began April 22 has completed its middle leg, and is now in a correction that will be followed by a rise to a new high.
[S&P 500 E-mini futures at 3:30 p.m., 40-minute bars, with volume]
What does Elliott wave theory say? The rise that began April 22 is wave 5 of Bitsy degree, and within it, at Subbitsy degree, the price has completed its 3rd wave and is now in a 4th wave correction, which will be followed by a 5th wave rise to new highs.
The end of Bitsy wave 5 will mark the end of its parent wave, Subminuscule wave 3, which began on April 9. The completion will be followed by shallow 4th wave correction at Subminuscule degree.
At the close.The high point of the day at the close was 4186.75 on the futures, 4194.17 on the index. In terms of Elliott wave analysis, the upward trend that began on April 22 is, from smaller to larger…
wave 1 of Subbitsy degree
within wave 5 of Bitsy degree
within wave 3 of Subminuscule degree
within wave 5 of Minuscule degree
within wave 3 of Submicro degree
within wave 3 of Micro degree
within wave 5 of Subminuette degree, which began its rise last December 21 from 3596 on the futures.
3:40 p.m. New York time
Twenty minutes before the closing bell. The S&P 500 has pushed up to a new high, resolving the count in favor of the bullish scenario.
[S&P 500 E-mini futures at 3:40 p.m., 40-minute bars, with volume]
9:50 a.m. New York time
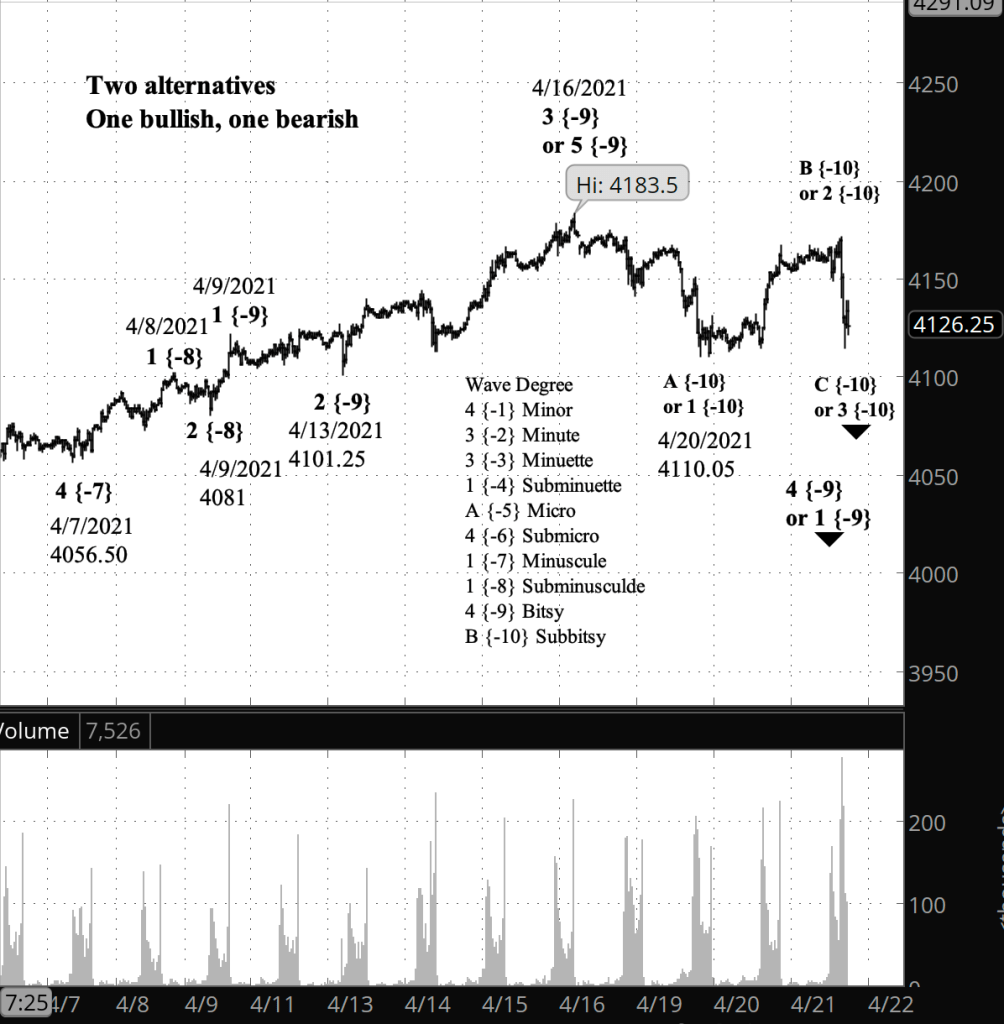
What’s happening now? Overnight trading of the S&P 500 E-mini futures did little to clarify the chart, and so I’ve retained the two interpretations — bullish and bearish — as the choice between them remains too close to call.
What does it mean? The bullish scenario: One more push downward and then a reversal up to new highs. The bearish scenario: A push downward to below 4110.50 on the first leg, and then lower still after a correction.
[S&P 500 E-mini futures at 9:48 a.m., 35-minute bars, with volume]
What does Elliott wave theory say? I took a longer glance at the rise from February 23, 2020 to a week ago, April 16, and it looks more like three waves up rather than five, which would lend a bit more credence to the bullish scenario. The count lacks the clarity to settle the choice. I’ll look at it in more detail this weekend.
Close up, the bullish scenario counts the decline from the 3rd wave peak on April 16 as wave 4 of Bitsy degree, which will be followed by wave 5 Bitsy degree, which will reach new highs. The bearish scenario counts the decline from the 5th wave peak on April 16 as wave 1 of Bitsy degree, which will move below its low so far of 4110.50.
Just a passing thought: Elliott wave analysis requires the analyst to bring more intuition to pattern recognition than any other analytical tool I’ve used. Elliott is the best tool I’ve found, but it lacks rigor. What it does bring to the table is an ability to quickly change its conclusions about the market, and to provide signals that will communicate that changed conclusion. As a trader, I find that to be incredibly useful.
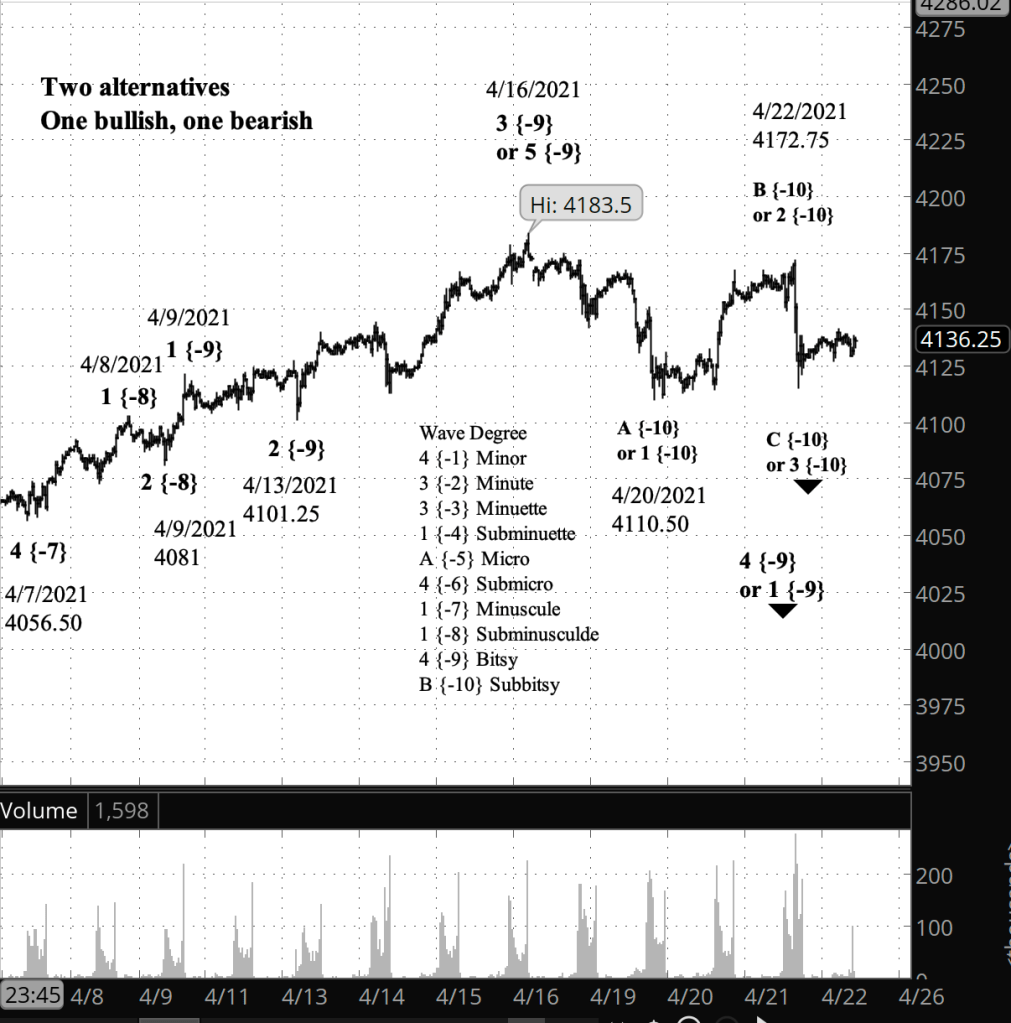
Half an hour before the closing bell. The S&P 500 declined during the day, the futures coming within 5 points of the low set on April 20. The movement doesn’t decide the question posed this morning: Is the bullish alternative count or the bearish alternative count the correct view of the chart? So we’ll head to the closing bell still puzzling over the ambiguity of the Elliott wave analysis. Interestingly, though, the volume picked up on the decline. So perhaps that’s a hint. Chart updated below.
9:40 a.m. New York time
What’s happening now? The S&P 500 E-mini futures leveled off somewhat in overnight trading.
What does it mean? The sudden rise has thrown the chart into a high degree of ambiguity with no clear guidance on which alternative is most likely. One alternative is bullish, treating the decline since April 16 as a correction within an ongoing rise. The other is bearish, treating the decline as the beginning of a new downtrend. At this point I haven’t a clue as to which one will play out in the next weeks.
[S&P 500 E-mini futures at 3:30 p.m., 35-minute bars, with volume]
What does Elliott wave theory say? In the bullish scenario, the decline from April 16 is wave 4 of Bitsy degree, and internally wave A is complete and wave B is either in progress or complete. Bitsy wave 4 will be followed by a push to new highs — Bitsy wave 5.
In the bearish scenario, the decline from April 16 is wave 1 of Bitsy degree, and internally wave 1 is complete and wave 2 is underway and nearing completion. Bitsy wave 2 will be followed by a further, more energetic decline.
If the price moves above the peak of April 16 (4183.50 on the futures, 4191.31 on the index), and if the rise from April 20 has three waves internally, then the bullish scenario is correct.
If the price reverses downward to a significant degree and if the rise from April 20 has three waves internally, then the bearish scenario is correct.
 Tim Bovee, Private Trader
You must be logged in to post a comment.