3:30 p.m. New York time
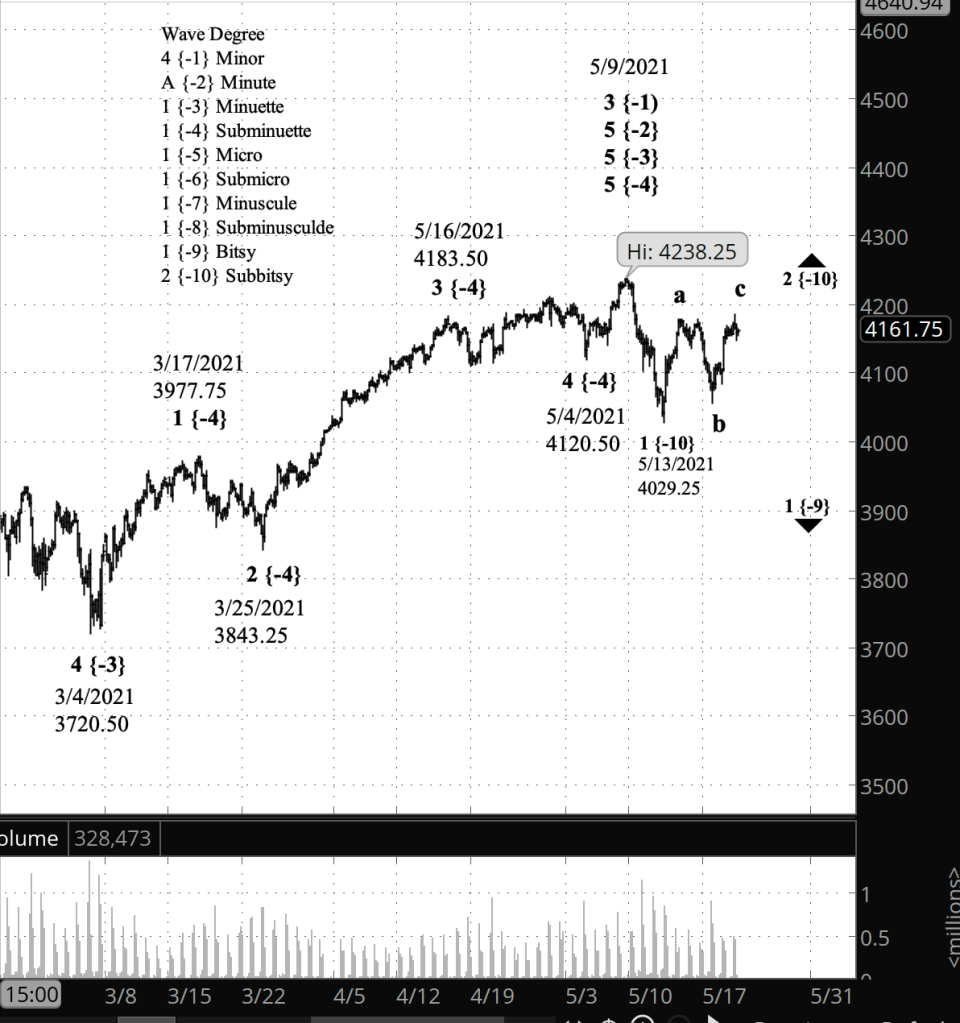
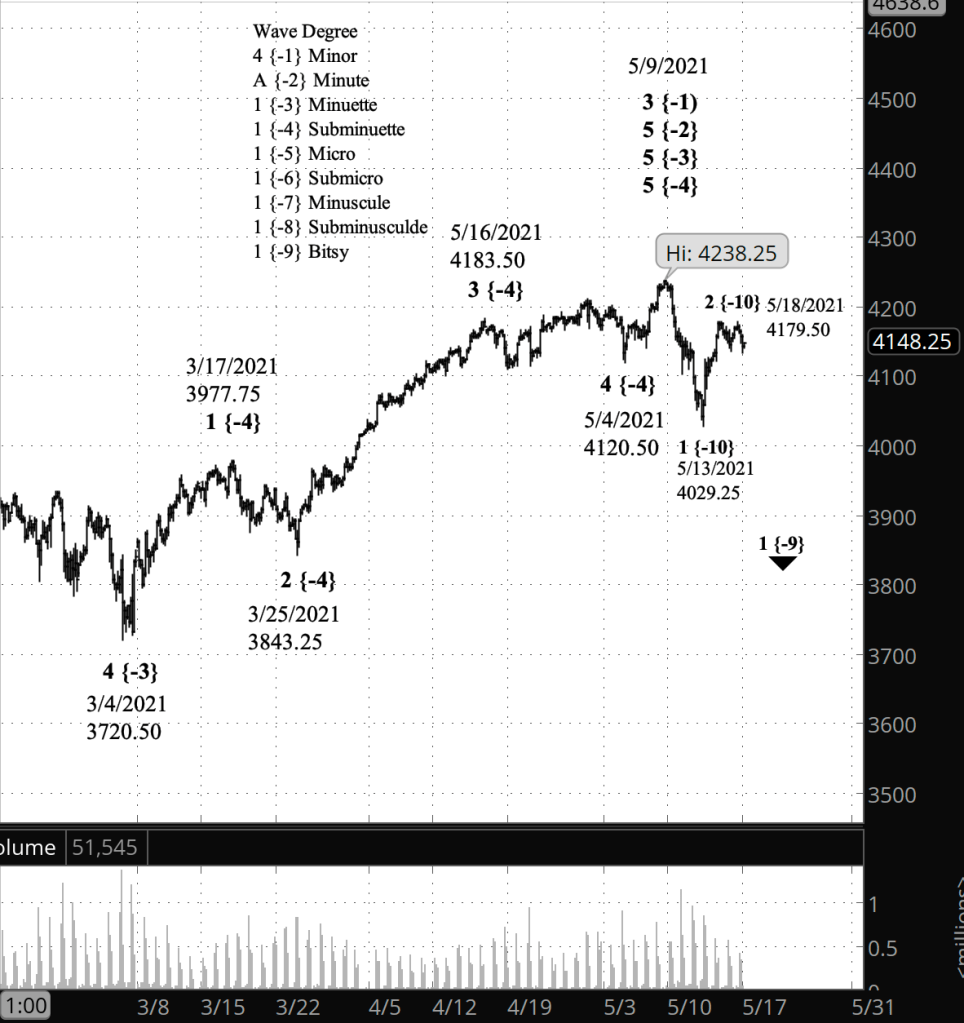
Half an hour before the closing bell. The S&P 500 worked its way downward by a little from the early afternoon high of 4210 on the futures, 4213.38 on the index. The rise is part of wave A wave within wave 2 of Subbitsy degree. After the A wave comes a downward B wave and then an upward C wave, completing the second pattern in the compound correction. Chart updated.
9:55 a.m. New York time
What’s happening now? The S&P 500 E-mini futures rose sharply at the opening bell, to a high so far of 4209.25.
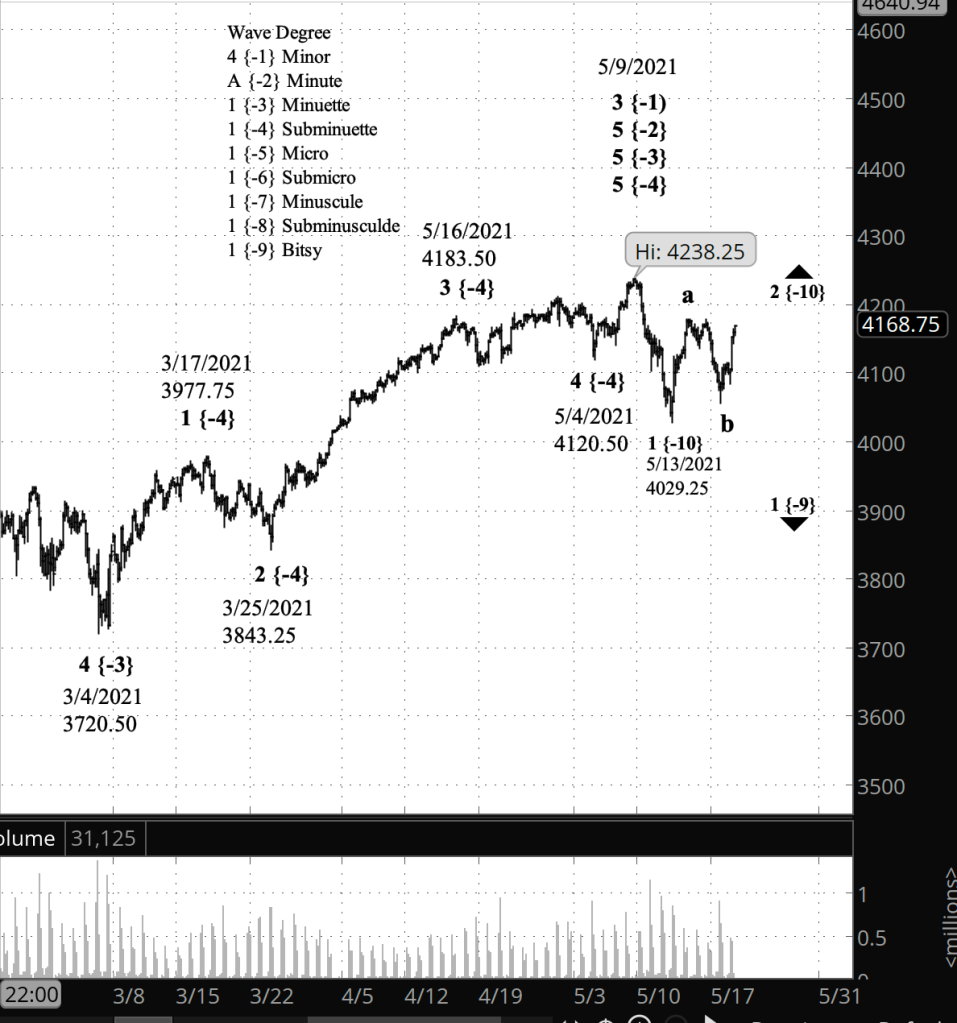
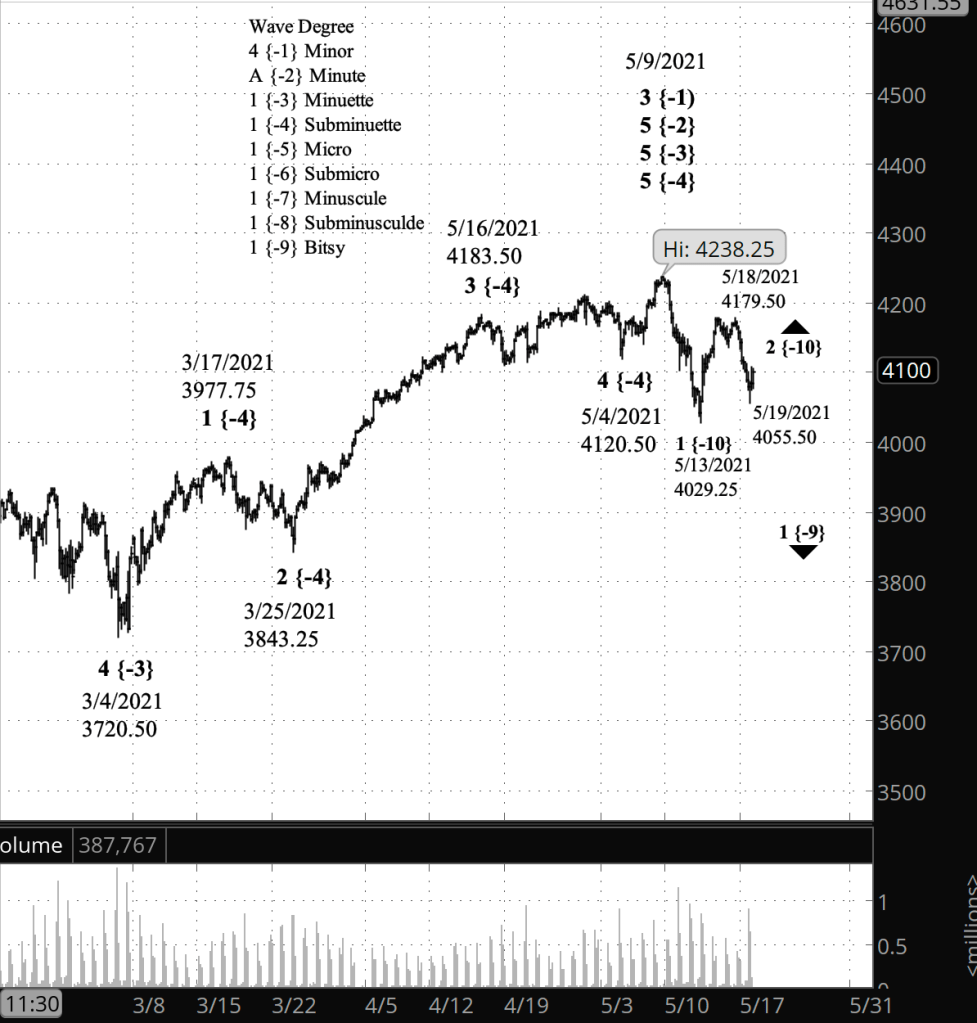
What does it mean? The pattern to me looks like the second alternative scenario I outlined in yesterday’s post: A declining separator in a compound correction, following the end of one corrective pattern and the preceding that start of another. The rise is the start of the next corrective pattern.
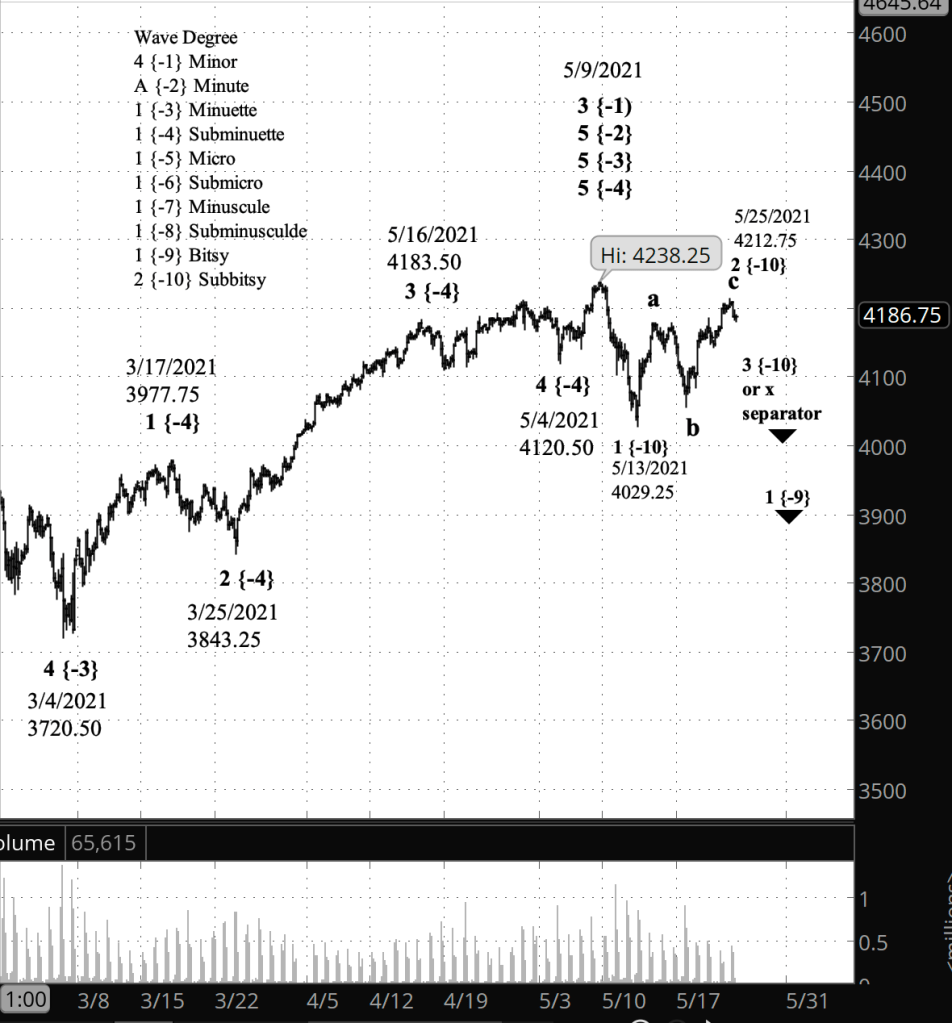
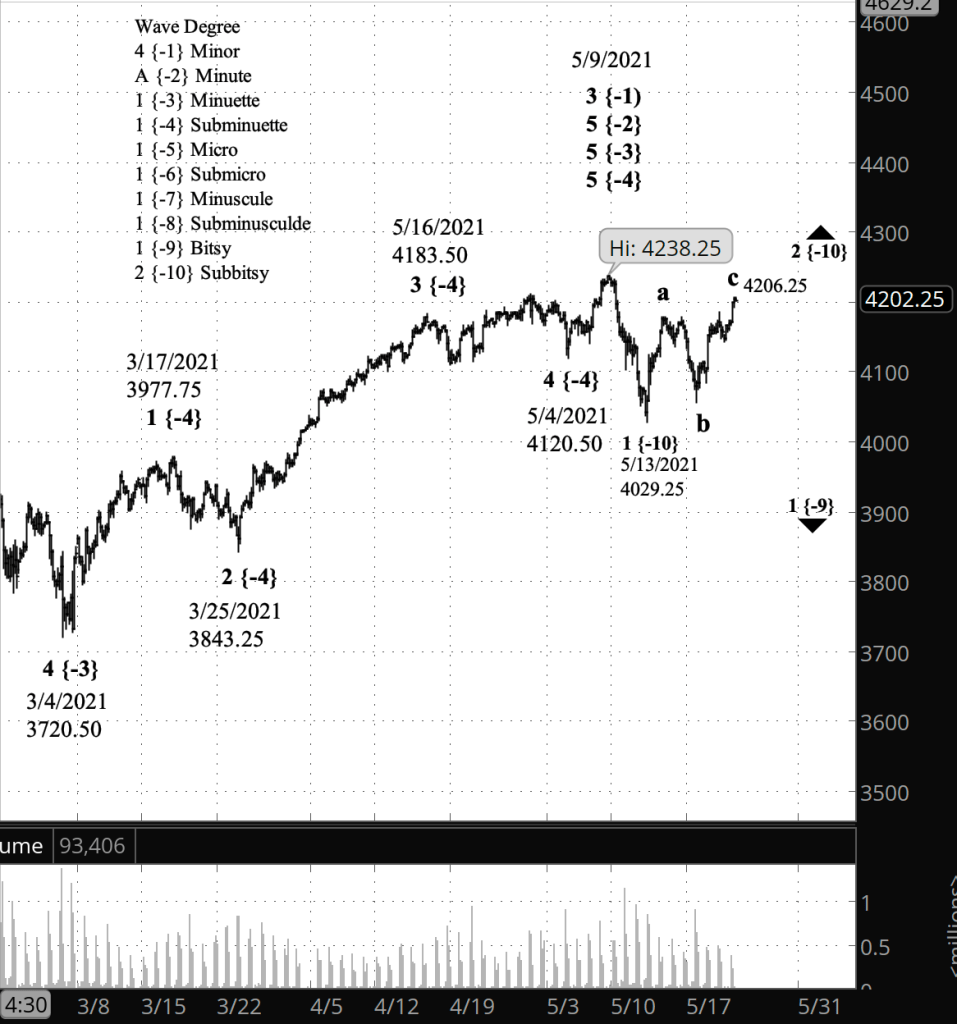
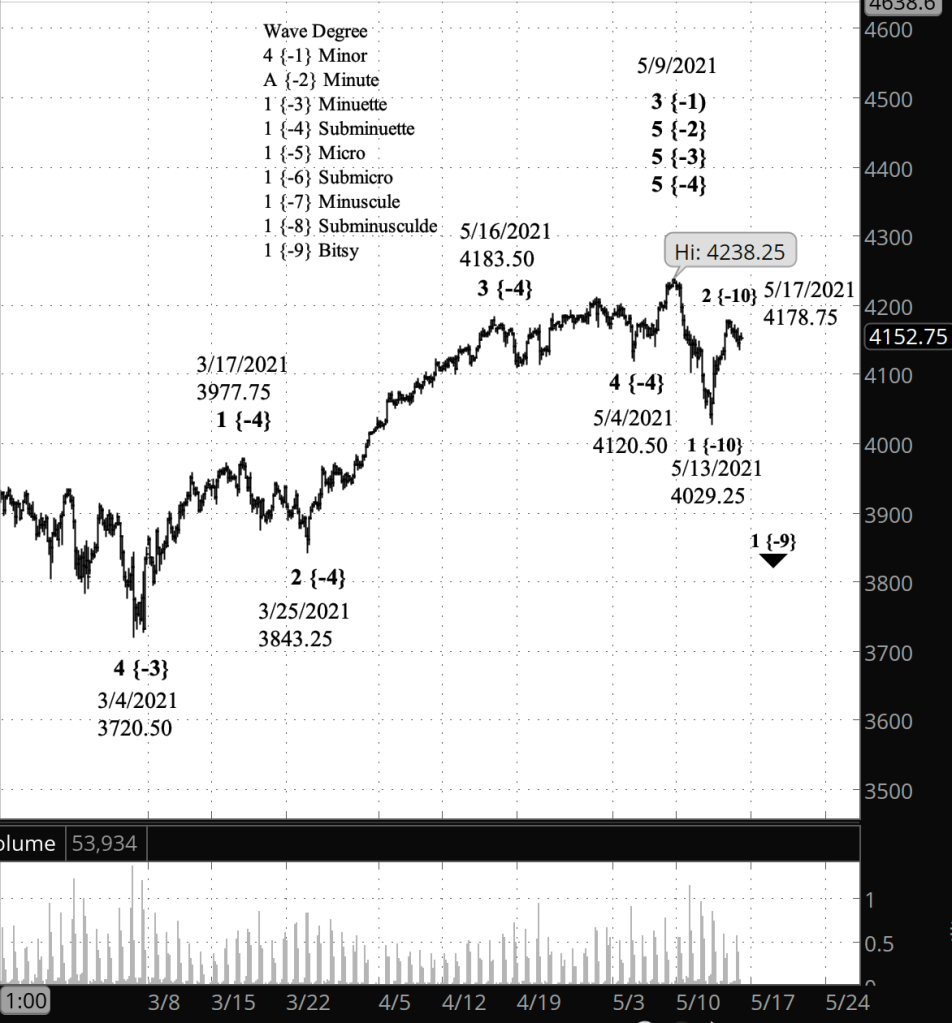
What’s the alternative? If the price moves above 4238.25, the high of May 9, then the analysis switches to the third alternative: The uptrend that began last year is still underway and higher prices lie ahead. If the price reverses and drops below 4029.25, the low of May 13, then the principle analysis from yesterday holds sway; the energetic middle portion of the downtrend that began May 9 is underway.
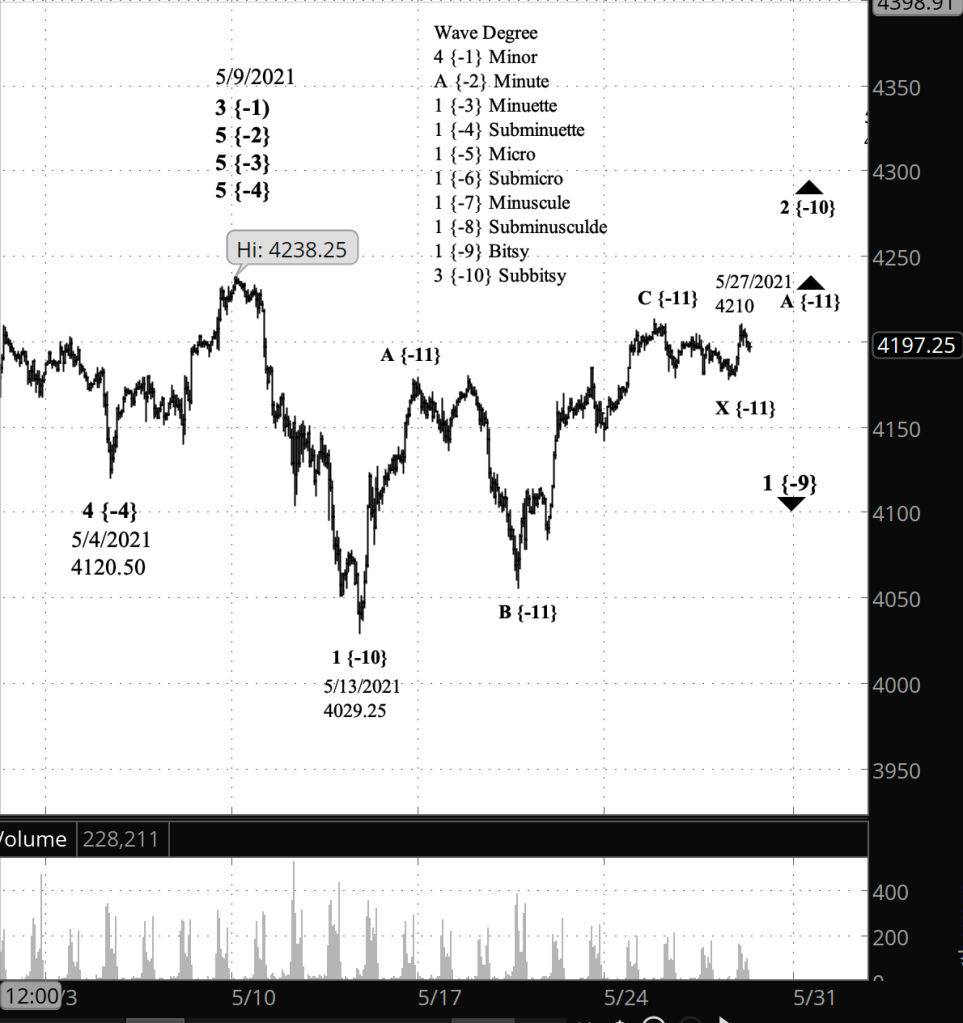
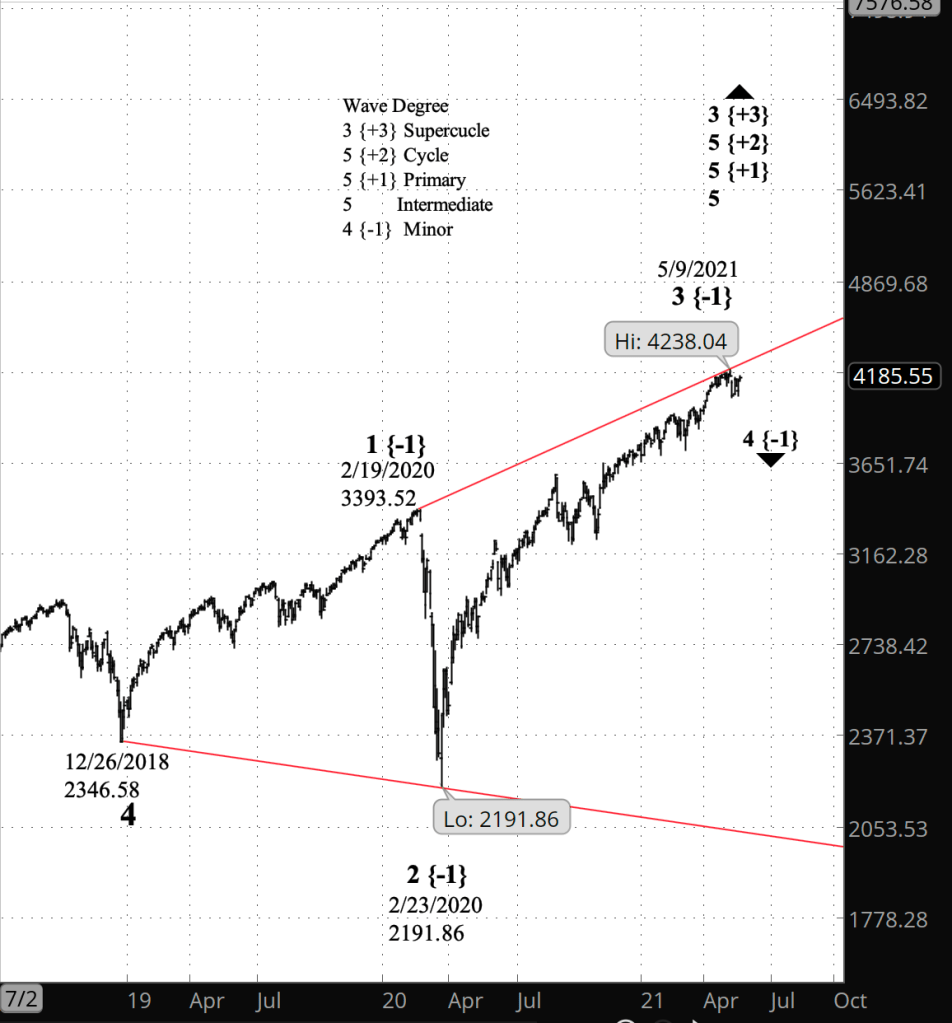
What does Elliott wave theory say? Under the principle analysis, the decline that began May 25 from 4212.25 is wave X, a separator wave within uptrending wave 2 of Subbitsy degree. Wave X is complete and is followed by wave A of a second pattern within a compound correction. The corretive pattern can be a Zigzag, a Flat or a Triangle.
Read More »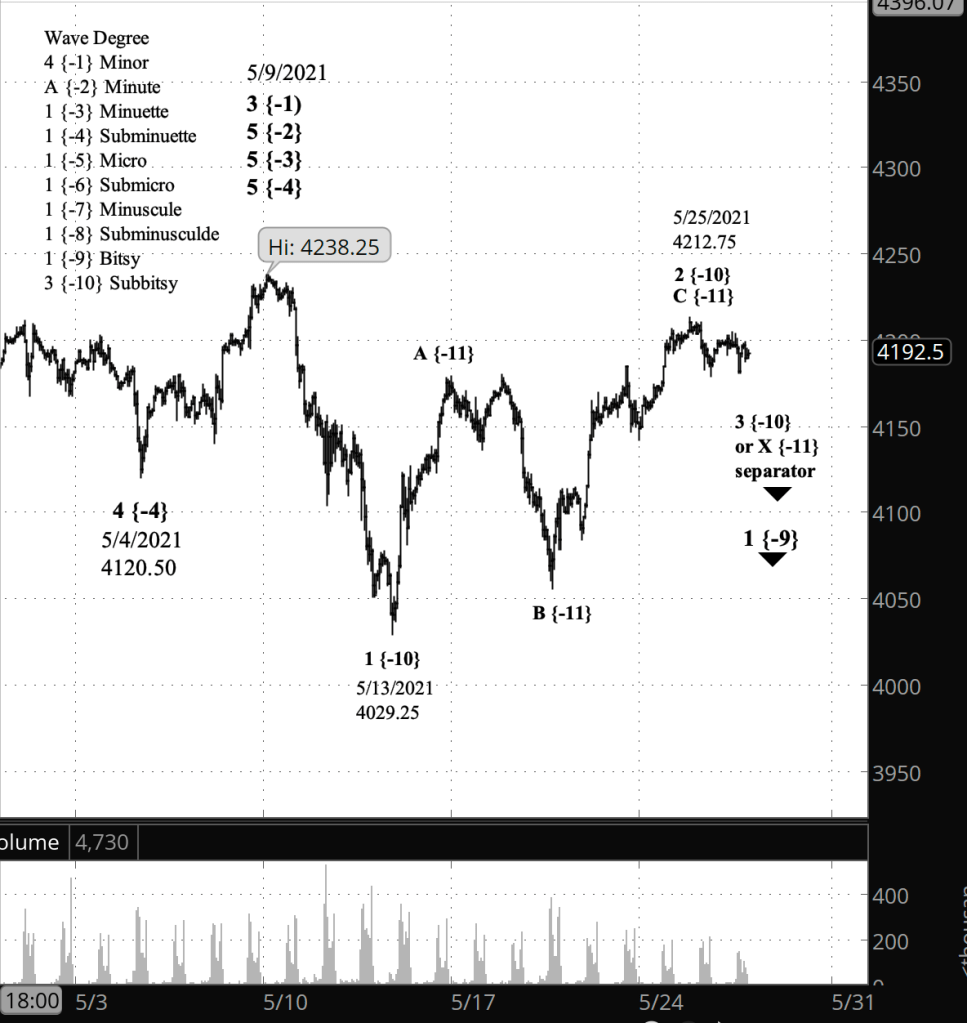
 Tim Bovee, Private Trader
You must be logged in to post a comment.