What’s happening now? The S&P 500 E-mini futures continued to climb overnight, tracing the first part of the final upward push within an upward correction in a major downtrend
What does it mean? The index and the futures and other related products will exceed the high high of October 12 — 3549.85 on the index chart, 3541 on the futures chart, most likely completing the upward correction within the decline that began September 2. The downtrend will resume, carrying the price back to the 3400s and well below.
What is the alternative? The low yesterday, October 15, and the subsequent rise can be analyzed as a continuation of the correction that began October 12. That was my principle count, but I’ve demoted it.
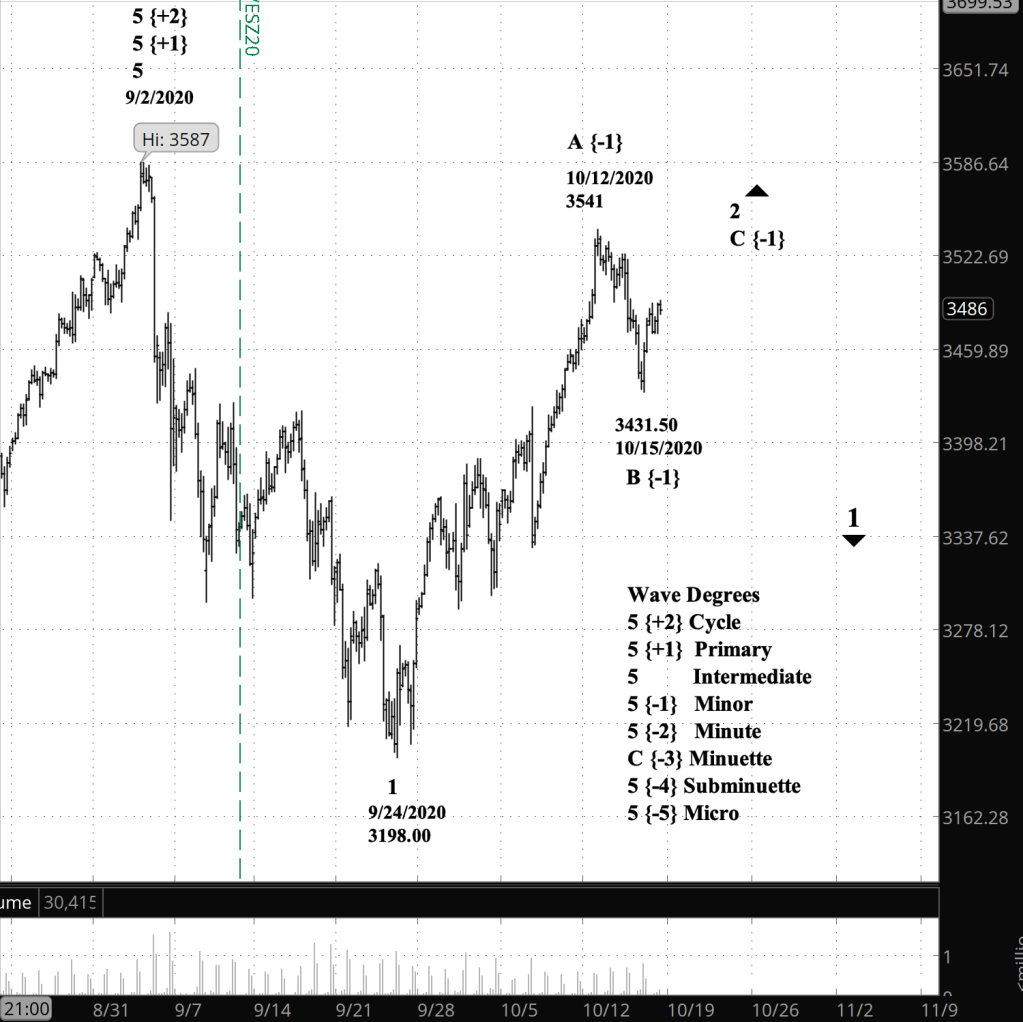
[S&P 500 E-mini futures, 4-hour bars]
What does Elliott wave theory say? I have noted before that I find the degree of waves to be something of a guessing game, especially early in a trend. With that in mind, I’ve revised my degree leveling by bumping it up several degrees to what I think is a more reasonable rendition. Although, in truth, there is no objective criteria that we can use at this point to ensure that the degrees are correct.
The rise that began October 15 is wave C of Minor degree, the final wave in wave 2 of Intermediate degree. The reversal at the end of Intermediate wave 2 will mark the beginning of wave 3, an energetic decline that will push well below the end of wave 1, into the 3100s and below.
My trading strategy. I’m holding my short iron condor options spreads on IWM in the hopes of catching the Intermediate 3rd wave decline before the options expire, 31 days from now. I’m continuing to hold my shares of the inverse fund SDS, which rises when the S&P 500 falls.
I’ve updated the chart for late in the session, showing that wave 5 of Micro degree has begun its rise.
10:20 a.m. New York time
What’s happening now? The S&P 500 index and E-mini futures declined in overnight trading by 109 points, a downward correction within an upward movement that will end with a final upward push.
Since the move occurred during futures trading — the index doesn’t capture trades outside of the normal stock-exchange hours — my discussion and the chart will focus on the futures.
What does it mean? The decline since yesterday, October 14, is in the next-to-the-last portion of the larger upward correction. The coming upward move will likely mark the end of the correction, although it is possible that the corrective move will extend in a compound pattern that will stretch it out in time.
What is the alternative? It’s possible, although I don’t consider it likely, that the October 12 high was in fact the end of the upward correction, and the movement we’ve seen since are the early stages of a resumption of the major downward trend that began on September 2.
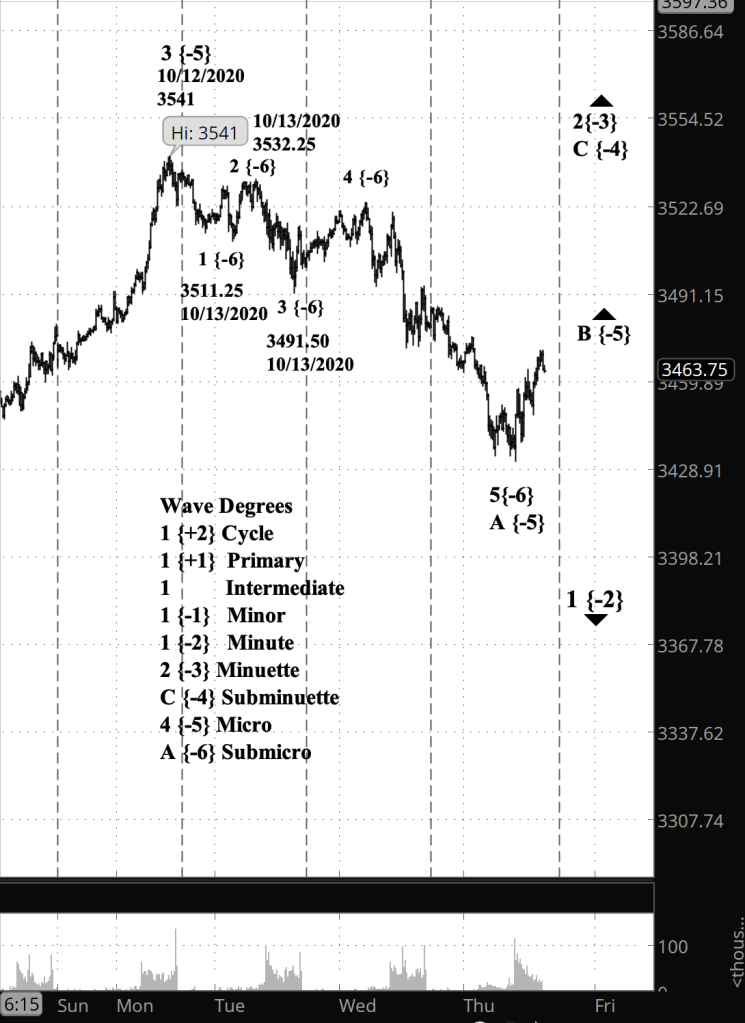
[S&P 500 E-mini futures, 15-minute bars]
What does Elliott wave theory say? The present downward movement is wave 5 of Submicro degree, the final wave of the movement, within wave 4 of Micro degree within wave C of Subminuette degree. All of that is happening within a 2nd wave upward correction at the Minuette degree within a main downtrend that began on September 2 that follows a rise dating back to at least 1974.
The end of Submicro 5 also marks the end of Micro 4. The uptrending Micro 5 will most likely carry the price above the September 2 high of 3588.11 on the index chart.
A small technical point: In the decline from October 12 wave 3 of Submicro degree seems quite short compared to the large Submicro 5 wave. The rule I have to account for in my count is that a 3rd wave can’t be shorter than both the 1st and 5th waves of the movement. In this instance, Submicro wave 1 on the futures chart 29.75 points in length, and wave 3 is 40.75 points. So the count is compliant with the rule.
My trading strategy. My short bear call spread options positions on IWM are closer to the profitability than before the drop, but are not yet profitable. My question: Do I exit for a small loss or do I hold until closer to expiration, which is 37 days away. The entirety of Minuette wave 1 took 14 days, so my inclination is to hold in the expectation that the main downtrend will resume significantly before the options expire.
I continue to hold my shares of SDS, an inverse ETF that profits when the S&P 500 index loses.
What’s happening now? The S&P 500 index continued to decline from its peak of October 12.
What does it mean? The decline lends further credibility to the notion that a downward correction within a larger upward correction has begun.
What is the alternative? If the decline ends without tracing out the full three waves that are expected of a correction, then the downward correction within a larger upward correction has not yet begun.
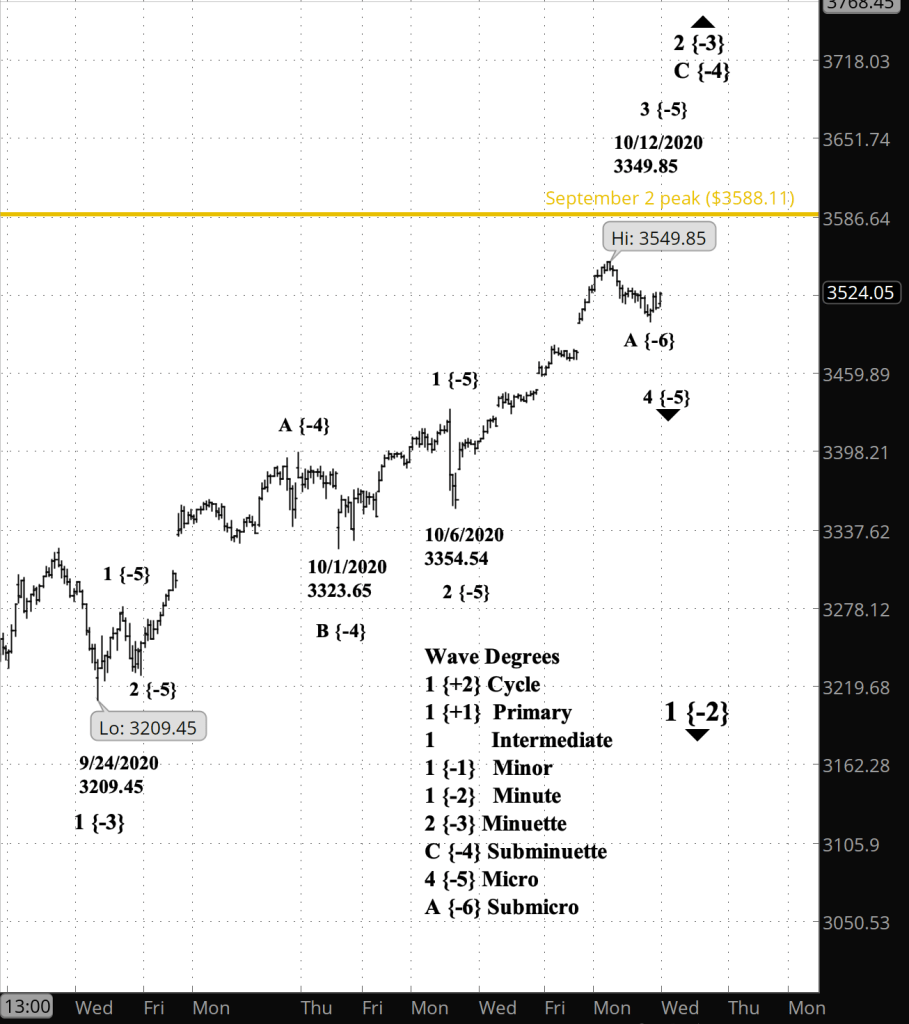
[S&P 500, 30-minute bars[
What does Elliott wave theory say? The upward correction is wave 3 of Subminuette degree, and by my count it has completed its 3rd subwave, of Micro degree. The decline from October 12 is the Micro 4th subwave. All of it is happening with an uptrending corrective wave, Minuette 2, which in turn is within downtrending wave 1 of Minute degree.
Within Micro 4, wave A of Submicro degree appears have three subwaves, and if the subsequent movement proves that appearance to be accurate, then Micro 4 will most likely prove to be a Flat pattern. A waves in Flats have three internal waves, and in Zigzags, five internal waves.
My trading strategy. I’m counting on Micro wave 4 to decline enough to return my short bear call options spread positions to profitability. If it doesn’t, then I’ll be looking at a loss. I’m continuing to hold my shares of SDS, an inverse fund that profits when the S&P 500 declines.
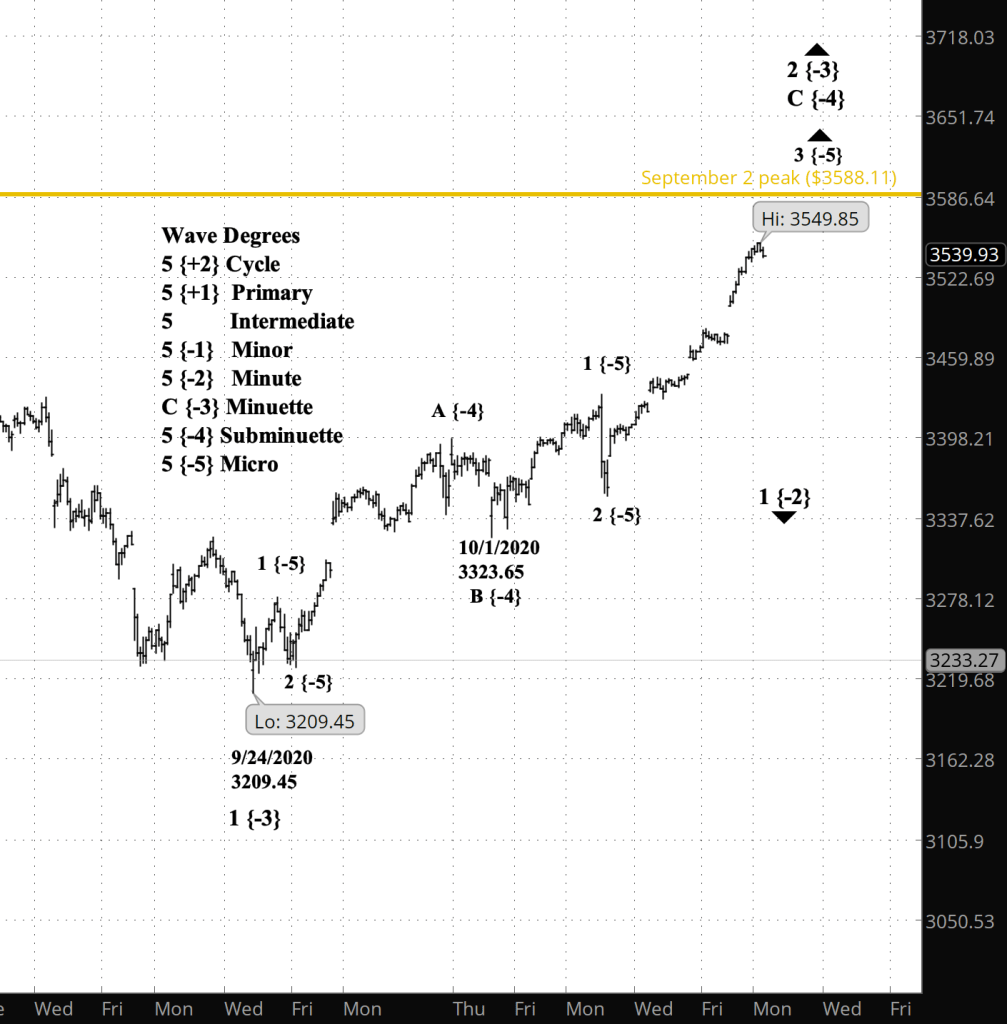
What’s happening now? The S&P 500 index fell off slightly from its peak in the present upward correction, 3549.85, attained yesterday, October 12.
What does it mean? The fall is the deepest since the decline of October 6, whose end marks the beginning of the present rise, suggesting at least the possibility that the present rise is complete. However, as the Elliott wave theory section will discuss, the end of the present rise is not the end of the larger-scale rise that began September 24, and that constrains the index’s price movement in two ways: It must eventually move above 3549.85, and yet it must not move above the high set on September 2, 3588.11, the starting point of a major decline that, history suggests, could last for years.
What is the alternative? There are two: 1) I might have misinterpreted the decline from September 2 has been misinterpreted; rather than a major decline, it is a lower-level decline within the uptrend that began in 1974, or 2) I might have misinterpreted the rise since September 6; rather than an upward movement in the middle of a larger upward movement, it is instead the final portion that completes the upward movement. If 2) is the case, then 3588.11 is the end of the upward correction and the higher-level downtrend will continue its decline.
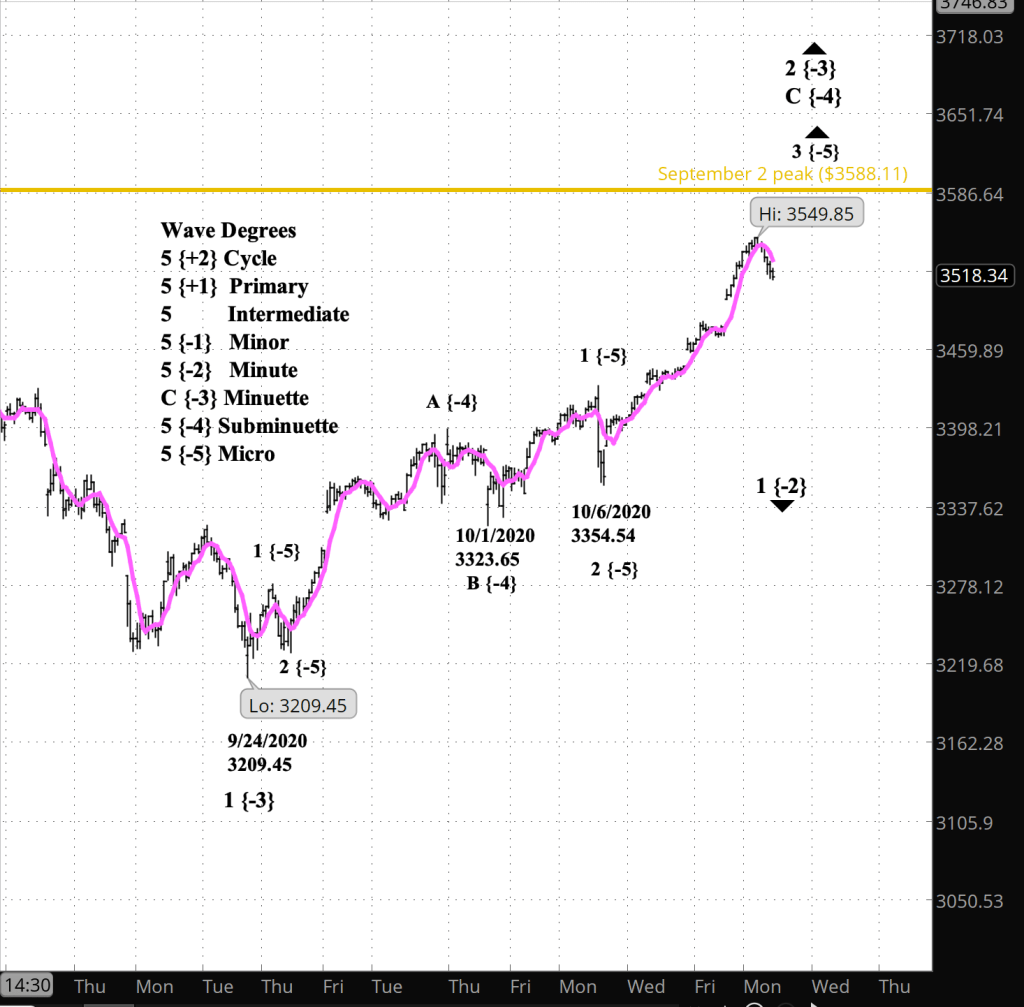
[S&P 500, 30-minute bars]
What does Elliott wave theory say? The present wave is Subminuette wave C, part of a Zigzag pattern, within Minuette wave 2, an upward correction. The entire structure is part of Minute wave 1, which began September 2 from 3588.11 and marks the end of a rise that moves at the least up to Cycle degree. The S&P 500 is presently in Cycle wave 1 to the downside. The preceding Cycle wave, 5, took 45 years to complete its work: 1974 to 2020.
Zigzag C waves have five subwaves, and by my principle count Subminuette wave C has been in Micro 3 since October 6. Once Micro 3 is complete, it triggers the constraints mentioned in the Alternative section.
By my principle count, Subminuette C of Minuette 2 must have a downward correction, or more likely, a sideways movement, and then end with a Micro 5 wave to the upside.
If Micro 5, and therefore Minuette 2, moves above the start of Minuette wave 1, which is 3588.11, it violates a fundamental rule of Elliott wave analysis: A 2nd wave cannot exceed the start of the preceding 1st wave of identical degree.
That leaves very little room for the 5th wave of Micro degree to do its work, a mere 38 points from yesterday’s peak. If yesterday’s high actually marked the end of wave 5 of Micro degree, then the price will fall and will never face the constraint.
On the chart I have superimposed a six-bar simple moving average, in garish purple, which smooths the price movements and makes the larger-degree waves more clear. I think it shows that to movement from September 24 to at least yesterday is wave 3 at the Micro level.
The other constraint is marked on the chart by a golden line at the 3588.11 level. If the price goes above that level, then the movement since September 2 has been misinterpreted and I’ll be revising my count.
My trading strategy. My bear call options spreads remain unprofitable for now but less so since the decline from yesterday’s high began. I shall hold the positions in the expectation of Subminuette wave 3 to the downside, which will restore the positions to profitability. I continue to hold my shares in the inverse fund SDS, which gains in value as the S&P 500 increases in value.
What’s happening now? The S&P 500 index rose to more than 25 points above Friday’s close, to a high so far of 3549.41 shortly after the opening bell.
What does it mean? The upward correction that began September 24, from 3209.45, continues, part of a larger downtrend that began in September 2 from 3588.11
What is the alternative? It’s possible that what my principle count labels as an upward correction is in fact a component of of the massive rise that began in 1974. If the price exceeds 3588.11, the the alternative count is correct. I’ve marked the 3588.11 level with a golden line on the chart.
[S&P 500, 30-minute bars]
What does Elliott wave theory say? Today’s chart takes a closer look at the index, focusing on the present wave 2 of Minuette degree, that began September 24. For a broader view, see Friday’s post. Within Minuette 2, I count the present position as wave 3 of Micro degree within wave C of Subminuette degree.
I had initially counted the rise from October 1 as part of an A wave, but the price is so close to the 3588.11 limit that I’ve relabelled that position as the end of wave B and the beginning of our present wave C.
My trading strategy. Wave C will be followed by a decline, and I’m counting on that to create an exit point for my short bear call options spreads. The management day for the position is October 30, and expiration is November 20. If the price pushes above the 3588.11 limit, then I exit immediately. I shall continue to hold my bear-oriented shares of the inverse S&P 500 fund SDS.
What’s happening now? The S&P 500 index continued to rise overnight, carrying with it an unusually heavy load of ambiguity.
What does it mean? I’m reworking my analysis today, using a simple moving average technique to separate the signal from the noise.
[S&P 500 E-mini futures, 4-hour bars]
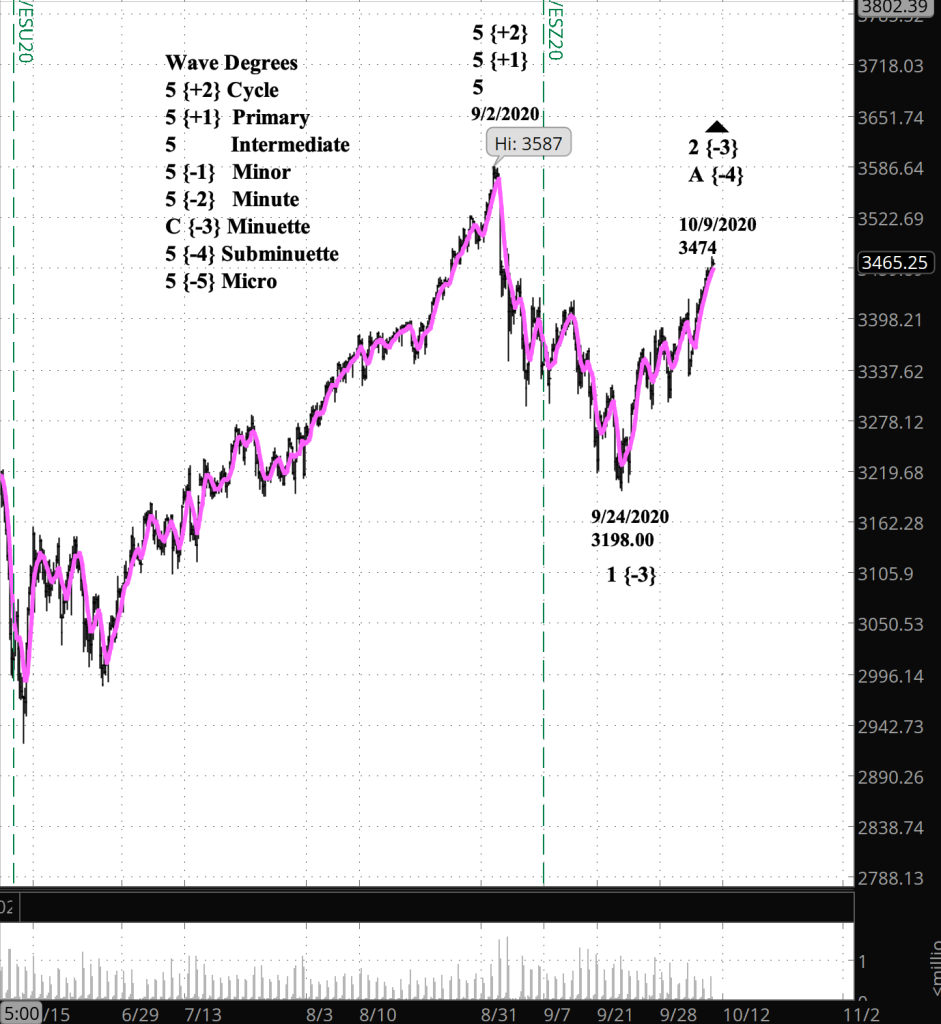
What does Elliott wave theory say? On the S&P 500 E-mini futures chart I’ve overlaid the price with a six-bar simple moving average, in garish purple, which aggregates the fluctuates and highlights the broader trend at any given point.
Starting with the September 2 peak, by this measure the futures traced five waves down in a movement that ended September 24, a 389-point decline. It then reversed and has reached a high so far today of 3474. That’s a 68% retracement. A 2nd wave tends to retrace heavily, sometimes taking back nearly all of the preceding 1st wave.
However — firm rule — a 2nd wave cannot move above the start of the 1st wave. If it doesn’t, then it’s not a 2nd wave and the chart must be recounted. The 1st wave on the S&P 500 index chart began, on September 2, at 3588.11. The corresponding point on the S&P 500 E-mini futures chart is 3587.
And so, the count. By this analysis, the five-wave decline from September 2 is wave 1 of Minuette degree, and the single-wave rise from September 24 is the Subminuette A wave — the initial subwave — of Minuette wave 2. Subminuette B will retrace somewhere between 38% and 70% of the preceding wave A, and then will come a C wave that, on this chart, will push to new heights, while remaining below the start of Minuette wave 1. The end of Minuette wave 2 will mark the start of Minuette wave 3, which will carry the price down to the 3100s.
This is a simpler structure than the one I suggested in Thursday’s analysis. Given a choice, I tend to select the simpler solution, and so this analysis will be my principle analysis going forward.
My trading strategy. For my bear call options spread position, I’m counting on that wave B to give me a perhaps profitable exit opportunity. The options are 42 days away from from expiration, so there’s time for Subminuette A to complete its work.
What’s happening now? The S&P 500 index rose after yesterday’s sharp decline and has exceeded the high point from which the decline began
What does it mean? My alternative analysis appears to better reflect what’s happening; the decline marks the boundary between two parts of a compound correction pattern.
What is the alternative? The whole 4th wave could be a triangular formation.
[S&P 500 index, 5-minute bars]
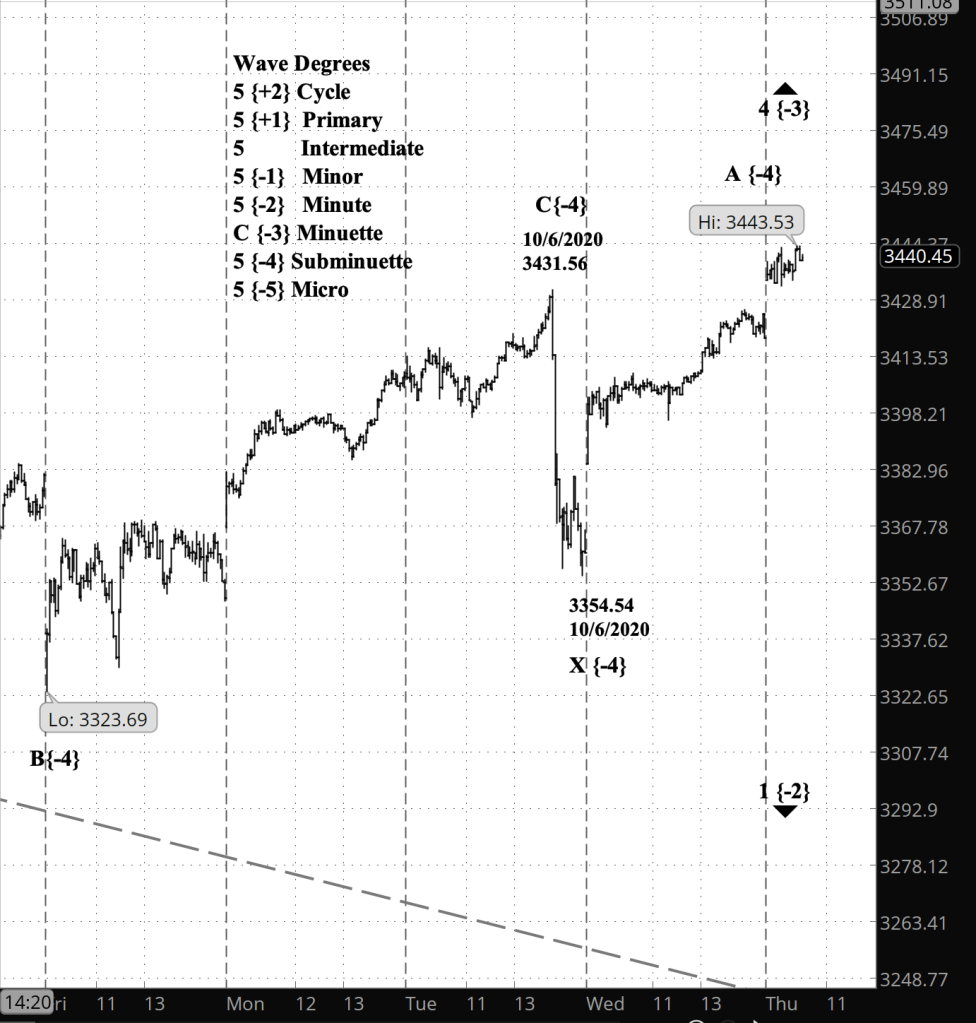
What does Elliott wave theory say? Under what is now my principle analysis, the high yesterday marks the end of Subminuette wave C within Minuette wave 4, which in turn is a subwave of Minute wave 1, the first part of the dominant downward trend. The subsequent decline is Subminuette wave X, a separator, as Minuette wave 4 continues with Subminuette wave A of the second part of a compound correction.
My trading strategy. My short bear call options spread on IWM is in losing territory under the new analysis. I’ll exit on the dip, for either a small profit or a loss. I shall continue to hold my shares in SDS, an ETF that runs to the inverse of the S&P 500.
What’s happening now? The S&P 500 index his a low 3354.54 on Tuesday after falling from its a peak of 3431.56 set earlier in the day. At the end the day it reversed and so far has retraced about two-thirds of the decline.
What does it mean? I interpret the decline to be the end of the correction that began on September 24 and the beginning of a resumption of the downward trend that will carry the price to the 3100s or below.
What is the alternative? The decline could instead be a continuation of what would prove to be a more complex correction pattern.
[S&P 500 index, 15-minute bars]
What does Elliott wave theory say? The correction that ended on Tuesday is Minuette wave 4, and has been followed by the beginning of Minuette wave 5 to the downside. Within that downward movement it appears that Subminuette wave 1 may be complete, and the rise today is a Subminuette wave 2 correction. All of this is happening within downtrending Minor wave 1, which began on September 2 from 3588.11. A 2nd wave, such as the one we’re in presently at the Subminuette degree, often retraces a substantial portion of the 1st wave decline. It will be followed by a 3rd wave decline to lower lows.
If, instead, the wave 4 correction is tracing a more complex pattern, then wave 5 has not yet begun, and we’re seeing either an X-wave separator to the downside or a wave within a developing triangle.
My trading strategy. I continue to hold my bear call spread options position on IWM, an ETF that tracks the Russell 2000 and has a chart that closely resembles that of the S&P 500. Management day, when I exit if the position is profitable, is October 30. Before that, if the position reaches 50% of maximum potential profit, then I’ll exit immediately. If it’s unprofitable on management day, then I’ll assess the risks and either hold it a bit longer or exit for a loss.
I hold stock positions on SDS, and ETF that moves inversely to the S&P 500. When the index falls, SDS makes money.
Update 10/30/2020: I exited my bear call spread position on IWM 21 days before expiration, for a $0.98 credit per contract/share, a profit before fees of $0.64 per contract. Shares were trading at $155.08, down $2.30 from the entry level.
My decision to exit was based on prospects derived from Elliott wave analysis. By my count, the market at exit was in a B wave of Subminuette degree within a 4th wave of Minuette degree, all within a larger 3rd wave of Minute degree. The 21-day to expiration mark signals that profitable positions be sold, although the rules can be bent if the Elliott wave analysis is strong enough. The analysis pattern, suggesting a likelihood of a near-term rise. Rather than accept that risk, I took my profit.
Shares declined by 1.4% over days for a -15% annual rate. The options position produced a 65.3% return for a 993% annual rate.
I have entered a short bear call spread on SPY, using options that trade for the last time 45 days hence, on November 20. The premium is a $1.62 credit per contract share and the stock at the time of entry was priced at $157.36.
The implied volatility rank (IVR) stands at 32.
Premium:
$1.62
Expire OTM
IWM-bear call spread
Strike
Odds
Delta
Calls
Long
172.00
86.0%
18
Break-even
164.38
84.0%
20
Short
166.00
82.0%
22
The premium is 54% of the width of the position’s wing. The profit zone covers a 4.5% move to the upside and unlimited to the downside.
The risk/reward ratio is 2.7:1, with maximum risk of $438 and maximum reward of $162 per contract.
Elliott wave analysis: At the time entry IWM appeared to have completed a Minuette wave 4 upward correction within downtrending Minute wave 1. If in fact wave 4 is complete, the price is in for a drop down to the vicinity of the $130s. If it is instead embarking on an extension of wave 4, then the trade’s structure provides ample upside protection to allow for a minimally profitable exit.
I’ve added a graf to the bottom of the IWM analysis giving the Elliott wave situation at entry.
3 p.m. New York time
I’ve entered a bear call options spread position on IWM and have posted an analysis.
10:10 a.m. New York time
What’s happening now? The S&P 500 index continues to rise, as it nears completion of an upward correction within a larger downward trend.
What does it mean? After the correction is complete, the downtrend will resume, perhaps reaching 3100.
What is the alternative? The correction could continue, forming a complex pattern. More on that in the Elliott wave section, below.
[S&P 500 index, 10-minute bars]
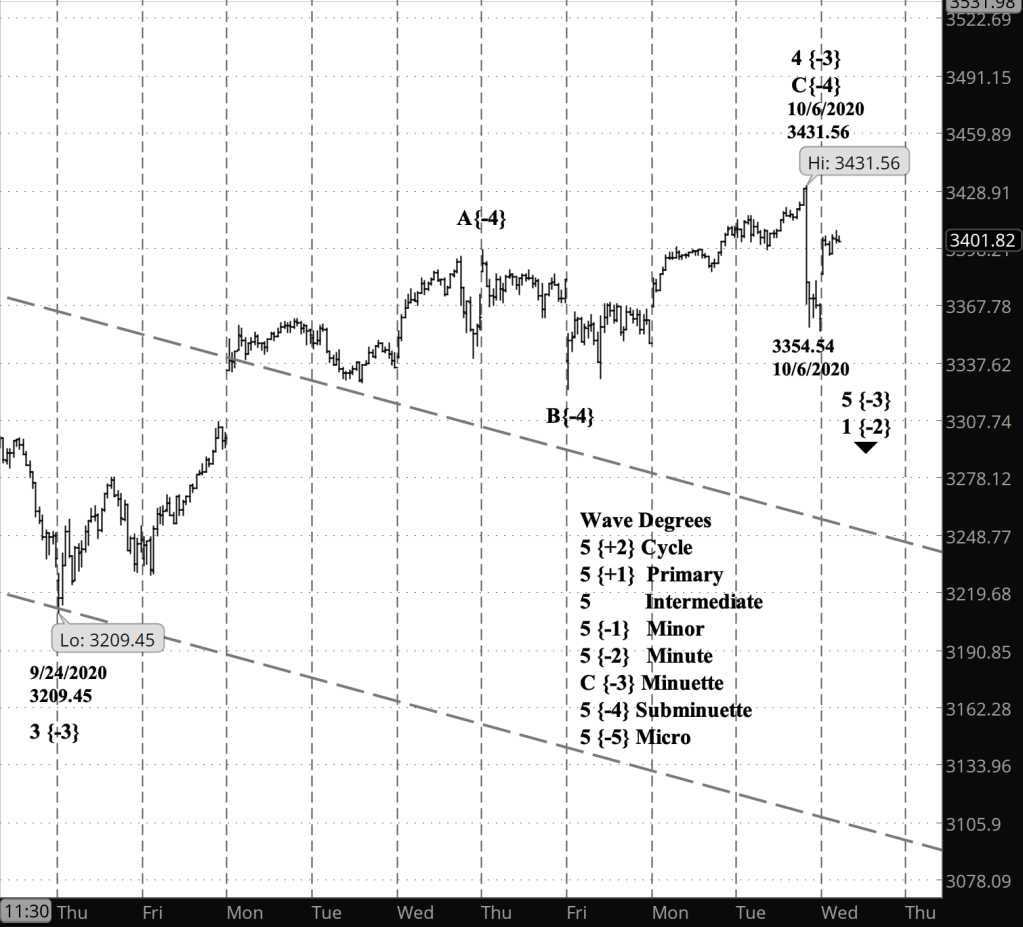
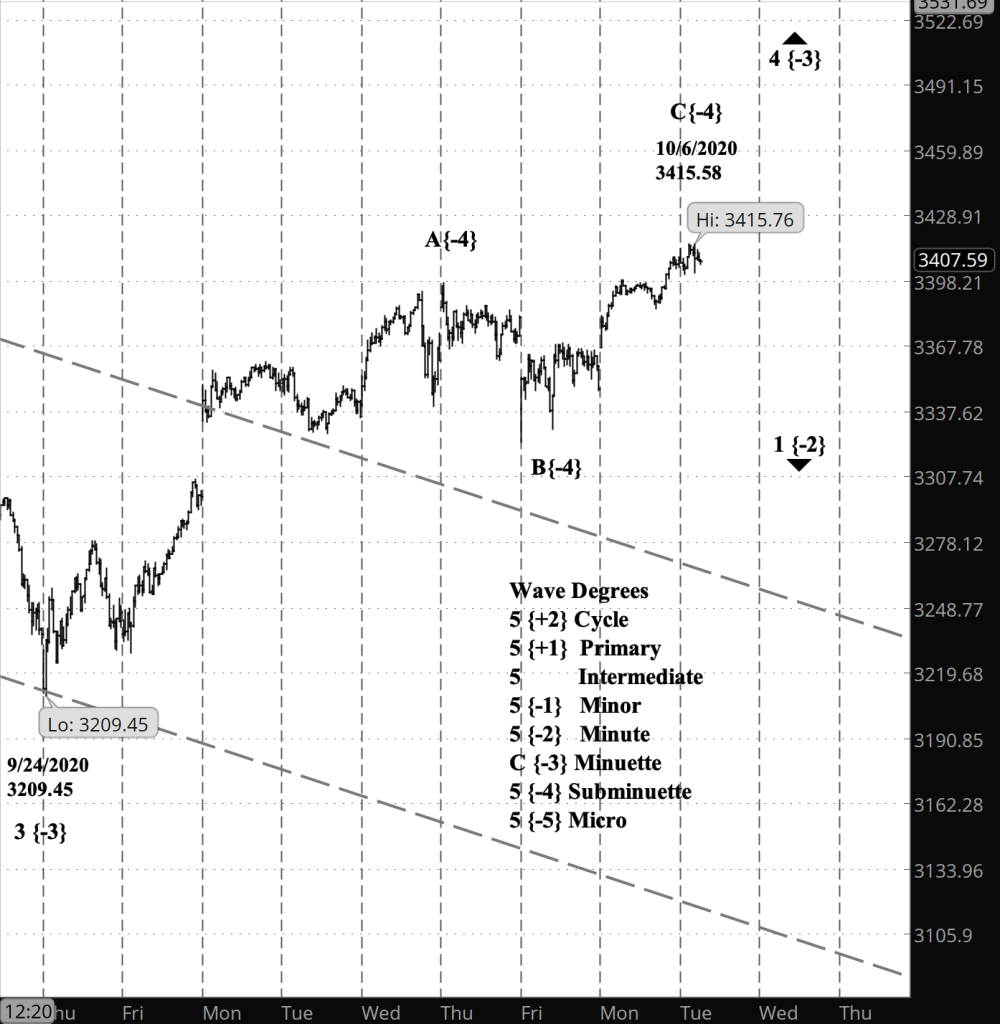
What does Elliott wave theory say? I’ve redone my count and now place the present moment in Subminuette wave C (it was A), which is in its 5th wave in the Micro degree. That’s a long way of saying it’s almost over. The end of Subminuette C may also ends Minuette wave 4, which began September 24. I used the hedge word, “may” because 4th waves often tend to form complex combinations, such as a Zigzag followed by a Flat. Or perhaps, a triangle, with its widening swings. This guarantees some ambiguity when the present wave C reaches its end.
In any case, once Minuette wave 4 is complete, what follows is Minuette wave 5, whose downward course could reach the lower boundary of the price channel, presently around 3113. The end of Minuette 5 also marks the end of Minute wave 1 to the downside, which began on September 2.
My trading strategy. For people like me who are trading the bear side, the end of Minuette wave 4 creates an options trading opportunity. The ambiguity at the end of wave 4 also also creates the chance of a head fake, since maybe the end wave C is a 5th wave, or maybe its more of the 4th wave. I prefer to trade in the direction of the parent wave’s trend, and the parent of this Minuette wave 4 is Minute wave 1, decided to the downside. That’s what underlies my bearish preference.
For my shares in SDS, which profits from a declining S&P 500, I’m trading larger-scale trends, with a goal of getting a tax break by holding the positions for a year, making them long-term profits.


You must be logged in to post a comment.