The S&P 500 index has pushed up to a new high in the rise that began September 24, to 3401.99 about an hour before the closing bell. Otherwise, no change to the analysis.
10:15 a.m. New York time
What’s happening now? The S&P 500 index continues to work through the early stages of a downward move.
What does it mean? The decline follows a rise from September 24 to October 1, and will be followed by another upward movement.
[S&P 500 index, 30-minute bars]
What does Elliott wave theory say? The decline that began October 1 is Subminuette wave B within Minuette wave 4. So far, the 4th wave has retraced 86% of the preceding 3rd wave of the same degree, a few points greater than the usual range.
My trading strategy. The optimal date for entering the November monthly options is October 6, tomorrow. So, sometime, today through Wednesday, I’d to place trade, if the analysis supports it. As my vehicle, I’m looking at the exchange-traded fund IWM, which tracks the Russell 2000 index. It has a higher implied volatility rank, above 30, and that gives a better return than something lower, such as SPY, which tracks the S&P 500. I’ll most likely structure any position as a short bear call spread, and I’ll post a full analysis when I make the trade.
Equities: I continue to hold my shares in the exchange-traded fund SDS, which profits when the S&P 500 falls.
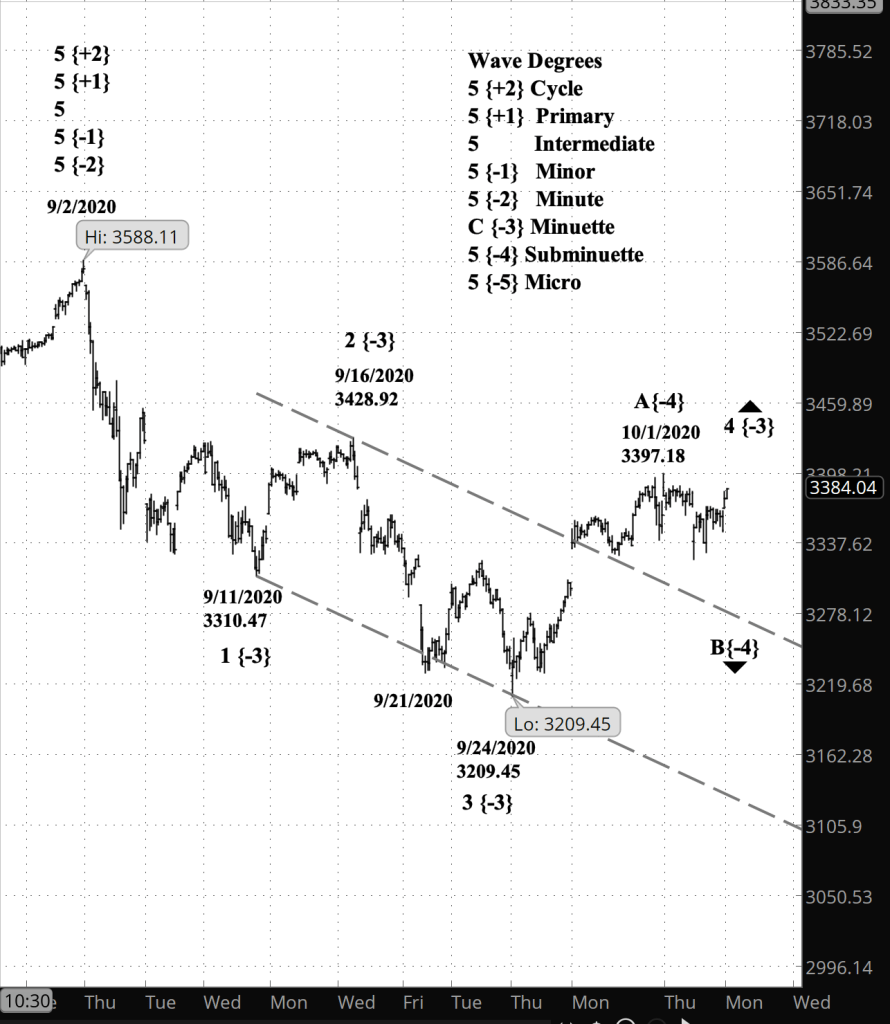
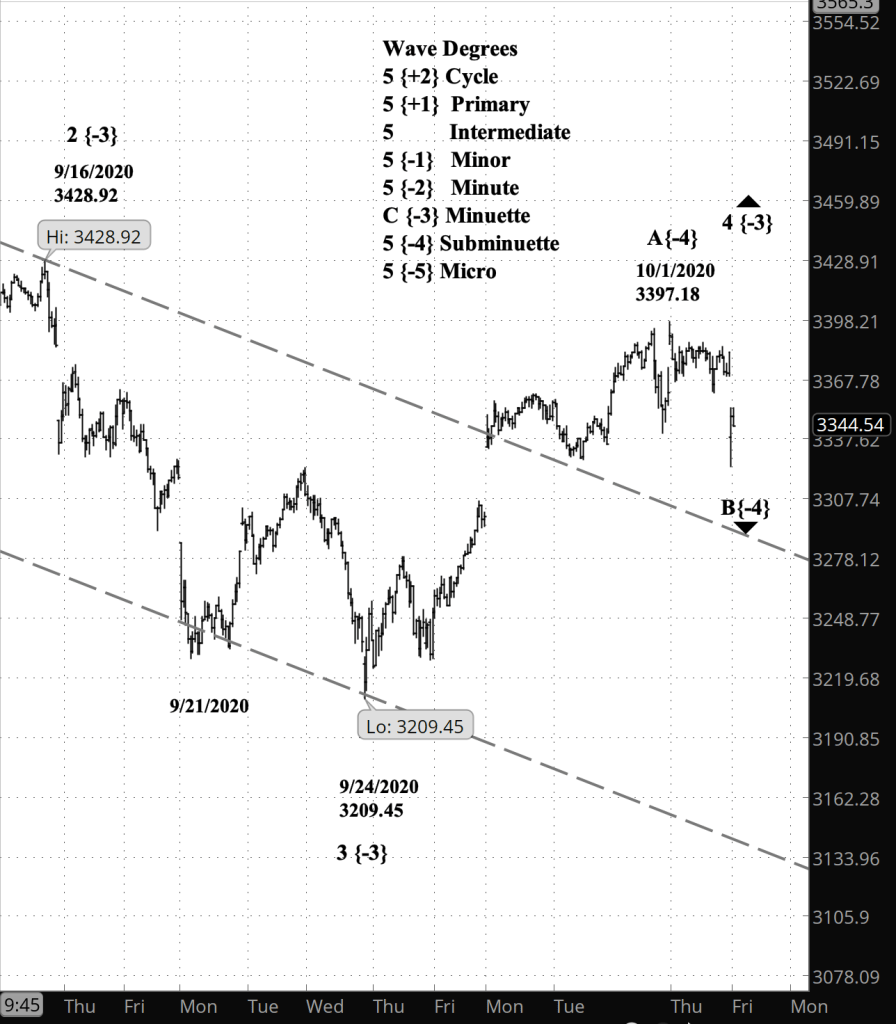
What’s happening now? The S&P 500 index opened with a 25-point descent below the October 1 high of 3397.18.
What does it mean? The magnitude of the fall gives greater certainty to my conclusion that yesterday’s high marks the start of the second, downward leg of the upward correction that began September 24.
[S&P 500 index, 15-minute bars]
What does Elliott wave theory say? Subminuette wave A rose 187.73 in 7 days, or 5.8%. What follows is Subminuette B, the second wave of the Minuette wave 4 correction within downtrending Minute wave 1.
B waves, by their nature, can be shallow or deep, and in fact can move beyond the starting point of the preceding wave A, which in this case was 3209.45. Elliott’s rules give very little guidance as to the magnitude of the fall.
My trading strategy. I won’t trade options on a B wave. There’s way too much uncertainty. I shall continue to hold my positions in SDS, an inverse fund based on the S&P 500.
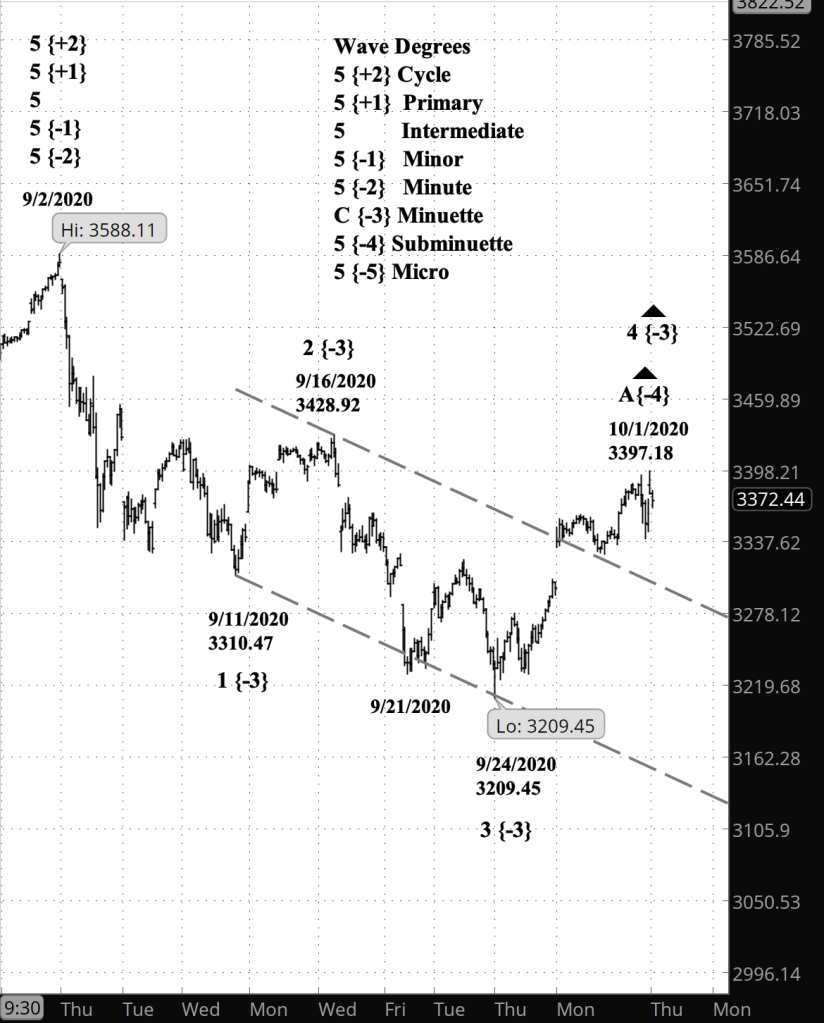
What’s happening now? The S&P 500 index moved a bit higher in overnight trading, to a high so far today of 3397.18. The upward correction that began September 24 has so far covered 187.73 points, or 5.8%.
What does it mean? The correction continues to trade above the upper boundary of the price channel and has met the formal requirements of completion. However, there is nothing that stops it from rising further.
What is the alternative? The correction could also take on a more complex form. See the Elliott wave discussion, below.
[S&P 500 index, 30-minute bars]
What does Elliott wave theory say? Fourth waves tend to be the most varied of the subcomponents of motive waves, and the most likely to extend into compound patterns. What we’ve seen so far with this 4th wave of Subminuette degree is a Zigzag, which in itself is unusual in that it is the same pattern as wave 4. Almost always the 2nd and 4th waves have different patterns. It’s possible that Subminuette 4 will continue with an X-wave separator, and then trace out another pattern, such as a Flat or another Zigzag. It’s also possible that what we’re seeing is a Horizontal Triangle in the making.
All of this is happening within a corrective subwave within Minuette wave 3, which in turn is a component of Minor wave 1.
My trading strategy. Given the ambiguities, I’ll be cautious about entering new options positions and will continue to hold my shares in the bearish exchange-traded fund SDS.
The S&P 500 index peaked at 3393.56 and reversed to the downside, potentially completing wave A of Subminuette degree to the upside and beginning the Subminuette B decline. We’ll see what happens overnight.
10:25 a.m. New York time
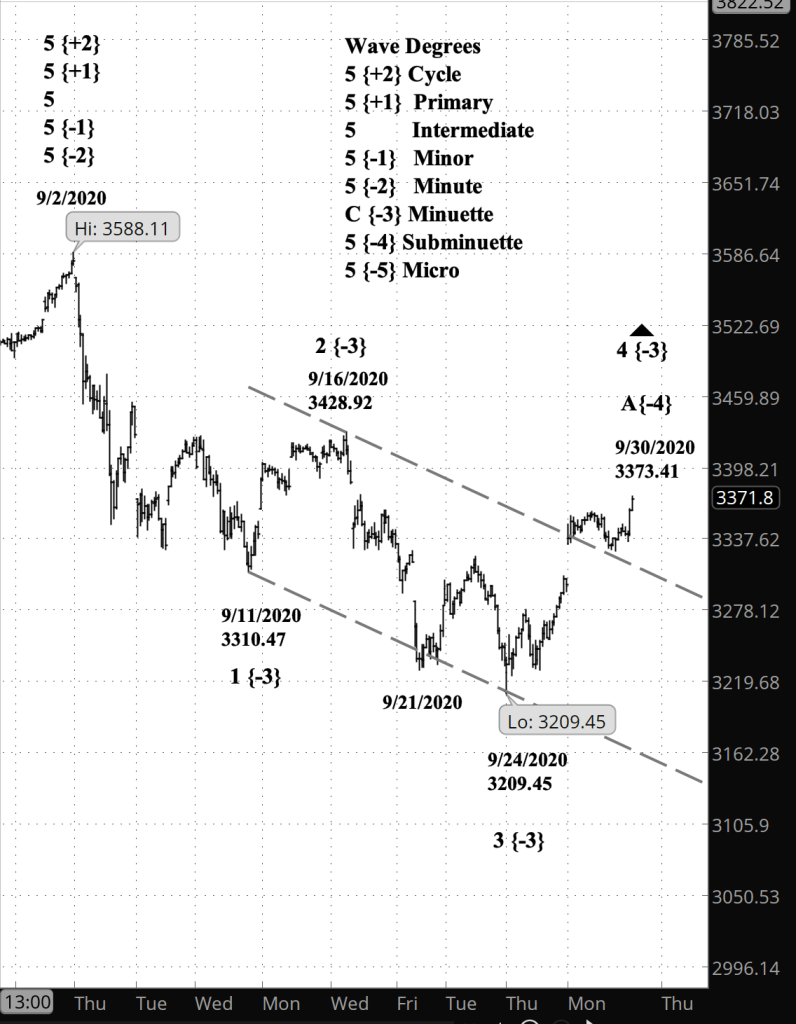
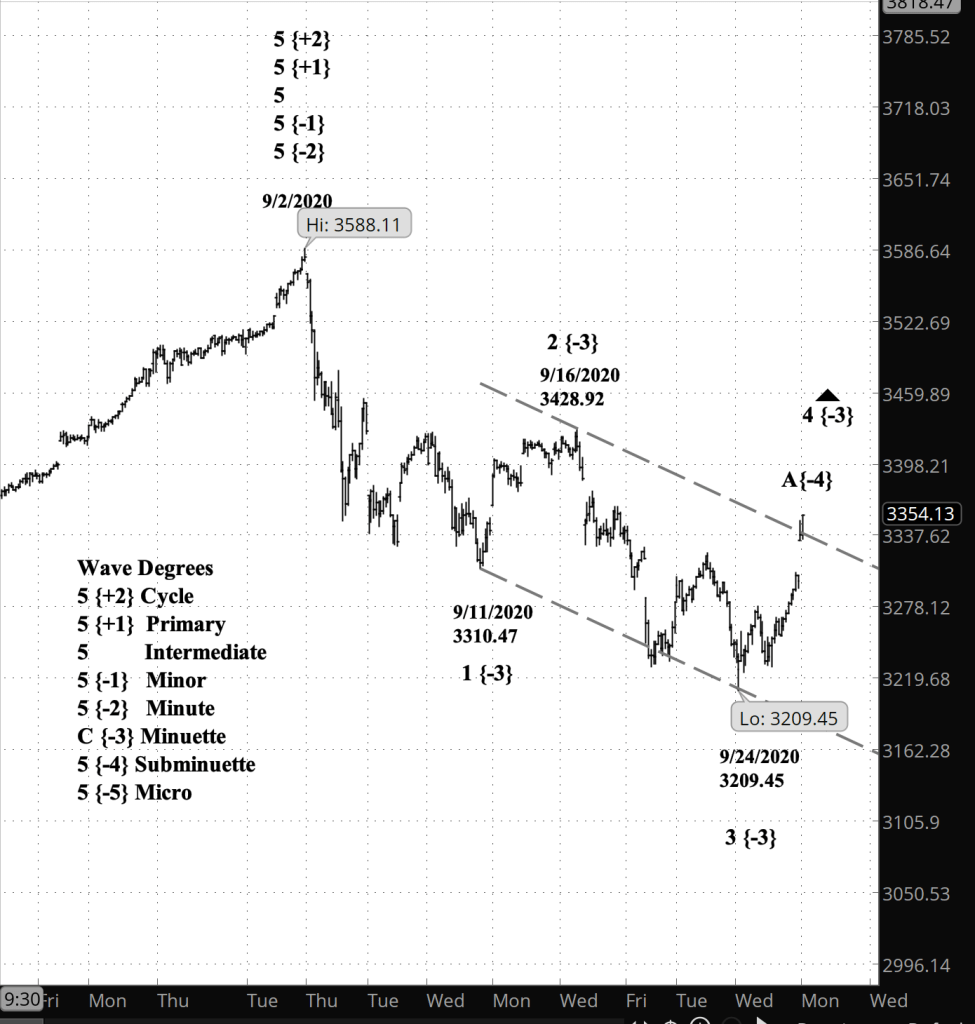
What’s happening now? The S&P 500 index has continued to rise in an upward correction within a larger-scale downtrend, remaining above the upper boundary of the price channel. The high so far is 3373.41.
What does it mean? My alternative count of yesterday turns out to be where the index is going. The move above the channel continues to suggest that the present rise is nearing its end.
What is the alternative? Yesterday’s principle count becomes today’s alternative: Today’s high could mark the end of the upward correction.
[S&P 500 index, 30-minute bars]
What does Elliott wave theory say? The rise since September 24, from 3,209.45, is wave A of Subminuette degree within wave 4 of the Minute degree, which is within wave 1 of the minute degree.
Internally, wave A now breaks into five subwaves of the Micro degree, with today’s rise being the 5th wave. The five-wave breakdown of wave A means that the parent wave 4 correction is tracing out a Zigzag pattern, a Combination, or a Triangle. If it were a Flat, then wave A would have broken down into three subwaves.
My trading strategy. A combination or a triangle will stretch out the time wave 4 will take to do its work, and that will make it difficult to catch the current entry window for an options position, which began yesterday and ends October 13. I’ll continue to hold my shares of SDS, which gain value as the S&P 500 loses value.
Note: At the opening bell I was away from my trading desk for an early morning appointment. Upon my return, I have updated the analysis and chart based on the S&P 500 index.
What’s happening now? The S&P 500 index reversed in overnight trading and broke above the upper boundary of the price channel, likely marking the start of a downward movement within an upward correction that began on September 24.
What does it mean? The downward correction within a larger scale uptrending correction means that there is another upward movement, perhaps to a higher level, to be expected in the near future.
What’s the alternative? The downward flip could be a smaller scale correction within a continuing uptrend.
[S&P 500 index, 30-minute bars]
What does Elliott wave theory say? A breakout in Elliott usually denotes a turning point and, on this chart, strengthens the case that Subminuette wave A has reached an end.
The larger upward correction is wave 4 of the Minuette degree within downtrending wave 1 of the Minor degree. The downward loop could be the beginning of wave B of Subminuette degree. Alternatively, it could be a Micro-degree correction with in an ongoing Subminuette B.
My trading strategy. Unchanged. I’m waiting for a 5th wave at Subminuette degree before considering new options positions. I’m holding my bear-oriented shares of SDS.
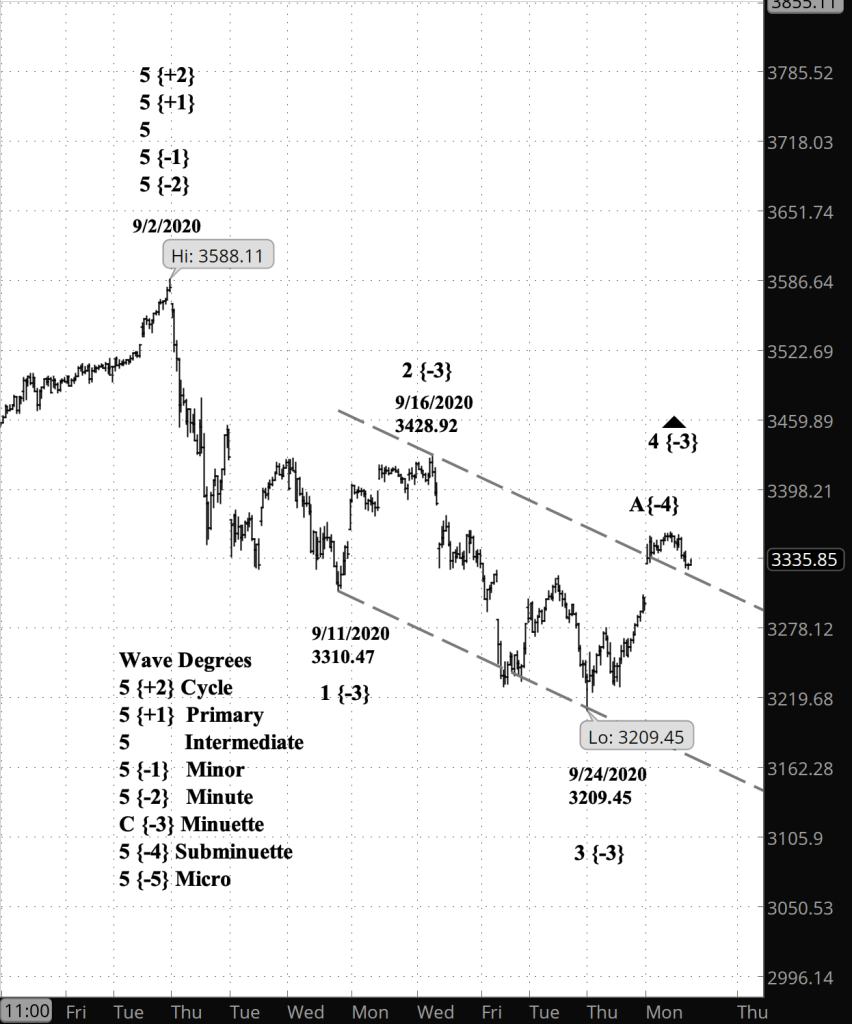
What’s happening now? The S&P 500 index rose to the upper boundary of the price channel in the second — and last — upward correction of the decline that began September 2. The high so far is 3351.92.
What does it mean? Once the correction is complete, the next move will be to a downside, with the price reaching into the 3100s.
[S&P 500 index, 30-minute bars]
What does Elliott wave theory say? The rise that began September 24, from 3209.45, is Subminuette wave A within Minuette wave 4 within Minute wave 1. The rise to the channel’s upper boundary has come in three waves, the pattern within the A wave of a Flat pattern. That accords with Elliott wave theory, which says that waves two and four tend to be different patters. Minuette wave 2 was a Zigzag, with five waves within Subminuette wave A, and Minuette wave 4 is looking like a Flat.
My trading strategy. I’m looking at IWM as my next options play, since it has a higher implied volatility rank than SPY does. Their Elliott wave counts are the same. I’ll enter once Minuette wave 4 is complete and wave 5 of that degree has begun. I’m continuing to hold my bear-profitable shares in SDS.
I’ve exited my short iron condor position on SPY for 14.8% of maximum potential profit and shall update the entry analysis with the exit info later today.
9:05 a.m. New York time
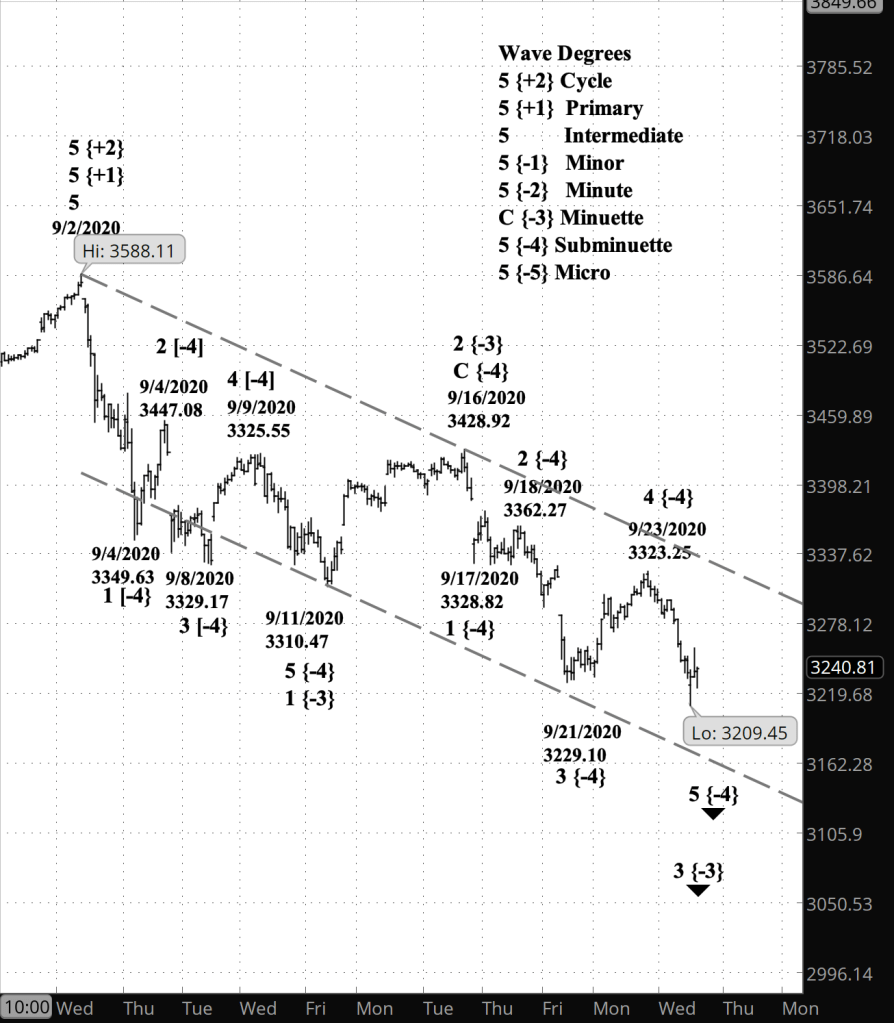
What’s happening now? The final push to the downside by the S&P 500 index, now underway, will complete the decline that began September 16, approaching the lower boundary of the price channel at around 3100.
What does it mean? The end of the decline will be the starting point of an upward correction that will carry the price toward the upper boundary of the price channel, which is presently around 3278.
What is the alternative? Another interpretation of the chart has the upward correction that began September 21 continuing, with the final push to the downside not yet having begun.
[S&P 500 index, 30-minute bars]
What does Elliott wave theory say? By my principle count, wave 5 of Subminuette degree began on September 23 from 3323.25. The 1st wave of Micro degree within Subminuette 5 perhaps ended September 24 at 3209.45, or perhaps is continuing. There are ambiguities.
By my alternative count, the September 23 high was the end of wave A of Micro degree within Subminuette wave 4, and the low of September 24 was the end of Micro B, the the Micro C wave now underway.
My trading strategy. My short iron condor position on SPY is 21 day before expiration, the day I manage profitable trades. My SPY position is profitable, at 14.8% of maximum potential profit. If my principle count is correct, then I should exit now. Any further decline will erode that profit. If my alternative count is correct, then I should hold on to the position in the expectation of further rise, which will bump up my profit by a bit. I’ll make a decision as the day progresses.
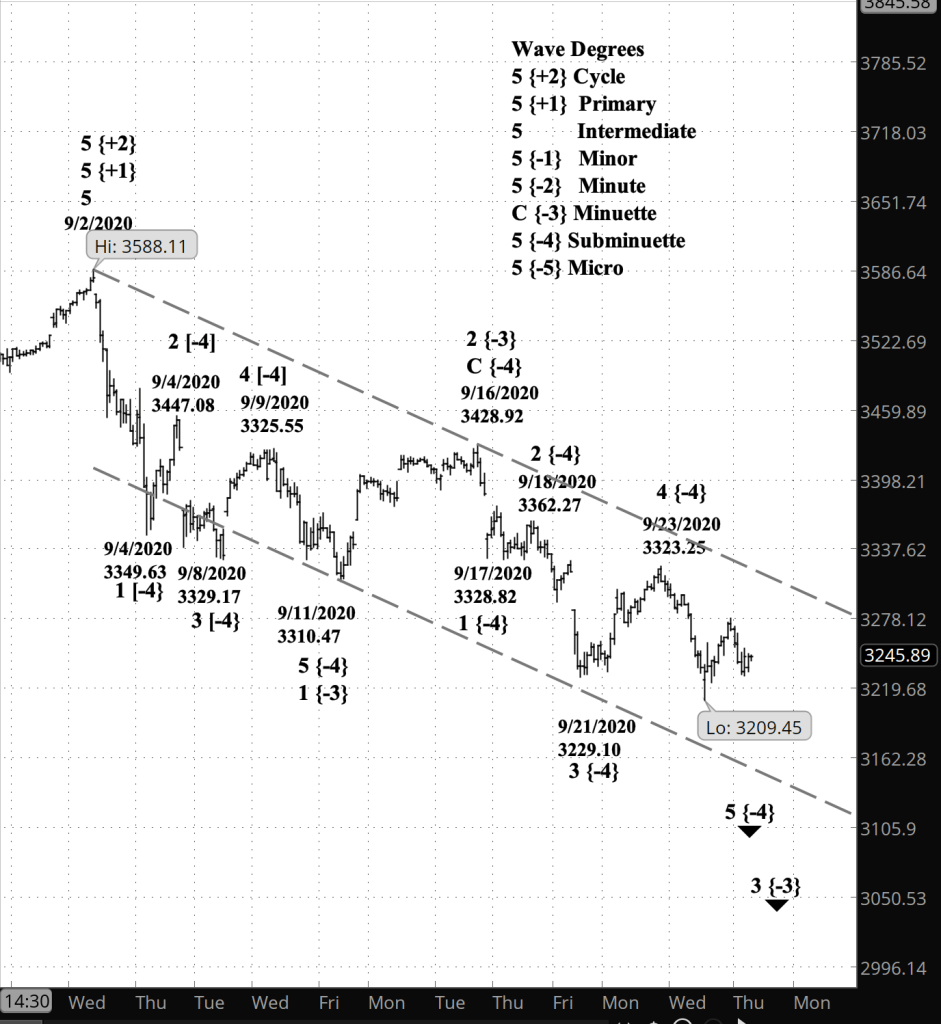
What’s happening now? The S&P 500 index reversed at 3,333.25 on September 23, completing its upside correction, and resumed its decline in the direction of the principle trend.
What does it mean? The present movement down is the final act of the decline that began on September 16. It will be followed by an upward correction that, if it has the energy, could move into the 3,500s. It will stay below 3,588.11, the peak attained on September 2.
[S&P 500 index, 30-minute bars]
What does Elliott wave theory say? Wave 4 of the Subminuette degree ended yesterday at 3333.25, and Subminuette wave 5 began. If the 5th wave reaches the lower boundary of the price channel, it will reach completion somewhere in the 3100s.
The end of Subminuette 5 also ends Minuette wave 3, which began its downward course on September 16 at 3428.92. What follows will be a corrective wave, wave 4 of Minuette degree. A 4th wave is always a different pattern than the preceding 2nd wave. Minuette wave 2 was a Zigzag, so wave 4 will be a Flat, a Triangle or a Flat Combination.
My trading strategy. My short iron condor options on SPY are trading at 8.7% of maximum potential profit. The 4th wave reversal to the upside ought to improve that. Under my rules I exit profitable positions 21 days before expiration, which would be Friday in this case. However, I shall let the Elliott wave analysis guide me in that action. So maybe Friday. I continue to hold my bearish shares of SDS.
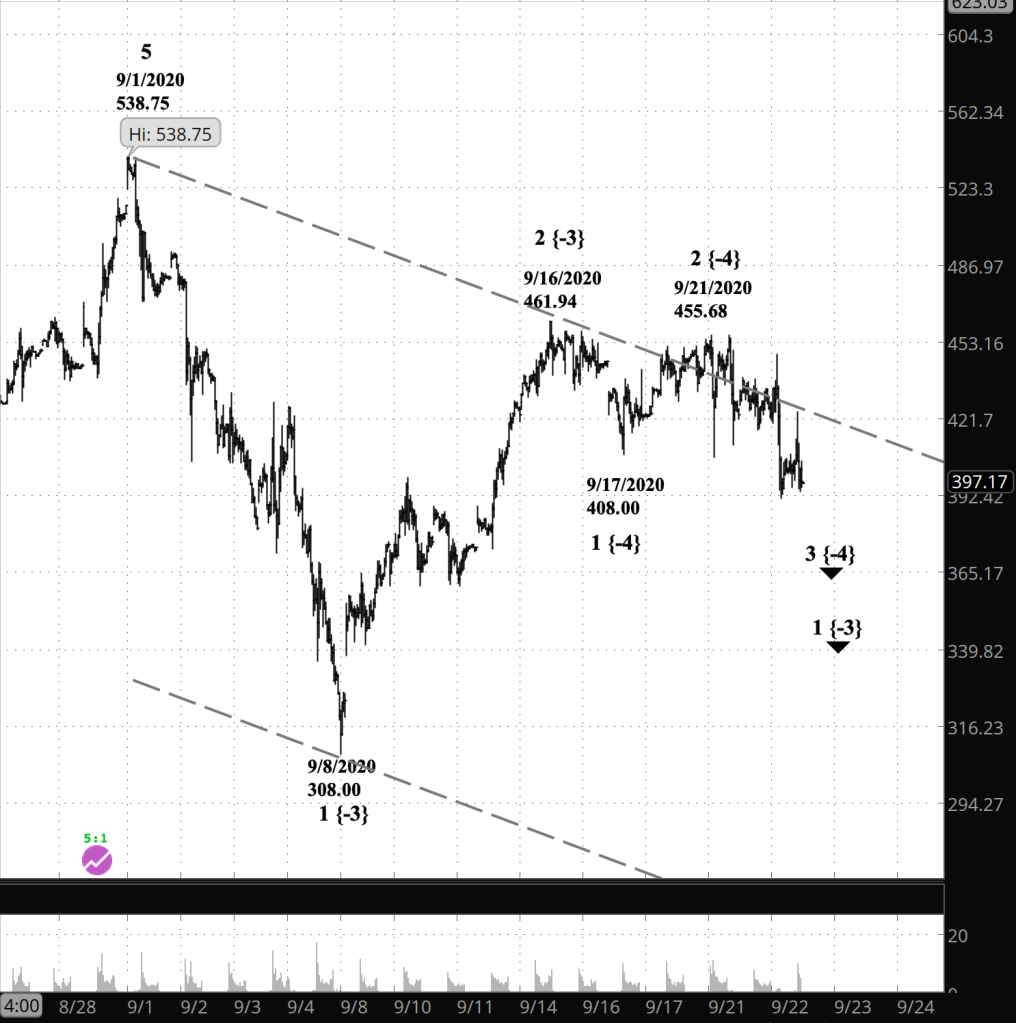
I was curious about the TSLA — news reports on its price movements tend toward the dramatic. As it turns out, when the sharp light of Elliott wave analysis is applied, TSLA is similar to other Blue Chips.
What’s happening now? By this analysis, TSLA peaked on September 1 at 538.75, and then began to decline. I have counted the decline as though it were the beginning of a major downtrend. It could just as well be a corrective pattern what is either a major downtrend, or a correction within an uptrend.
[TSLA, 30-minute bars]
What does Elliott wave analysis say? The first wave down, labelled 1 {-3}, the Minuette degree, ended on September 8 at 308.00. Internally, I count it as five waves, which is correct for a 1st wave.
However, an A wave in a Zigzag correction pattern also has five subwaves.
The second wave, labelled 2 {-3}, peaked on September 16 at 461.94. It has three subwaves — A, B and C at the Subminuette level, as we would expect for wave 2 in a downtrend.
However, a B wave in a Zigzag also has three subwaves.
If the analysis is correct, the present third wave — 3 {-3} — will play out with five subwaves as it declines. So far, I count two complete subwaves, at the Subminuette degree {-4}, with Subminuette 3 underway.
In a Zigzag, wave C also will have five subwaves.
So how do we tell the difference? Elliott wave analysis is famous for its ambiguities. But it has rules that will eventually eliminate one or the other of the possibilities.
The current wave will be followed by an upward movement. If the decline from September 1 is the beginning of a downtrend, then that upward movement will be a 2nd wave correction and will remain below the beginning of the first wave of Minuette degree, 538.75.
If early September’s decline was a correction within an ongoing uptrend, then the price will move above 538.75 and the shorts will have a very bad day.
On the larger TSLA chart, I count five waves up from June 3, 2019, when the stock sold for 35.40, so my best conclusion is that TSLA has begun a significant downtrend.
I’m not planning to trade TSLA options today. If I were, it would be a short bear call spread or short iron condor, the latter hedge reflecting TSLA’s tendency toward large and sudden moves.
By Tim Bovee, Portland, Oregon, December 31, 2020
Disclaimer
Tim Bovee, Private Trader tracks the analysis and trades of a private trader for his own accounts. Nothing in this blog constitutes a recommendation to buy or sell stocks, options or any other financial instrument. The only purpose of this blog is to provide education and entertainment.
No trader is ever 100 percent successful in his or her trades. Trading in the stock and option markets is risky and uncertain. Each trader must make trading decisions for his or her own account, and take responsibility for the consequences.
Tim Bovee, Private Trader tracks the analysis and trades of a private trader for his own accounts. Nothing in this blog constitutes a recommendation to buy or sell stocks, options or any other financial instrument. The only purpose of this blog is to provide education and entertainment.
No trader is ever 100 percent successful in his or her trades. Trading in the stock and option markets is risky and uncertain. Each trader must make trading decisions for his or her own account, and take responsibility for the consequences.
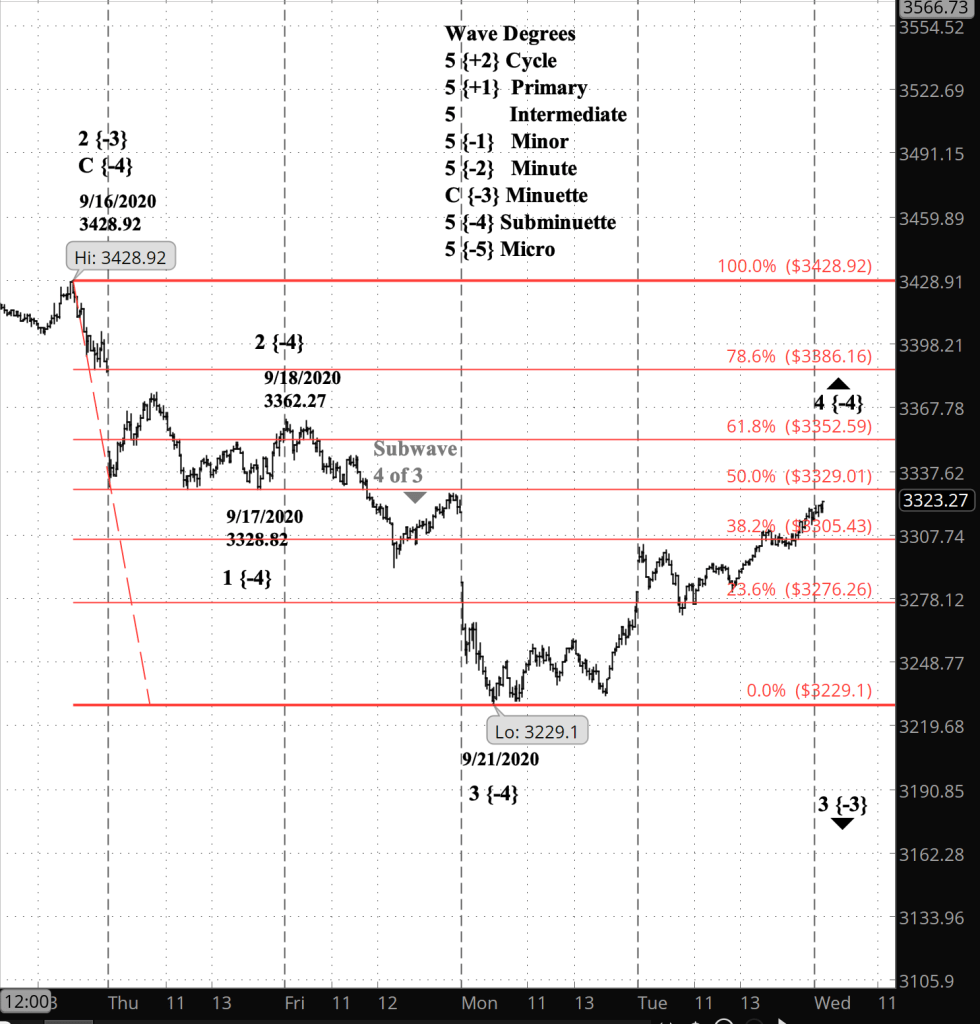
What’s happening now? The S&P 500 index continues to work its way through an upward correction of the principle downtrend. So far the price has retraced almost 50% of the 199.82 point decline from September 16 to September 22.
What does it mean? The shallowness of the correction so far suggests a greater likelihood that it will be a sideways movement rather than a strong push toward the September 16 high.
[S&P 500 index, 5-minute bars]
What does Elliott wave theory say? The Subminuette 4th wave correction that began September 21 appear to be taking the form of a Flat, a form of correction that is shallower than the Zigzag seen in Subminuette 2. A 4th wave often ends within the 4th wave of Minor degree within the preceding 3rd wave of Subminuette degree — subwave 4 of 3. That subwave began and ended on September 18, with the price starting at 3,292.40 and ending at 3,327.30. The Subminuette 4th wave correction has so far reached a high of 3,321.85, which is within subwave 4 of 3, and if this correction behaves typically, it won’t rise above 3,327.30.
My trading strategy. My short iron condor options on SPY are at 28.2% of maximum potential profit, and if the position remains profitable, I shall exit on Friday, 21 days before expiration. I continue to hold my shares in SDS, the inverse S&P 500 fund.



You must be logged in to post a comment.