3:30 p.m. New York time
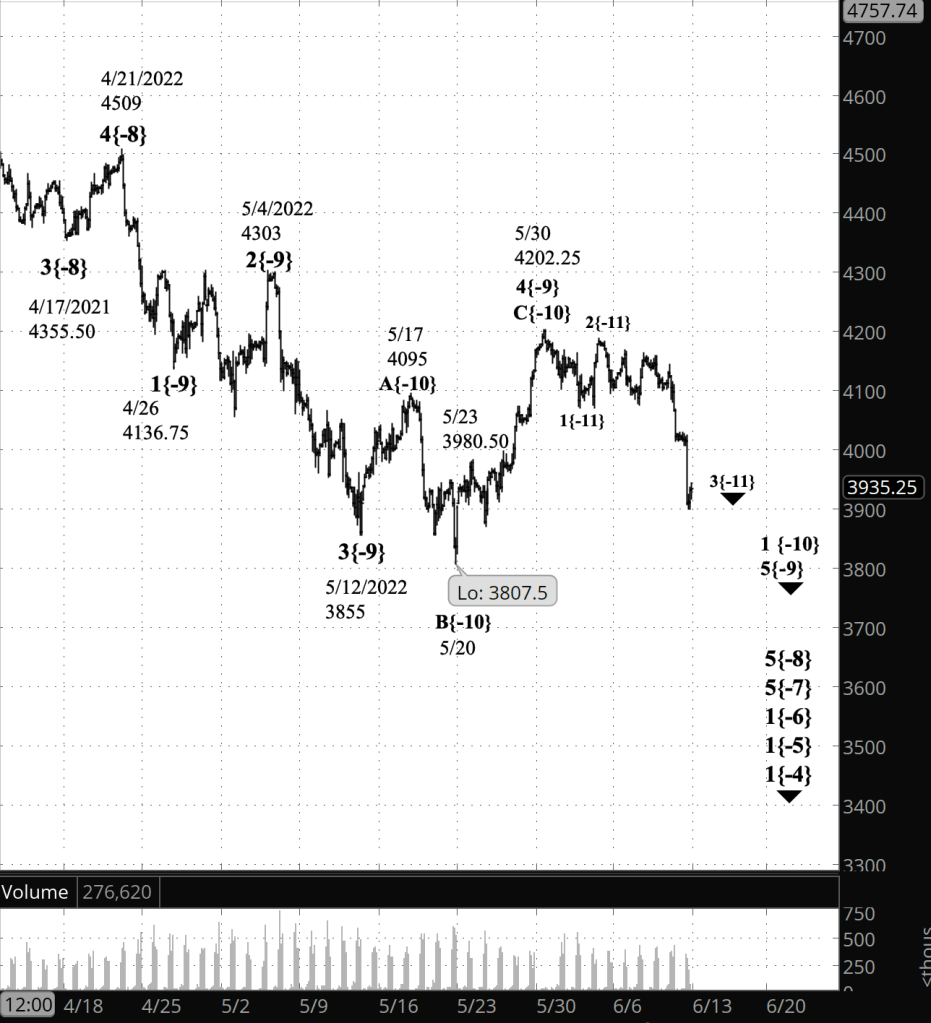
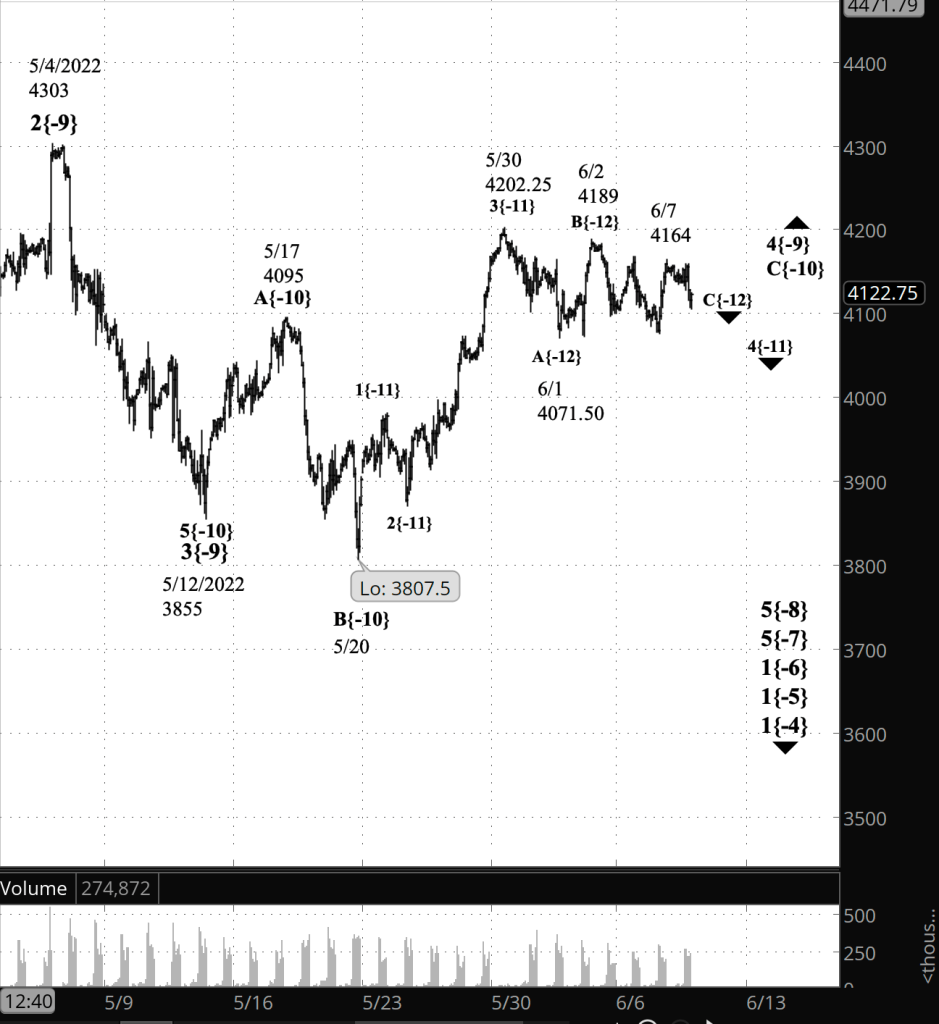
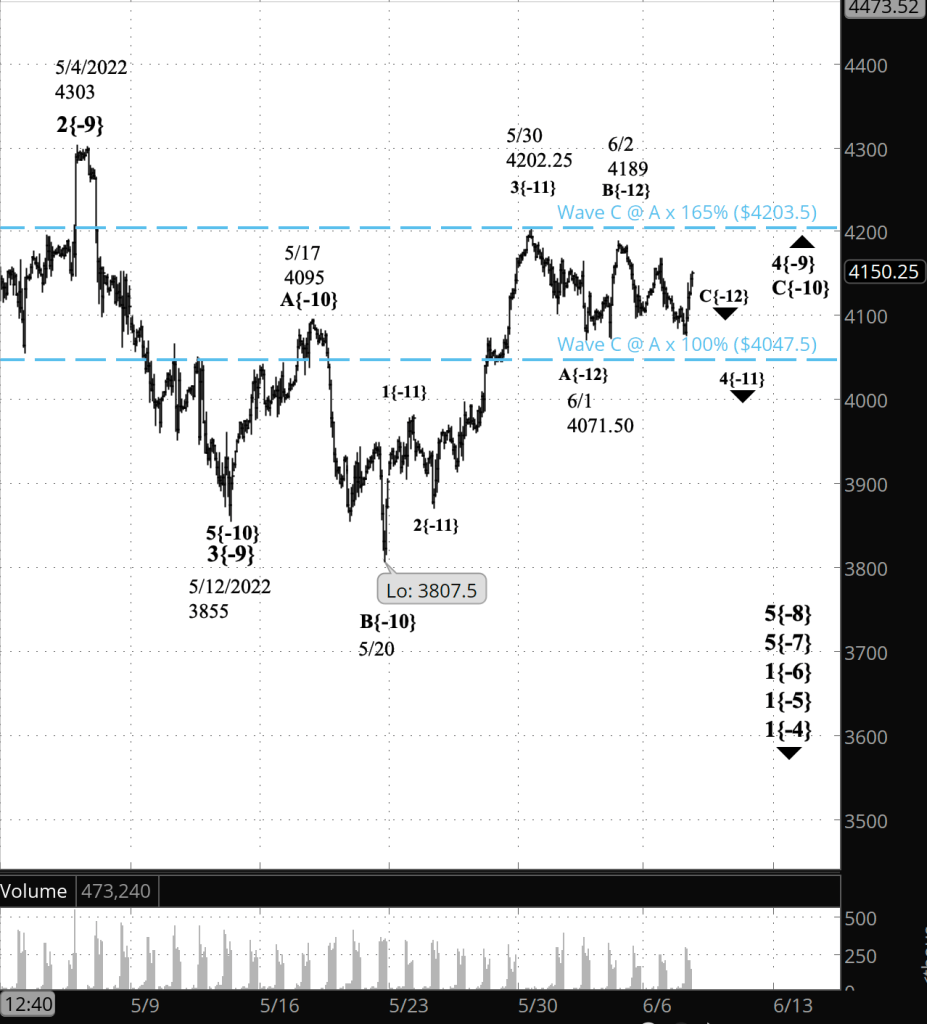
Half an hour before the closing bell. The S&P 500 has traded has within a small range during the session, the futures covering a bit more than 100 points between the low 3800s and the low 3700s. The price has stayed above yesterday’s low, 3708.50. No change in the analysis. I’ve updated the chart.
9:35 a.m. New York time
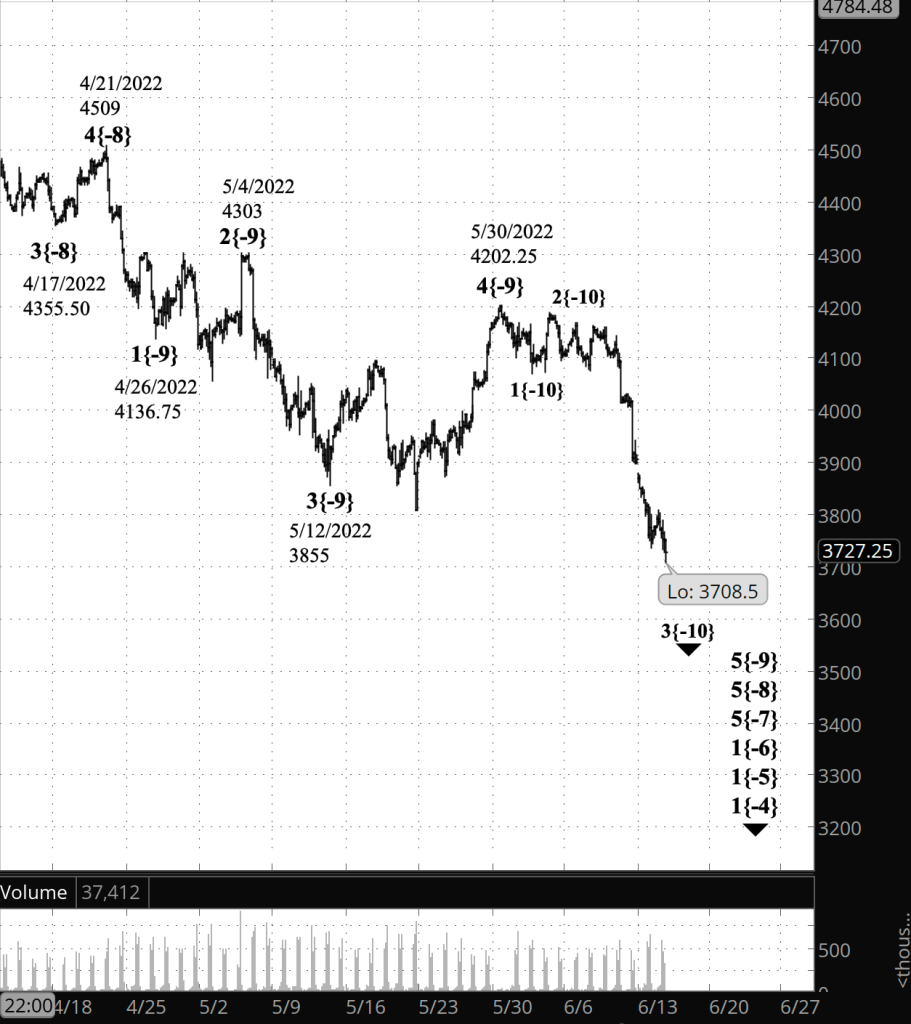
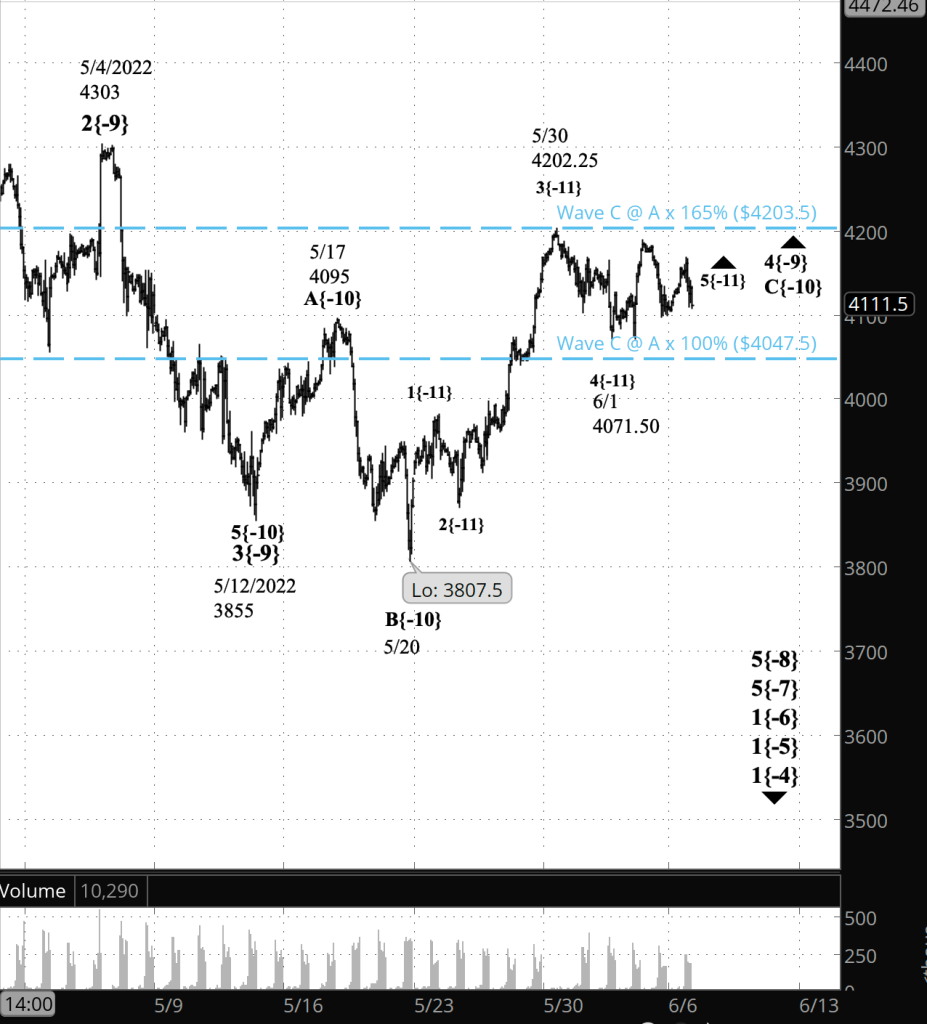
What’s happening now? The S&P 500 E-mini futures rose back into the high 3700s in overnight trading.
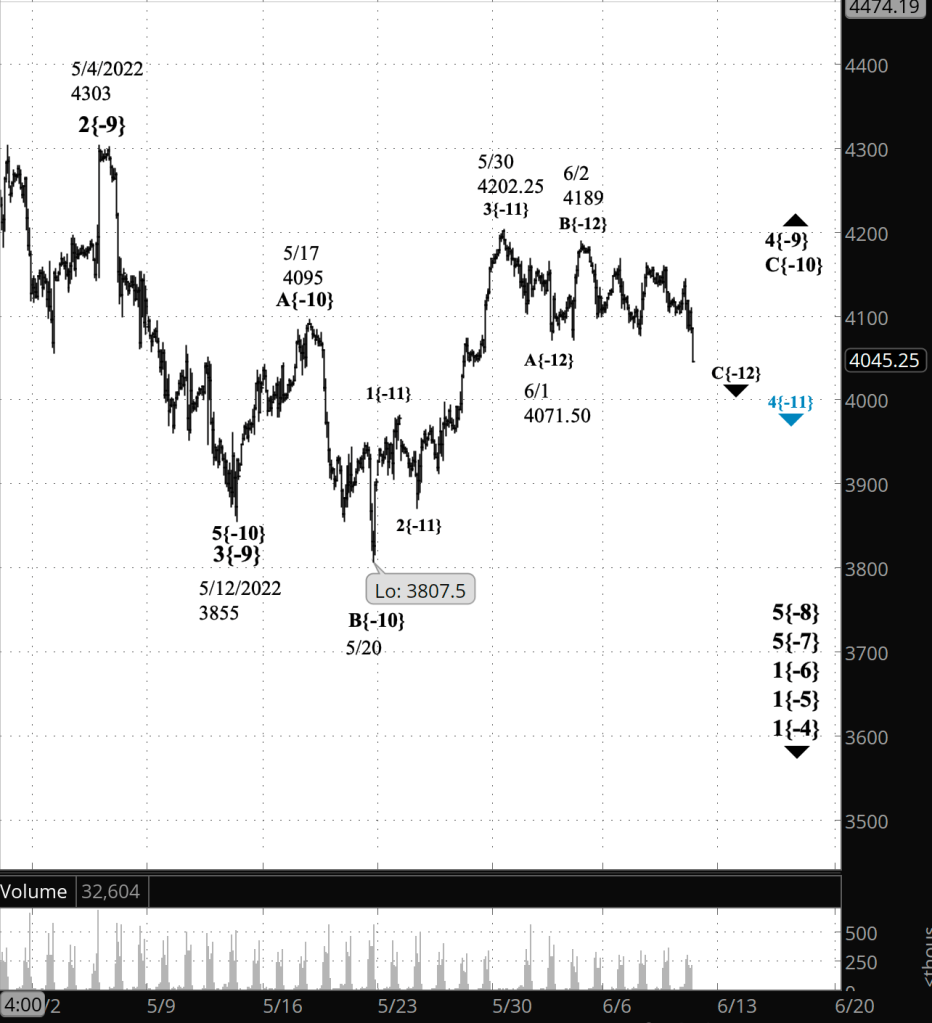
What does it mean? The rise was a low-level correction within the larger downtrend that began on May 30, within a series of downtrends of increasing size. See yesterday’s Trader’s Notebook for a description of the larger movements defining this market.
What are the alternatives? Any pause in the decline potentially marks the end of a segment within the larger downtrend and the beginning of an upward correction. See the Elliott wave theory section, below, for a discussion.
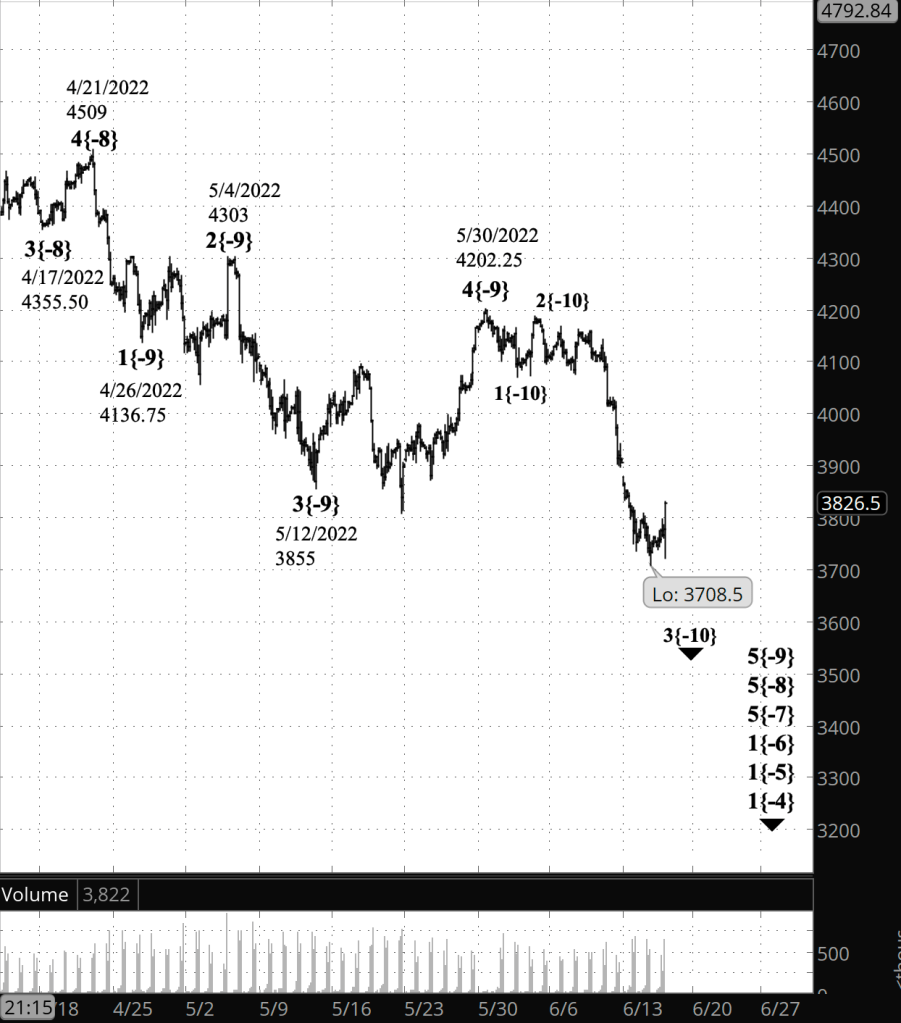
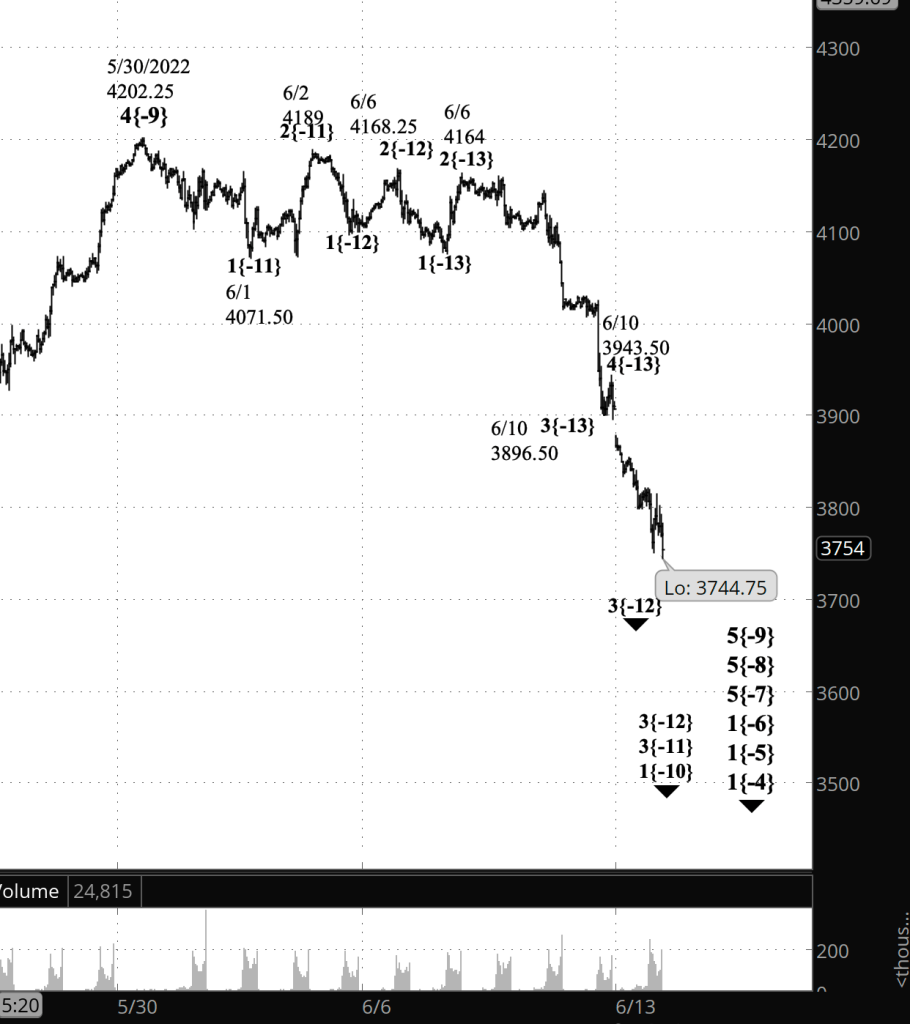
What does Elliott wave theory say? Wave 3{-10}, now underway, is the middle segment of wave 5{-9}, the downtrend that began on May 30 from 4202.25.
The power of the wave 3{-10} decline is such that the wave count internally has ambiguities. It’s possible that any pause, such as the one overnight, marks a transition to wave 4{-10}, an upward correction, and then perhaps a decline, wave 5{-10}, whose completion will mark the end of wave 4{-9}. I intend to retain the present analysis until there’s a clear sign that wave 4{-10} has begun.
The Federal Open Market Committee issues its money policy statement today at 2 p.m. New York time, which may create a disturbance on the chart. Nonetheless, the rules of Elliott wave analysis will remain in place, and the wave count will need to follow those rules in accounting for traders’ responses to the FOMC’s decisions.
We Are Here.
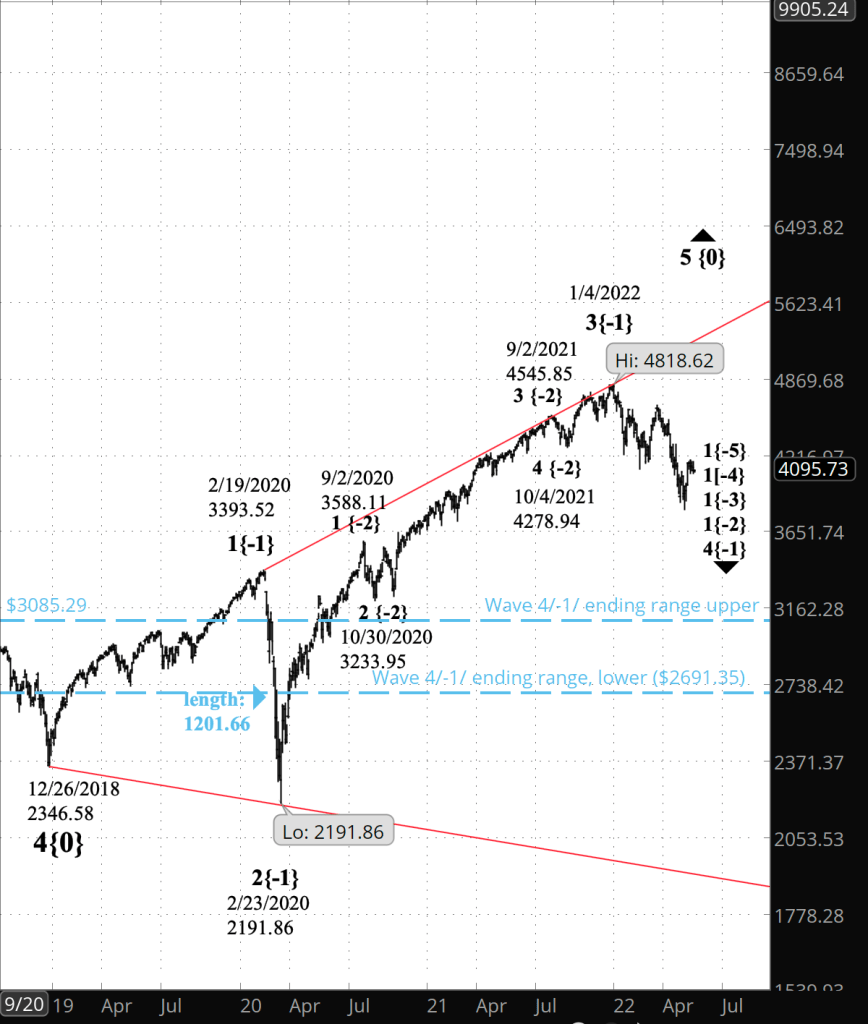
These are the waves currently in progress under my principal analysis. Each line on the list shows the wave number, with the subscript in curly brackets, the traditional degree name, the starting date, the starting price of the S&P 500 E-mini futures, and the direction of the wave.
- S&P 500 Index:
- 5{+3} Supercycle, 7/8/1932, 4.40 (up)
- 5{+2} Cycle, 12/9/1974, 60.96 (up)
- 5{+1} Primary, 3/6/2009, 666.79 (up)
- 5{0} Intermediate, 12/26/2018, 2346.58 (up)
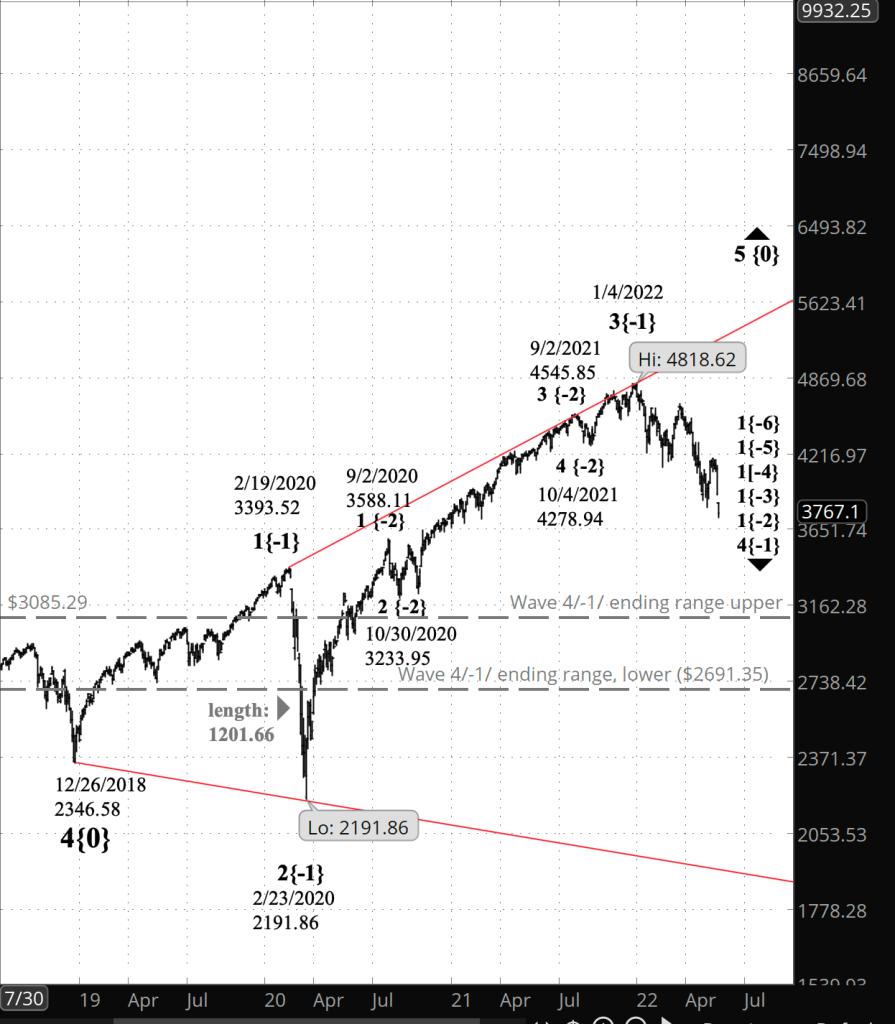
- 4{-1} Minor, 1/4/2022 4818.62 (down)
- 1{-2} Minute, 1/4/2022 4818.62 (down)
- S&P 500 Futures and index:
- 1{-3} Minuette, 1/4/2022, 4808.25 (down) (futures), 4818.62 (down) (index)
- S&P 500 Futures:
- 1{-4} Subminuette, 1/4/2022, 4808.25 (down)
- 1{-5} Micro, 1/4/2022, 4808.25 (down)
- 1{-6} Submicro, 1/4/2022, 4808.25 (down)
- 5{-7} Minuscule, 3/29/2022, 4631 (down)
- 5{-8} Subminuscule, 4/21/2022, 4509, (down)
Learning and other resources. Elliott wave analysis provides context, not prophecy. As the 20th century semanticist Alfred Korzybski put it in his book Science and Sanity (1933), “The map is not the territory … The only usefulness of a map depends on similarity of structure between the empirical world and the map.” And I would add, in the ever-changing markets, we can judge that similarity of structure only after the fact.
See the menu page Analytical Methods for a rundown on where to go for information on Elliott wave analysis.
By Tim Bovee, Portland, Oregon, June 15, 2022
Disclaimer
Tim Bovee, Private Trader tracks the analysis and trades of a private trader for his own accounts. Nothing in this blog constitutes a recommendation to buy or sell stocks, options or any other financial instrument. The only purpose of this blog is to provide education and entertainment.
No trader is ever 100 percent successful in his or her trades. Trading in the stock and option markets is risky and uncertain. Each trader must make trading decisions for his or her own account, and take responsibility for the consequences.
License
All content on Tim Bovee, Private Trader by Timothy K. Bovee is licensed under a Creative Commons Attribution-ShareAlike 4.0 International License.
Based on a work at www.timbovee.com.

You must be logged in to post a comment.