Trader’s Notebook

3:30 p.m. New York time

Half an hour before the closing bell. The S&P 500 fell during the session, reaching a low on the futures of 4444.50 in afternoon trading. From that point the price rose by a bit more than 50 points.

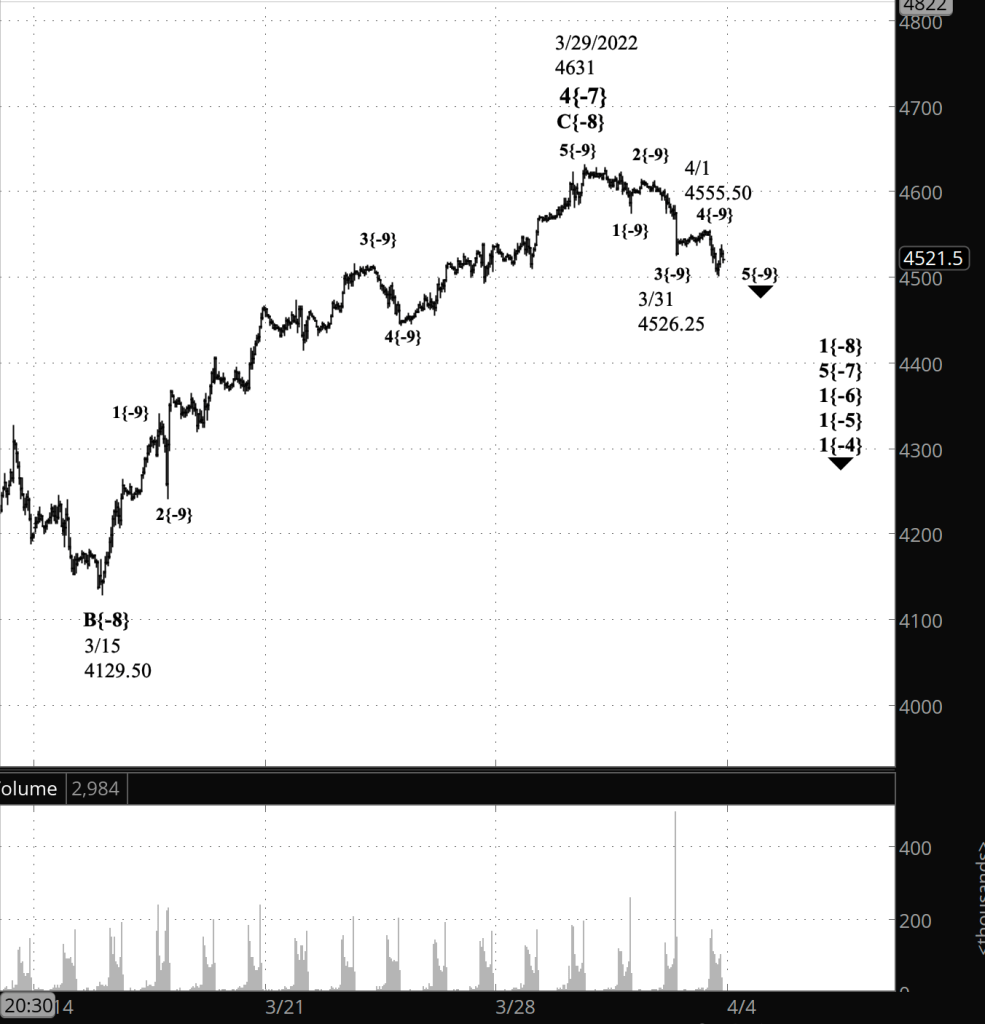
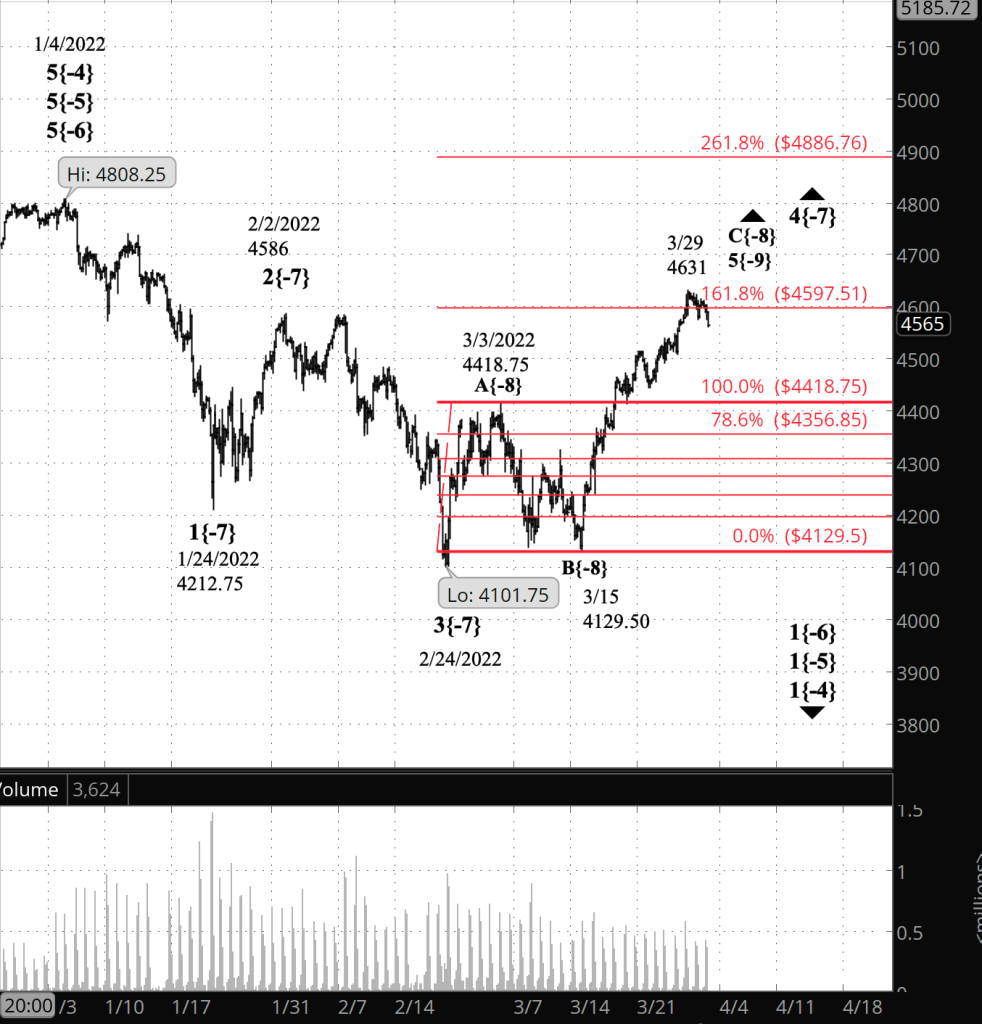
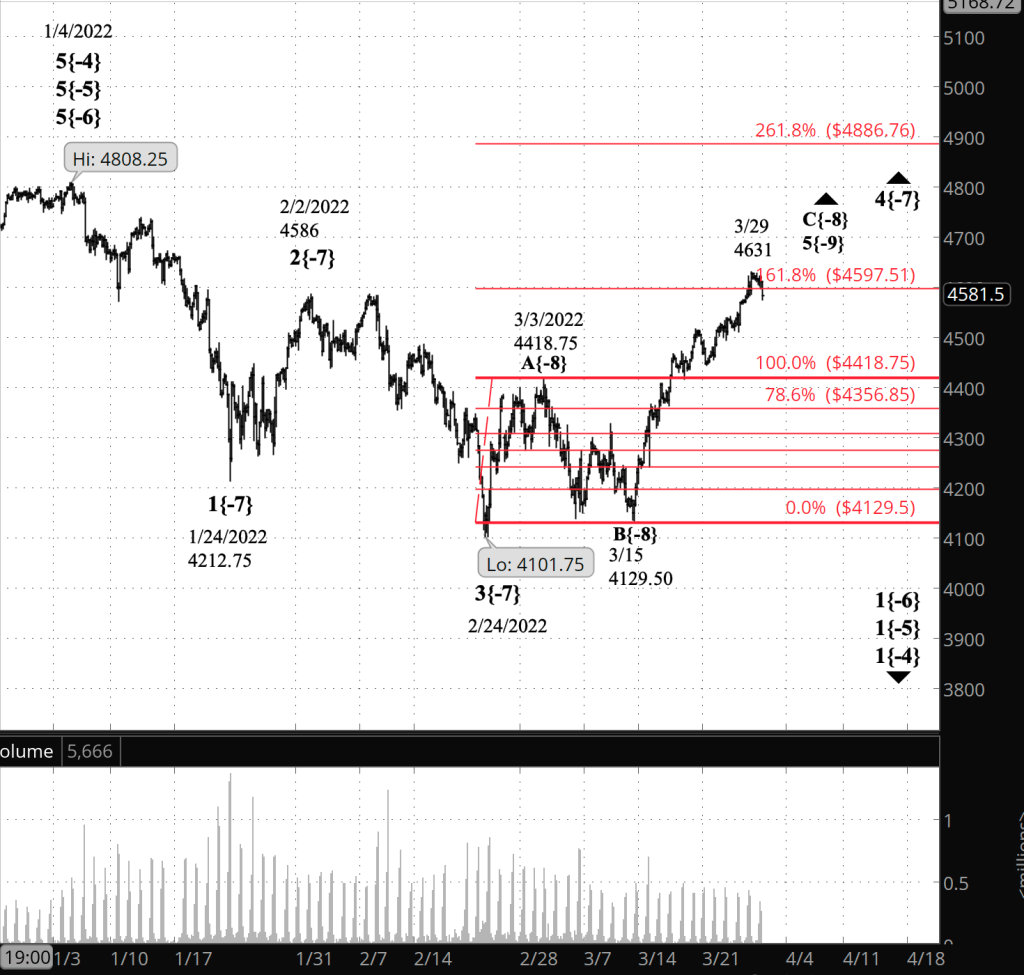
The downtrend that began on April 5, wave 3{-8} continues. No change in the analysis. I’ve updated the chart.

10:10 a.m. New York time

LW earnings play entry. I’ve entered a bear call vertical spread on LW, using the options that expire May 20, and have posted an analysis of the trade.

9:35 a.m. New York time

What’s happening now? The S&P 500 E-mini futures fell in overnight trading, reaching below 4501.25, the starting point of the upward correction that began on April 1 into the 4470s.

What does it mean? The correction ended at 4588.75, the April 5 high, and the downtrend that began on March 29 from 4631 has resumed.

What’s the alternative? I have none at this point. In falling below 4501.25, the chart pattern gave a clear signal that the downtrend has resumed. More about that in the Elliott wave theory section below.

[S&P 500 E-mini futures at 3:30 p.m., 150-minute bars, with volume]

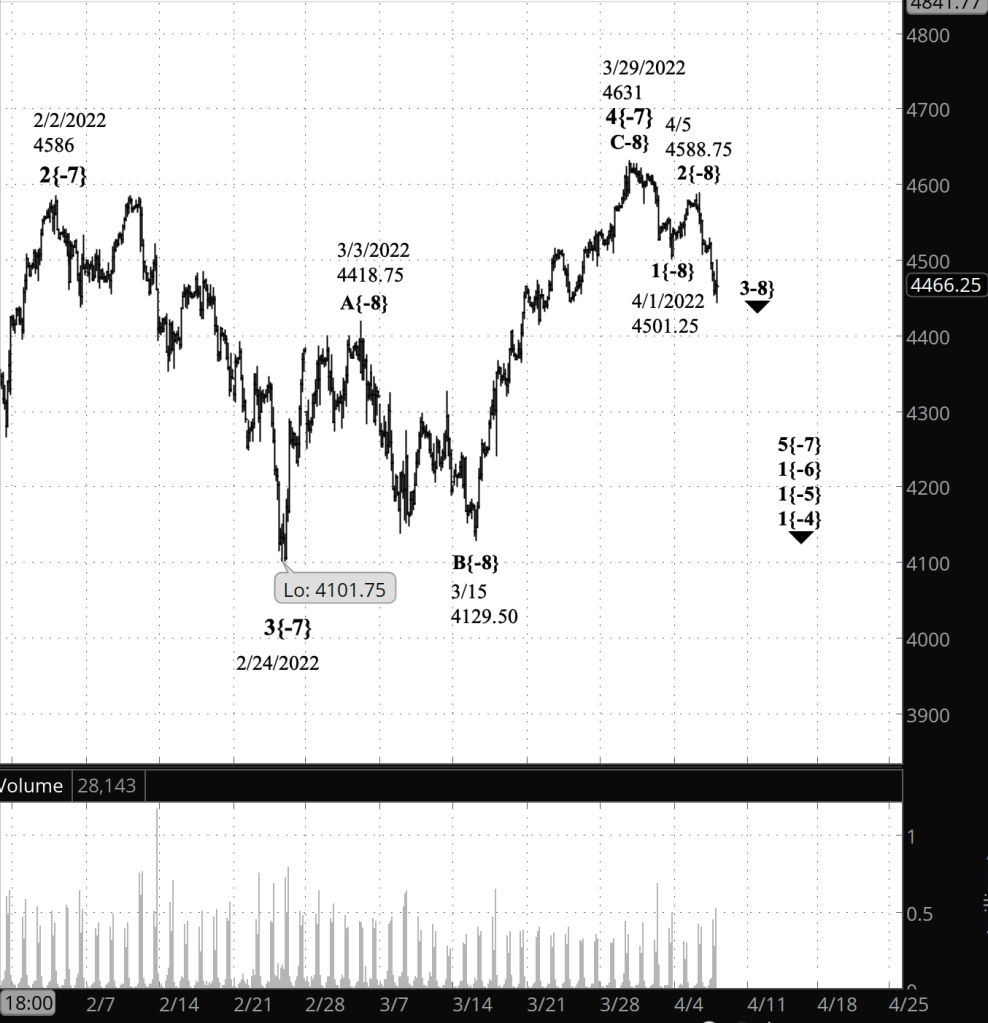
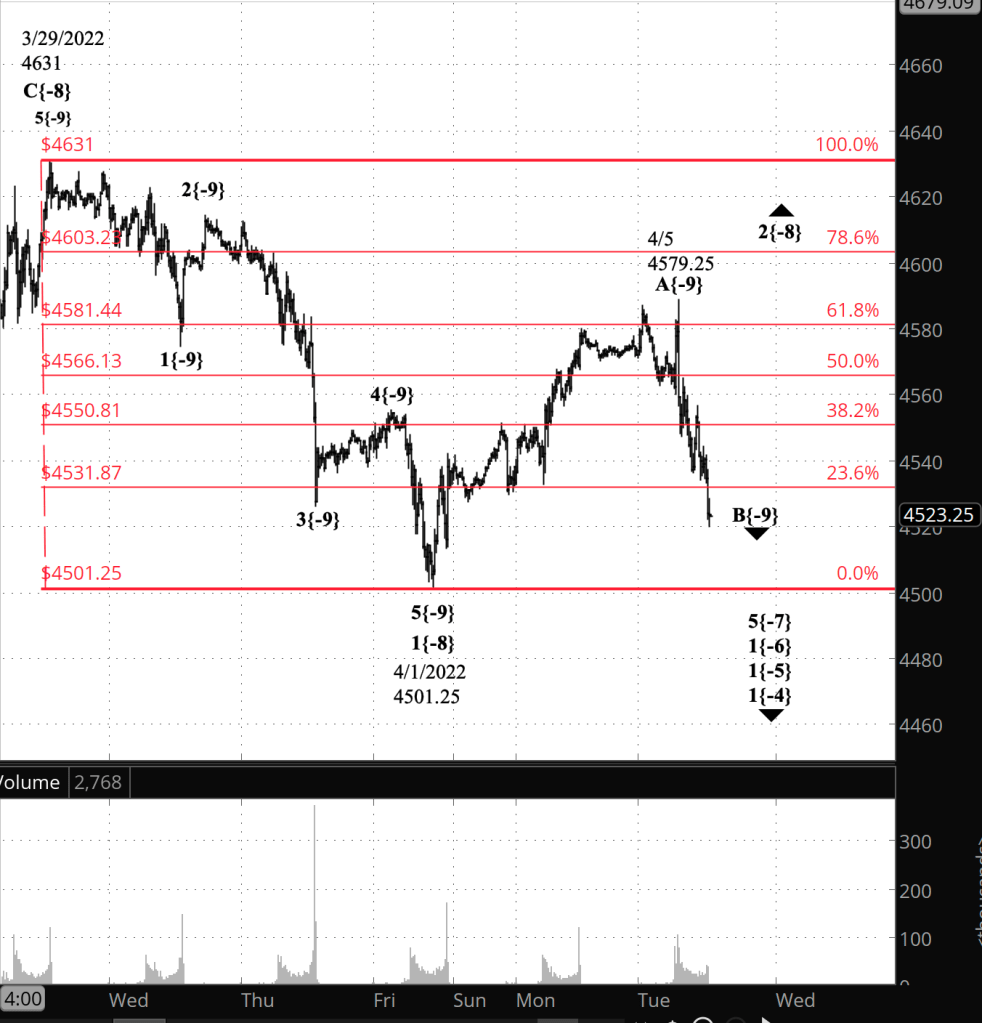
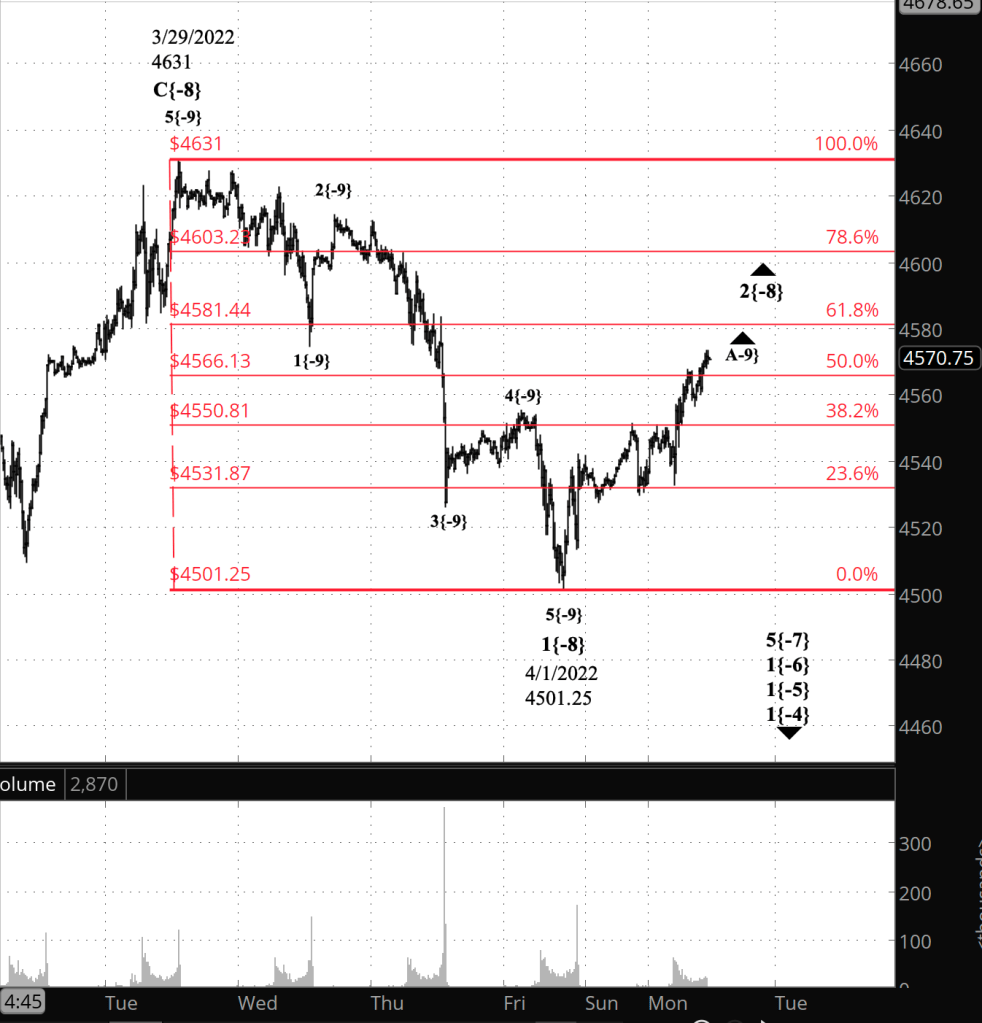
What does Elliott wave theory say? The correction that ended on April 5 at 4588.75 was wave 2{-8}. Yesterday’s analysis considered that peak to be the end of wave A{-9} within wave 2{-8} and the decline that followed to be wave B{-9}. However, when the price fell below the starting point of the preceding 1st wave — 4501.25 — it had done something that no 2nd wave can do under the rules discovered by R.N. Elliott. When a wave breaks a rule in Elliott wave analysis, it doesn’t mean the wave is a rule-breaker. It means the analysis no longer matches the reality on the chart. And such is the case here. The fall below the start of wave 1{-8} can only mean that wave 2{-8} ended on April 5, and the decline that followed is wave 3{-8}.

Third waves are powerhouses. They’re generally the longest and most energetic wave of the five-wave set that makes up a trend. Wave 1{-8} was 129.75 points long. It wouldn’t be surprising if wave 3{-8} were double that in length, at a minimum. If it does turn to be twice as long, the the price will reach down into the low 4300s, and I wouldn’t be shocked if it dropped further. However, the only rule that governs the length of 3rd waves is that they can’t be the shorter than both waves 1 and 5 in the same set. It’s certainly possible that a 3rd wave can be shorter than the preceding 1st wave, and the 5th wave that follows is shorter than the 3rd.

We Are Here.

These are the waves currently in progress under my principal analysis. Each line on the list shows the wave number, with the subscript in curly brackets, the traditional degree name, the starting date, the starting price of the S&P 500 E-mini futures, and the direction of the wave.

  • Index:
  • 5{0} Intermediate, 12/26/2018, 2346.58 (up)
  • 4{-1} Minor, 1/4/2022 4818.62 (down)
  • 1{-2} Minute, 1/4/2022 4818.62 (down)
  • Futures and index:
  • 1{-3} Minuette, 1/4/2022, 4808.25 (down) (futures), 4818.62 (down) (index)
  • Futures:
  • 1{-4} Subminuette, 1/4/2022, 4808.25 (down)
  • 1{-5} Micro, 1/4/2022, 4808.25 (down)
  • 1{-6} Submicro, 1/4/2022, 4808.25 (down)
  • 5{-7} Minuscule, 3/31/2022, 4631 (down)
  • 3{-8} Subminuscule, 4/5/2022, 4588.75 (down)

Learning and other resources. Elliott wave analysis provides context, not prophecy. As the 20th century semanticist Alfred Korzybski put it in his book Science and Sanity (1933), “The map is not the territory … The only usefulness of a map depends on similarity of structure between the empirical world and the map.” And I would add, in the ever-changing markets, we can judge that similarity of structure only after the fact.

See the menu page Analytical Methods for a rundown on where to go for information on Elliott wave analysis.

By Tim Bovee, Portland, Oregon, April 6, 2022

Disclaimer

Tim Bovee, Private Trader tracks the analysis and trades of a private trader for his own accounts. Nothing in this blog constitutes a recommendation to buy or sell stocks, options or any other financial instrument. The only purpose of this blog is to provide education and entertainment.

No trader is ever 100 percent successful in his or her trades. Trading in the stock and option markets is risky and uncertain. Each trader must make trading decisions for his or her own account, and take responsibility for the consequences.

License
Creative Commons License

All content on Tim Bovee, Private Trader by Timothy K. Bovee is licensed under a Creative Commons Attribution-ShareAlike 4.0 International License.

Based on a work at www.timbovee.com.

Trader’s Notebook

3:30 p.m. New York time

Half hour before the closing bell. The S&P 500 futures whipsawed today, poking above the 61.8% Fibonacci retracement level in overnight trading, doing it again during the session, reaching a single point higher. It then reversed, scrambling down through the 50% and 38.2% Fibonacci levels before pausing at the 23.6% retracement level and then falling slightly below it. it was something of a roller-coaster ride.

Elliott wave analysis sees it this way: The declining middle wave of a three-wave upward correction, wave B{-9} within wave 2{-8}, is now underway and may be close to reaching its end as it approaches the beginning of the preceding A wave, 4501.25. It will be followed by a possible final wave, C{-9} to the upside, that will likely rise above today’s peak, 4579.25.

I say “possible” final wave because the correction could extend into a compound structure, adding a second corrective pattern and even a third. I haven’t seen many compound corrections in 2nd waves; they’re more common in 4th wave corrections. But we shall see if this 2nd wave is an outlier.

I’ve updated the chart.

12:55 p.m. New York time

Another analysis change. And having reached a new peak during the session, 4579.25, the S&P 500 futures price reversed sharply to the downside. The reversal re-instates this mornings initial principal analysis: Wave A{-9} has ended and wave B{-9} is underway, all within an upward correction, wave 4{-8}. I’ve updated the chart again.

11 a.m. New York time

Analysis change. The S&P 500 futures price has moved above the overnight high by a point. This promotes the alternative analysis to the prime analysis. Wave A{-9}, the middle leg of the upward correction, is still underway, as is its parent, wave 2{-8}. The rest of the analysis is unchanged. I’ve updated the chart.

9:35 a.m. New York time

What’s happening now? In overnight trading, the S&P 500 E-mini futures broke above a 60% retracement of the decline that began on March 29. It then quickly dove back to the 50% retracement level.

What does it mean? The overnight peak marked the end of the first portion of the upward correction that began on April 1, and the middle portion has begun. It will carry the price a distance down toward 4501.25, where the correction began. The final wave will return to the overnight high, 4587.25, and most likely rise above it.

What’s the alternative? The first portion of the correction could still be underway. The lower the price declines, the less likely this scenario is.

[S&P 500 E-mini futures at 3:30 p.m., 15-minute bars, with volume]

What does Elliott wave theory say? The upward correction is wave 2{-8} with within a larger downtrend, wave 1{-7}, which began on January 4. Within the correction, rising wave A{-9} was completed in overnight trading, and declining wave B{-9} has begun. A rising third wave, C{-9}, will complete the corrective pattern, and most likely, the parent wave, 2{-8}. The correction will be followed by a resumption of the downtrend, wave 3{-8}, which will carry the price below the end of the preceding 1st wave, 4501.25, perhaps significantly below that level.

We Are Here.

These are the waves currently in progress under my principal analysis. Each line on the list shows the wave number, with the subscript in curly brackets, the traditional degree name, the starting date, the starting price of the S&P 500 E-mini futures, and the direction of the wave.

  • Index:
  • 5{0} Intermediate, 12/26/2018, 2346.58 (up)
  • 4{-1} Minor, 1/4/2022 4818.62 (down)
  • 1{-2} Minute, 1/4/2022 4818.62 (down)
  • Futures and index:
  • 1{-3} Minuette, 1/4/2022, 4808.25 (down) (futures), 4818.62 (down) (index)
  • Futures:
  • 1{-4} Subminuette, 1/4/2022, 4808.25 (down)
  • 1{-5} Micro, 1/4/2022, 4808.25 (down)
  • 1{-6} Submicro, 1/4/2022, 4808.25 (down)
  • 5{-7} Minuscule, 3/31/2022, 4631 (down)
  • 2{-8} Subminuscule, 4/1/2022, 4501.25 (up)

Learning and other resources. Elliott wave analysis provides context, not prophecy. As the 20th century semanticist Alfred Korzybski put it in his book Science and Sanity (1933), “The map is not the territory … The only usefulness of a map depends on similarity of structure between the empirical world and the map.” And I would add, in the ever-changing markets, we can judge that similarity of structure only after the fact.

See the menu page Analytical Methods for a rundown on where to go for information on Elliott wave analysis.

By Tim Bovee, Portland, Oregon, April 5, 2022

Disclaimer

Tim Bovee, Private Trader tracks the analysis and trades of a private trader for his own accounts. Nothing in this blog constitutes a recommendation to buy or sell stocks, options or any other financial instrument. The only purpose of this blog is to provide education and entertainment.

No trader is ever 100 percent successful in his or her trades. Trading in the stock and option markets is risky and uncertain. Each trader must make trading decisions for his or her own account, and take responsibility for the consequences.

License
Creative Commons License

All content on Tim Bovee, Private Trader by Timothy K. Bovee is licensed under a Creative Commons Attribution-ShareAlike 4.0 International License.

Based on a work at www.timbovee.com.

Trader’s Notebook

3:30 p.m. New York time

Half an hour before the closing bell. The S&P 500 E-mini futures continued to rise during the session, so far retracing more than 50% of the decline that began on March 29. An upward correction, wave 2{-8}, is now underway, and it is in its first subwave, A{-9}. The present rise will be followed by wave B{-9}, which will carry the price down toward the starting point of the correction, 4101.25, and then by wave C{-9}, which will carry the price up again.

I’ve updated the chart, bringing it closer to better see the progress of wave 2{-8} in relation to wave 1{-8} and have superimposed a Fibonacci retracement ladder. No change in the analysis.

9:35 a.m. New York time

What’s happening now? The S&P 500 E-mini futures continued their gentle rise after trading resumed overnight.

What does it mean? The downtrend that began on March 29 has completed an initial decline, lasting three days, and has begun an upward correction.

What is the alternative? It’s possible that the correction is of a smaller degree than I have marked on the chart. If that turns to be the case, then the initial decline is still underway and will be followed by a potentially larger correction to the upside.

[S&P 500 E-mini futures at 3:30 p.m., 15-minute bars, with volume]

What does Elliott wave theory say? The downtrend that began on March 29 from 4631 and ended on April 1 at 4301.25 is upward wave 2{-8} within downtrending wave 1{-7}. A 2nd wave can either be a Zigzag or a Flat. They often retrace a great deal of the preceding 1st wave. What we see on the chart now is the tentative beginning of a larger movement. Internally, the first wave of the correction, wave A{-9}, is underway, and will have within it five or three wave: Five if its a Zigzag and three if its a Flat. Most 2nd wave that I’ve tracked have been Zigzags, but not all.

The alternative analysis is based on fact that makes analysis tricky early in a movement: The question of degree. Early on there’s very little context to guide the analysis, and so what I have labeled as wave 2{-8} within wave 1{-7} could in fact be could a smaller correction, wave 2{-9} within wave 5{-8}, for example, which would mean that the parent, declining wave 5{-8}, is still underway.

This duration of the wave can be a guide. This wave 1{-8} within a 5th wave has lasted for three days. The last time we had a wave 1{-8}, within a 1st wave at the start of the January 4 decline, it lasted for five days. So there’s a proportionality on the chart that led me to mark it as I did in my principal analysis. However, if the alternative scenario proves out then a 1st wave lasting five or seven days or so wouldn’t be out of line.

We Are Here.

These are the waves currently in progress under my principal analysis. Each line on the list shows the wave number, with the subscript in curly brackets, the traditional degree name, the starting date, the starting price of the S&P 500 E-mini futures, and the direction of the wave.

  • Index:
  • 5{0} Intermediate, 12/26/2018, 2346.58 (up)
  • 4{-1} Minor, 1/4/2022 4818.62 (down)
  • 1{-2} Minute, 1/4/2022 4818.62 (down)
  • Futures and index:
  • 1{-3} Minuette, 1/4/2022, 4808.25 (down) (futures), 4818.62 (down) (index)
  • Futures:
  • 1{-4} Subminuette, 1/4/2022, 4808.25 (down)
  • 1{-5} Micro, 1/4/2022, 4808.25 (down)
  • 1{-6} Submicro, 1/4/2022, 4808.25 (down)
  • 5{-7} Minuscule, 3/31/2022, 4631 (down)
  • 2{-8} Subminuscule, 4/1/2022, 4301.25 (up)

Learning and other resources. Elliott wave analysis provides context, not prophecy. As the 20th century semanticist Alfred Korzybski put it in his book Science and Sanity (1933), “The map is not the territory … The only usefulness of a map depends on similarity of structure between the empirical world and the map.” And I would add, in the ever-changing markets, we can judge that similarity of structure only after the fact.

See the menu page Analytical Methods for a rundown on where to go for information on Elliott wave analysis.

By Tim Bovee, Portland, Oregon, April 4, 2022

Disclaimer

Tim Bovee, Private Trader tracks the analysis and trades of a private trader for his own accounts. Nothing in this blog constitutes a recommendation to buy or sell stocks, options or any other financial instrument. The only purpose of this blog is to provide education and entertainment.

No trader is ever 100 percent successful in his or her trades. Trading in the stock and option markets is risky and uncertain. Each trader must make trading decisions for his or her own account, and take responsibility for the consequences.

License
Creative Commons License

All content on Tim Bovee, Private Trader by Timothy K. Bovee is licensed under a Creative Commons Attribution-ShareAlike 4.0 International License.

Based on a work at www.timbovee.com.

Trader’s Notebook

3:30 p.m. New York time

Half an hour before the closing bell. The S&P 500 fell to 4501.25 on the futures and then reversed, rising by nearly 40 points. Wave 5{-9} within wave 1{-8} is underway. It is a resumption of the downtrend that began on January 4.

I’ve mentioned from time to time in earlier analyses how ambiguous the degree of waves in a new trend are. There’s no context. And such is the case with today’s chart. I’ve labeled the waves within the downtrend that began on March 29 — wave 1{-8} within wave 5{-7} — as being of the {-9} degree. But they could well be one or two degrees smaller.

The bump up from the session low could be the beginning of a correction within downtrending wave 5{-9}, or it could be something. Impossible to say at this point.

This morning’s analysis is unchanged. I’ve updated the chart.

9:35 a.m. New York time

What’s happening now? The S&P 500 E-mini futures traded sideways overnight after a sharp decline in the last hour of Thursday’s trading session.

What does it mean? The pattern of the chart since the March 29 peak is consistent with a resumption of the downtrend that began on January 4, and I’ve marked the chart that way. The upward correction that began on February 24 has ended, and the downtrend is again underway.

What are the alternatives? There are two:

Alternative #1: The March 29 peak and the subsequent decline are downward corrections within the upward correction, which is still underway.

Alternative #2: The upward correction is forming a compound structure, and the decline is a connecting wave that will be followed by another corrective pattern.

The Chart. I’ve focused on the final leg (wave C{-8} of the upward correction (wave 4{-7}) and the decline that has followed in order to better see the internal structure of each. See the chart in yesterday’s Trader’s Notebook for a view of the entire downtrend that began on January 4.

[S&P 500 E-mini futures at 3:30 p.m., 45-minute bars, with volume]

What does Elliott wave theory say? Today’s analysis counts the March 31 peak, 4631, as the end of upward wave 4{-7}, which began on February 24 from 4101.75. The decline that followed is wave 1{-8} within wave 5{-7}, both downtrending as a resumption of the decline that began on January 4 from 4808.25.

Alternative analysis #1, which was Thursday’s principal analysis, has wave C{-8} within wave 4{-7} still underway, with the decline that began on March 31 being a correction within C{-8}.

The price so far has reached 105 points below the March 31 peak, which seems overly large for a correction within wave C{-8}. Also, as the labels for the {-9} degree show, wave C{-8} has completed five clear waves, as is required of the final wave of a Flat correction, strengthening the conclusion that wave 4{-7} is complete.

Alternative analysis #2 sees the decline from March 31 as a connecting wave, X{-8}, within an ongoing wave 4{-7} upward correction. An X wave is followed by a second corrective pattern, and sometimes three such patterns are linked together in a compound correction.

An X wave can be of any corrective pattern internally. However, the form is usually a Zigzag of three waves. Within a Zigzag, the A wave is built from five waves; the B wave, three; and the C wave, five (5-3-5).

Internally, the decline that began on March 31 has completed three waves, with wave 3{-9} being the longest. the subsequent sideways movement, wave 4{-9}, is consistent with a five-wave pattern, and so could very well be part of a wave X{-8} within wave 4{-7}. At this point the requirements of wave 1{-8} and wave X{-8} are identical. However, reversals at the end of a correction (principal analysis) and corrections within a correction (alternative #1) are far more common than compound corrections (alternative #2), so I’ve treated the X-wave possibility as the least likely scenario.

We Are Here.

These are the waves currently in progress under my principal analysis. Each line on the list shows the wave number, with the subscript in curly brackets, the traditional degree name, the starting date, the starting price of the S&P 500 E-mini futures, and the direction of the wave.

  • Index:
  • 5{0} Intermediate, 12/26/2018, 2346.58 (up)
  • 4{-1} Minor, 1/4/2022 4818.62 (down)
  • 1{-2} Minute, 1/4/2022 4818.62 (down)
  • Futures and index:
  • 1{-3} Minuette, 1/4/2022, 4808.25 (down) (futures), 4818.62 (down) (index)
  • Futures:
  • 1{-4} Subminuette, 1/4/2022, 4808.25 (down)
  • 1{-5} Micro, 1/4/2022, 4808.25 (down)
  • 1{-6} Submicro, 1/4/2022, 4808.25 (down)
  • 5{-7} Minuscule, 3/31/2022, 4631 (down)
  • 1{-8} Subminuscule, 3/31/2022, 4631 (down)

Learning and other resources. Elliott wave analysis provides context, not prophecy. As the 20th century semanticist Alfred Korzybski put it in his book Science and Sanity (1933), “The map is not the territory … The only usefulness of a map depends on similarity of structure between the empirical world and the map.” And I would add, in the ever-changing markets, we can judge that similarity of structure only after the fact.

See the menu page Analytical Methods for a rundown on where to go for information on Elliott wave analysis.

By Tim Bovee, Portland, Oregon, April 1, 2022

Disclaimer

Tim Bovee, Private Trader tracks the analysis and trades of a private trader for his own accounts. Nothing in this blog constitutes a recommendation to buy or sell stocks, options or any other financial instrument. The only purpose of this blog is to provide education and entertainment.

No trader is ever 100 percent successful in his or her trades. Trading in the stock and option markets is risky and uncertain. Each trader must make trading decisions for his or her own account, and take responsibility for the consequences.

License
Creative Commons License

All content on Tim Bovee, Private Trader by Timothy K. Bovee is licensed under a Creative Commons Attribution-ShareAlike 4.0 International License.

Based on a work at www.timbovee.com.

Rules for Trading Shares

I’ve revised my rules for trading shares. Here’s the new version, and it can be accessed at any time under the Trading Rules tab at the top of each page.

Lower Risk: Shares

Shares are considered to be lower risk than options because they can be traded without leverage and are generally have lower volatility.

On the other other hand, options positions can be positioned in a way that limits the possible loss if the price moves against the trader. Shares can drop to zero. I’ve had it happen.

In trading shares I use the same mix of techniques that I use in trading options in connection with earnings announcements (see the “Earnings Plays” section, above).

In broad terms, I select candidates using a broad indicator of some sort, based on something other than the chart. To time my entry, I use a narrower chart-based indicator — technical analysis — to guide my opening of the position. To time my exit, I use the broad indicator. For entries and exits, I confirm the indicators through Elliott wave analysis of the chart.

My preferences are to use analyst opinions, tracked by Zacks Research, for the broad indicator. I select trade candidates from stocks that have a bullish rank, a score of 1 or 2 on the Zacks analysis. I also give preference to stocks awarded a high momentum score — A or B — under the Zacks method.

For the narrower chart-based indicator, I use the Fisher Transform. It’s not widely available — I’ve seen it on one of the brokerage platforms I use, TDAmeritrade. But any technical indicator can be used. Where the Fisher is unavailable, I tend to use the RSI.

Here are my trading rules:

  • Buy long shares
    • Zacks score is 1 or 2
    • Zacks moment indicator is A or B
    • The technical indicator (Fisher Transform or RSI) has just switched to uptrending from below the base line (0 on the Fisher and 30 on the RSI).
  • Place a trailing stop loss of 20%
    • If the technical indicator gives a downtrending signal
    • If Zacks score becomes greater than 2.

The best tool that shares offer to mitigate that risk is the stop-loss; setting a price at which shares will be sold if the market price reaches that level.

I use a trailing-stop loss. For long shares, if I set a, say, 3% stop-loss, and the price of the shares rises, then the stop-loss will also rise, remaining 3% below the peak price.

I will use 3% occasionally as a very short-term insurance to limit loss, but my normal practice is to give shares room to maneuver. For that purpose, I use a 20% trailing stop. I’ve based based choice on three research papers:

Han, Yufeng and Zhou, Guofu and Zhu, Yingzi, Taming Momentum Crashes: A Simple Stop-Loss Strategy (September 24, 2016). Available at SSRN: https://ssrn.com/abstract=2407199 or http://dx.doi.org/10.2139/ssrn.2407199

Yusupov, Garib and Shorrason, Bergsveinn, Performance of Stop-Loss Rules vs. Buy-and-Hold Strategy (2009). Available at Lund University: https://www.lunduniversity.lu.se/lup/publication/1474565

Kaminski, Kathryn and Lo, Andrew W., When Do Stop-Loss Rules Stop Losses? (January 3, 2007). EFA 2007 Ljubljana Meetings Paper. Available at SSRN: https://ssrn.com/abstract=968338 or http://dx.doi.org/10.2139/ssrn.968338

By Tim Bovee, Portland, Oregon, March 31, 2022

Disclaimer

Tim Bovee, Private Trader tracks the analysis and trades of a private trader for his own accounts. Nothing in this blog constitutes a recommendation to buy or sell stocks, options or any other financial instrument. The only purpose of this blog is to provide education and entertainment.

No trader is ever 100 percent successful in his or her trades. Trading in the stock and option markets is risky and uncertain. Each trader must make trading decisions for his or her own account, and take responsibility for the consequences.

License
Creative Commons License

All content on Tim Bovee, Private Trader by Timothy K. Bovee is licensed under a Creative Commons Attribution-ShareAlike 4.0 International License.

Based on a work at www.timbovee.com.

Trader’s Notebook

3:30 p.m. New York time

Half an hour before the closing bell. Shortly after the opening bell, the S&P 500 E-mini futures fell below the 161.8% 4th wave Fibonacci retracement of the preceding 2nd wave. The price has remained below that level so far in the session.

This morning’s principal analysis had uptrending wave 4{-7} still underway, with the price potentially rising above the March 29 high, 4631, sometimes in the future. The further the price retreats from that level, the greater the likelihood that wave 4{-7} has ended and downtrending wave 5{-7} has begun, the latter being the first alternate analysis from this morning.

Wave 4{-7} has fulfilled the minimum requirements of a 4th wave, as has the present internal wave, C{-8}. So basically it’s a flip of the coin to choose between the two analyses.

A downward correction within wave C{-8} will have three subwaves, and the first wave within downtrending wave 5{-7} will have five subwaves, and so as those patterns emerge they may help shed some light on whether wave 4{-7} has ended or not.

No change in the analysis. I’ve updated the chart.

11:35 a.m. New York time

Trading rules: shares. I’ve revised my trading rules for trading shares. The new version can be found here or at anytime on the Trading Rules tab at the top of each page.

10:20 a.m. New York time

MKC earnings play exit. I exited my short bull put vertical options spread on MKC for 24.8% of maximum potential profit and have updated the trade analysis with full results.

9:55 a.m. New York time

What’s happening now? The S&P 500 E-mini futures remained within the narrow range of the last three days, below the March 29 high of 4631 and tracking close to the 161.8% retracement of the rise that began on March 15.

What does it mean? The correction that began on February 24 continues, and within that correction, the third leg that began on March 15 has stalled, a condition that often signals that a reversal is ahead.

What are the alternatives? There are two:

#1: The rise from March 15 may have ended with the March 29 high and the sideways hesitancy we’re seeing now may be the first, tentative steps of a resumption of the larger downtrend that began on January 4.

#2: The correction may be forming a compound structure, linking several corrective patterns together.

[S&P 500 E-mini futures at 3:30 p.m., 220-minute bars, with volume]

What does Elliott wave theory say? Under the principal analysis, wave C{-8}, which began on March 15, and its parent, wave 4{-7}, are still underway but has stalled, suggesting that it may move slightly higher before reversing and as wave 5{-7} resuming the decline, wave 1{-6}, that began on January 4.

Under the first alternative, wave C{-8} peaked on March 29, ending the parent wave 4{-7}, and wave 5{-7} has been underway since then.

Under the second alternative, wave 4{-7} is forming a compound correction, linking several corrective patterns together, as described in greater detail in yesterday’s analysis.

We Are Here.

These are the waves currently in progress under my principal analysis. Each line on the list shows the wave number, with the subscript in curly brackets, the traditional degree name, the starting date, the starting price of the S&P 500 E-mini futures, and the direction of the wave.

  • Index:
  • 5{0} Intermediate, 12/26/2018, 2346.58 (up)
  • 4{-1} Minor, 1/4/2022 4818.62 (down)
  • 1{-2} Minute, 1/4/2022 4818.62 (down)
  • Futures and index:
  • 1{-3} Minuette, 1/4/2022, 4808.25 (down) (futures), 4818.62 (down) (index)
  • Futures:
  • 1{-4} Subminuette, 1/4/2022, 4808.25 (down)
  • 1{-5} Micro, 1/4/2022, 4808.25 (down)
  • 1{-6} Submicro, 1/4/2022, 4808.25 (down)
  • 4{-7} Minuscule, 3/3/2022, 4101.75 (up)
  • C{-8} Subminuscule, 3/15/2022, 4129.50 (up}

Learning and other resources. Elliott wave analysis provides context, not prophecy. As the 20th century semanticist Alfred Korzybski put it in his book Science and Sanity (1933), “The map is not the territory … The only usefulness of a map depends on similarity of structure between the empirical world and the map.” And I would add, in the ever-changing markets, we can judge that similarity of structure only after the fact.

See the menu page Analytical Methods for a rundown on where to go for information on Elliott wave analysis.

By Tim Bovee, Portland, Oregon, March 31, 2022

Disclaimer

Tim Bovee, Private Trader tracks the analysis and trades of a private trader for his own accounts. Nothing in this blog constitutes a recommendation to buy or sell stocks, options or any other financial instrument. The only purpose of this blog is to provide education and entertainment.

No trader is ever 100 percent successful in his or her trades. Trading in the stock and option markets is risky and uncertain. Each trader must make trading decisions for his or her own account, and take responsibility for the consequences.

License
Creative Commons License

All content on Tim Bovee, Private Trader by Timothy K. Bovee is licensed under a Creative Commons Attribution-ShareAlike 4.0 International License.

Based on a work at www.timbovee.com.

WBA Trade

Walgreens Boots Alliance Inc. (WBA)

Lot 2-2022

Update 4/19/2022: I exited my short iron condor on WBA 31 days before expiration, for a $1.10 debit per contract/share, a profit before fees of $0.04 per contract. Shares were trading at $45.03, down $2.76 from the entry level.

The Implied Volatility Rank at exit was 24.6%, down 25 points from the entry level.

I exited because the position became immediately unprofitable after earnings were published and shares declined below the profit zone. Rather than retain the position in the hope of profitability, I exited for a minimum profit, freeing up the funds for other trades.

Shares declined by 5.8% over 20 days for a -105% annual rate. The options position produced a 3.6% return for a +66% annual rate.


I have entered a short iron condor on WBA, using options that trade for the last time 51 days hence, on May 20. The premium is a $1.14 credit per contract share and the stock at the time of entry was priced at $47.79.

The Implied Volatility Ratio stood at 49.6%.

Premium:$1.14Expire OTM
WBA-iron condorStrikeOddsDelta
Calls
Long52.5085.0%19
Break-even51.1477.5%27
Short50.0070.0%35
Puts
Short45.0065.0%29
Break-even43.6471.5%23
Long42.5078.0%17

The premium is 45.6% of the width of the position’s short/long spreads on both the calls and the puts. The profit zone covers a 9.5% move to the downside and a 7.0% move to the upside, for a total 16.5% profit range.

The risk/reward ratio is 1.2:1, with maximum risk of $136 and maximum reward of $114 per contract.

How I chose the trade. The trade was placed to coincide with WBA’s earnings announcement, before the openng bell on the day after entry. The short strikes were set to coincide with the expected move of $1.97 either way, based on options pricing adjusted for expiration two days away, which gives a price range of $45.79 to $49.73.

By Tim Bovee, Portland, Oregon, March 30, 2022

Disclaimer

Tim Bovee, Private Trader tracks the analysis and trades of a private trader for his own accounts. Nothing in this blog constitutes a recommendation to buy or sell stocks, options or any other financial instrument. The only purpose of this blog is to provide education and entertainment.

No trader is ever 100 percent successful in his or her trades. Trading in the stock and option markets is risky and uncertain. Each trader must make trading decisions for his or her own account, and take responsibility for the consequences.

License
Creative Commons License

All content on Tim Bovee, Private Trader by Timothy K. Bovee is licensed under a Creative Commons Attribution-ShareAlike 4.0 International License.

Based on a work at www.timbovee.com.

Trader’s Notebook

3:30 p.m. New York time

Half an hour before the closing bell. The S&P 500 stayed below the March 29 high, 4631 on the futures, during the trading session, and in the afternoon dropped below the 161.8% Fibonacci retracement level of the preceding downward movement that began on March 3. The upward movement from March 15 is wave C{-8} within wave 4{-7}. The C-wave retracement is of the prior B-wave downward movement. No change in the analysis. I’ve updated the chart below.

11:30 a.m. New York time

WBA earnings play entry. I’ve entered a short iron condor position on WBA, timed to coincide with tomorrow’s earnings announcement, using options that expire on May 20, and have posted an analysis of the trade.

11:10 a.m. New York time

PVH earnings play exit. I’ve exited my short bear call options spread on PVH for 30% of maximum potential profit and have updated the analysis with full results.

10:55 a.m. New York time

MU earnings play exit. I’ve exited my short bull put options spread on MU for 45% of maximum potential profit and have updated the analysis with full results.

9:35 a.m. New York time

What’s happening now? The S&P 500 E-mini futures remained below Tuesday’s high, 4631, in overnight trading, tracing a sideways path.

What does it mean? The upward correction that began on February 24 continues. It is most likely nearing an end and when complete, will be followed by a resumption of the downtrend that began on January 4, which will carry the price down toward the 4100 level and possibly below.

What are the alternatives? The two alternatives describe two possibilities: The correction has already ended, and the correction is forming a complex pattern that will delay its end.

[S&P 500 E-mini futures at 3:30 p.m., 180-minute bars, with volume]

What does Elliott wave theory say? The upward correction is wave 4{-7}, which began on February 24 from 4101.75, within wave 1{-6}, which began on January 4 from 4808.25. Wave 4{-7} is internally in its final wave, C{-8}, which has retraced the proceeding B wave by a Fibonacci 161.8%, indicating a Flat pattern.

Principal analysis: Wave 4{-7} has a bit more upside remaining, but it has fulfilled the requirements of Elliott wave analysis for 4th waves and could end at any time.

Alternative #1: Wave 4{-7} ended on March 29 at 4631 and the downtrend has resumed, wave 5{-7}. Fifth waves sometimes come up short, but most move beyond the end of the preceding 3rd wave, 4101.75 in this case.

Alternative #2: Most 4th waves end after three internal waves, with wave C{-8} in this instance. Sometimes, however, they form a compound structure, connecting two or the three-wave patterns. The correcting wave, moving downward in this case, would be wave X{-8} and would be followed by three more waves in a second corrective pattern. As in the other possibilities, once the correction in complete, the downtrend will resume as wave 5{-7}.

We Are Here.

These are the waves currently in progress under my principal analysis. Each line on the list shows the wave number, with the subscript in curly brackets, the traditional degree name, the starting date, the starting price of the S&P 500 E-mini futures, and the direction of the wave.

  • Index:
  • 5{0} Intermediate, 12/26/2018, 2346.58 (up)
  • 4{-1} Minor, 1/4/2022 4818.62 (down)
  • 1{-2} Minute, 1/4/2022 4818.62 (down)
  • Futures and index:
  • 1{-3} Minuette, 1/4/2022, 4808.25 (down) (futures), 4818.62 (down) (index)
  • Futures:
  • 1{-4} Subminuette, 1/4/2022, 4808.25 (down)
  • 1{-5} Micro, 1/4/2022, 4808.25 (down)
  • 1{-6} Submicro, 1/4/2022, 4808.25 (down)
  • 4{-7} Minuscule, 3/3/2022, 4101.75 (up)
  • C{-8} Subminuscule, 3/15/2022, 4129.50 (up}

Learning and other resources. Elliott wave analysis provides context, not prophecy. As the 20th century semanticist Alfred Korzybski put it in his book Science and Sanity (1933), “The map is not the territory … The only usefulness of a map depends on similarity of structure between the empirical world and the map.” And I would add, in the ever-changing markets, we can judge that similarity of structure only after the fact.

See the menu page Analytical Methods for a rundown on where to go for information on Elliott wave analysis.

By Tim Bovee, Portland, Oregon, March 30, 2022

Disclaimer

Tim Bovee, Private Trader tracks the analysis and trades of a private trader for his own accounts. Nothing in this blog constitutes a recommendation to buy or sell stocks, options or any other financial instrument. The only purpose of this blog is to provide education and entertainment.

No trader is ever 100 percent successful in his or her trades. Trading in the stock and option markets is risky and uncertain. Each trader must make trading decisions for his or her own account, and take responsibility for the consequences.

License
Creative Commons License

All content on Tim Bovee, Private Trader by Timothy K. Bovee is licensed under a Creative Commons Attribution-ShareAlike 4.0 International License.

Based on a work at www.timbovee.com.

MU Trade

Micron Technology Inc. (MU)

Update 3/30/2022: I exited my bull put vertical options spread on MU, 51 days before expiration, for a $0.88 debit per contract/share, a profit before fees of $62 per contract. Shares were trading at $84.96, up $4.66 from the entry level.

The Implied Volatility Rank at exit was 40.4, down 23.9 points from the entry level.

I exited at 45.3% of maximum potential profit, well above my normal exit point of 25% of max for earnings plays.

Shares rose by 5.8% over one day for a +2,118% annual rate. The options position produced a 70.5% return for a +25,716% annual rate.


I have entered a short bull put options spread on MU, using options that trade for the last time 52 days hence, on May 20. The premium is a $1.50 credit per contract share and the stock at the time of entry was priced at $80.30.

The Implied Volatility Ratio stood at 64.3%.

Premium:$1.50Expire OTM
MU-bull put spreadStrikeOddsDelta
Puts
Long70.0071.0%23
Break-even76.5065.0%28.5
Short75.0059.0%34

The premium is 60% of the width of the position’s short/long spread. The profit zone covers a 4.7% move to the downside and an unlimited move to the upside.

The risk/reward ratio is 2.3:1, with maximum risk of $150 and maximum reward of $350 per contract.

How I chose the trade. The trade was placed to coincide with MU’s earnings announcement, after the closing bell on the day of entry. The short strikes were set to coincide with the expected move of $6.23 either way, based on options pricing adjusted for time prior to expiration, which gives a price range of $74.72 to $85.94.

By Tim Bovee, Portland, Oregon, March 29, 2022

Disclaimer

Tim Bovee, Private Trader tracks the analysis and trades of a private trader for his own accounts. Nothing in this blog constitutes a recommendation to buy or sell stocks, options or any other financial instrument. The only purpose of this blog is to provide education and entertainment.

No trader is ever 100 percent successful in his or her trades. Trading in the stock and option markets is risky and uncertain. Each trader must make trading decisions for his or her own account, and take responsibility for the consequences.

License
Creative Commons License

All content on Tim Bovee, Private Trader by Timothy K. Bovee is licensed under a Creative Commons Attribution-ShareAlike 4.0 International License.

Based on a work at www.timbovee.com.

PVH Trade

PVH Corp. (PVH)

Update 3/30/2022: I exited my bear call vertical options spread on PVH, 51 days before expiration, for a $0.63 debit per contract/share, a profit before fees of $117 per contract. Shares were trading at $86.01, down $1.71 from the entry level.

The Implied Volatility Rank at exit was 20.4%, down 19.7 points from the entry level.

I exited because the position reached 30% of maximum potential profit, above my normal 25% exit point for earnings plays.

Shares declined by 1.9% over one day for a -712% annual rate. The options position produced a 185.7% return for a +67,786% annual rate.


I have entered a short bear call options spread on PVH, using options that trade for the last time 52 days hence, on May 20. The premium is a $0.90 credit per contract share and the stock at the time of entry was priced at $87.72.

The Implied Volatility Ratio stood at 40.1%.

Premium:$0.90Expire OTM
PVH-bear call spreadStrikeOddsDelta
Calls
Long105.0087.0%18
Break-even100.9083.5%21.5
Short100.0080.0%25

The premium is 36% of the width of the position’s short/long spread. The profit zone covers a 15% move to the upside and an unlimited move to the downside.

The risk/reward ratio is 4.6:1, with maximum risk of $410 and maximum reward of $90 per contract.

How I chose the trade. The trade was placed to coincide with PVH’s earnings announcement, after the closing bell on the day of entry. The short strikes were set to coincide with the expected move of $2.60 either way, based on options pricing, which gives a price range of $85.55 to $90.75, adjusted for time to expiration. The options used for estimating the spread were 16 days away from expiration, and so to account for the uncertainty, in the trade I used an unadjusted range, $77.76 to $98.54, providing a greater chance of success in return for a higher risk/reward ratio.

By Tim Bovee, Portland, Oregon, March 29, 2022

Disclaimer

Tim Bovee, Private Trader tracks the analysis and trades of a private trader for his own accounts. Nothing in this blog constitutes a recommendation to buy or sell stocks, options or any other financial instrument. The only purpose of this blog is to provide education and entertainment.

No trader is ever 100 percent successful in his or her trades. Trading in the stock and option markets is risky and uncertain. Each trader must make trading decisions for his or her own account, and take responsibility for the consequences.

License
Creative Commons License

All content on Tim Bovee, Private Trader by Timothy K. Bovee is licensed under a Creative Commons Attribution-ShareAlike 4.0 International License.

Based on a work at www.timbovee.com.