3:30 p.m. New York time
Half an hour before the closing bell. The S&P 500 E-mini futures rose slightly during the day and then resumed its downward course, reaching new lows. No change in the analysis. I’ve updated the chart.
11:35 a.m. New York time
My positions. I have exited my bear call options spread position on BABA and updated the entry analysis with results.
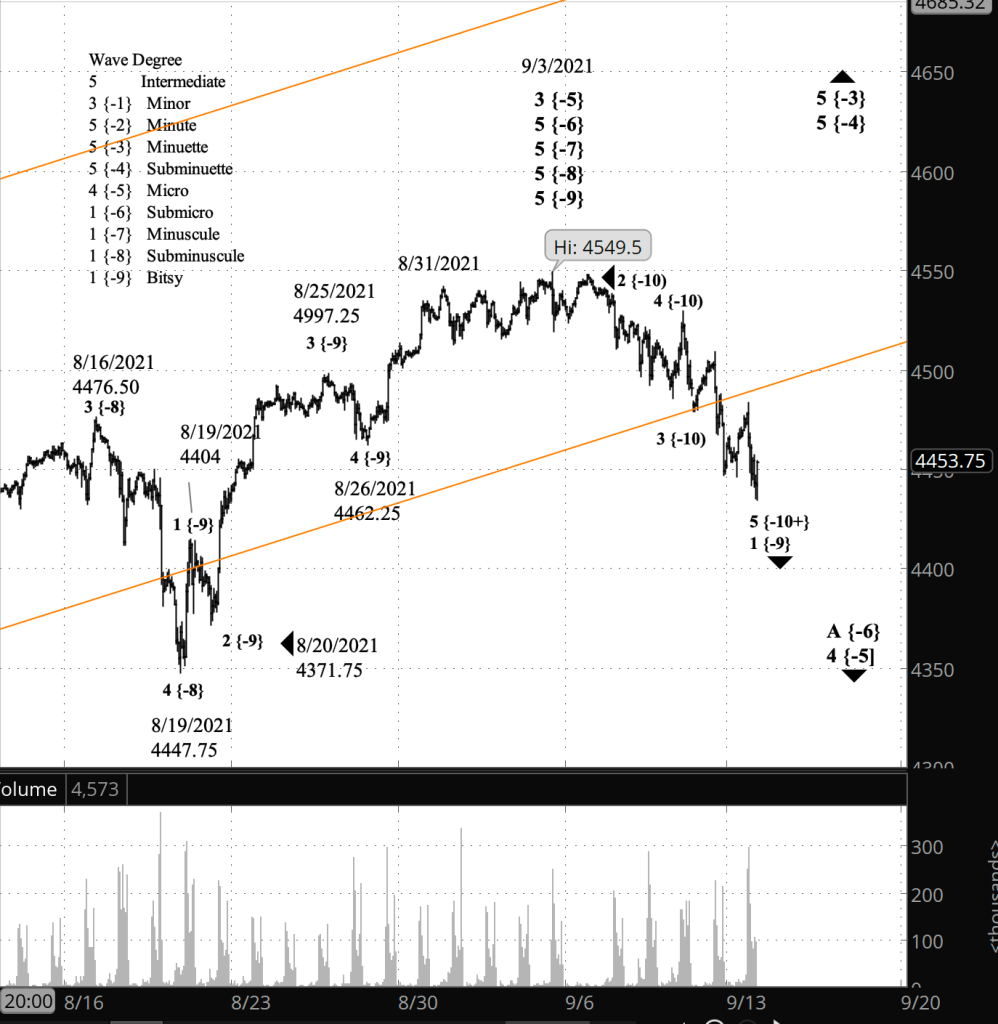
9:35 a.m. New York time
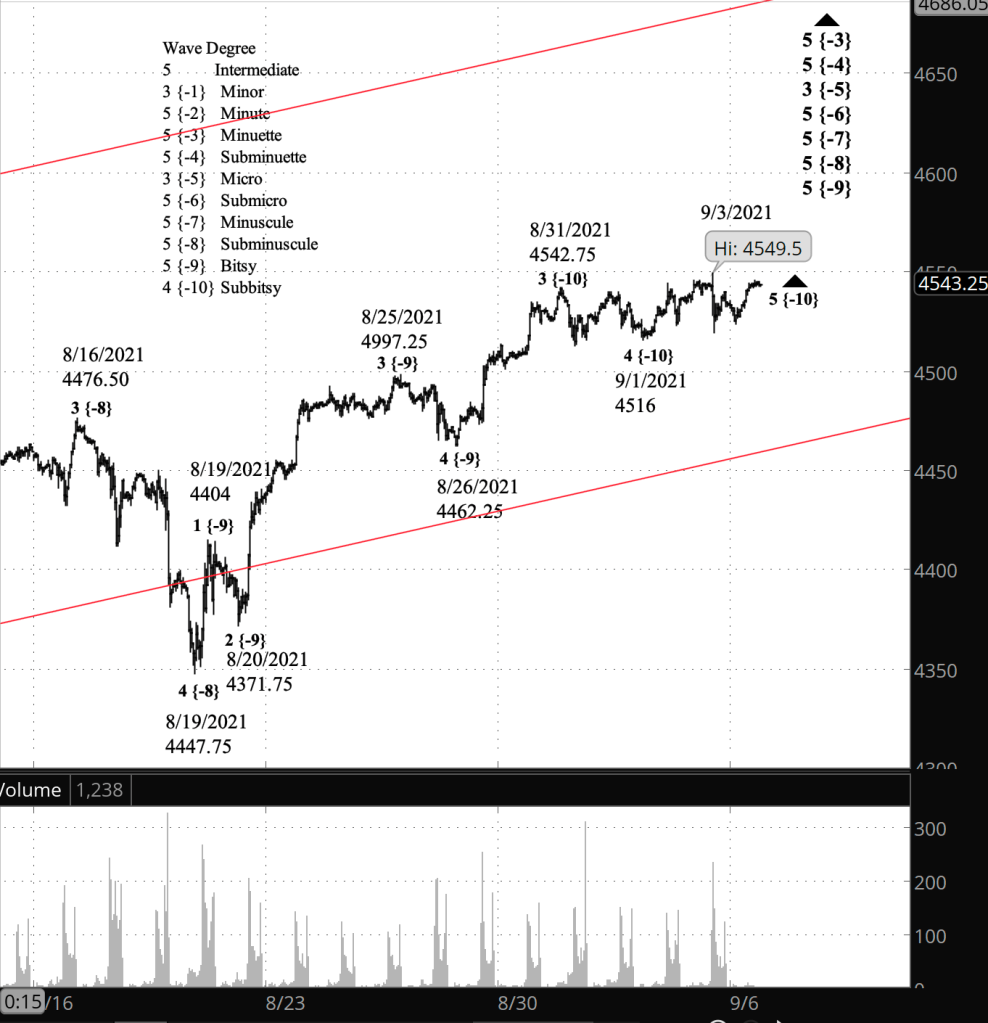
What’s happening now? The S&P 500 E-mini futures in overnight trading stayed above the low of 4434.50 set late in yesterday’s session.
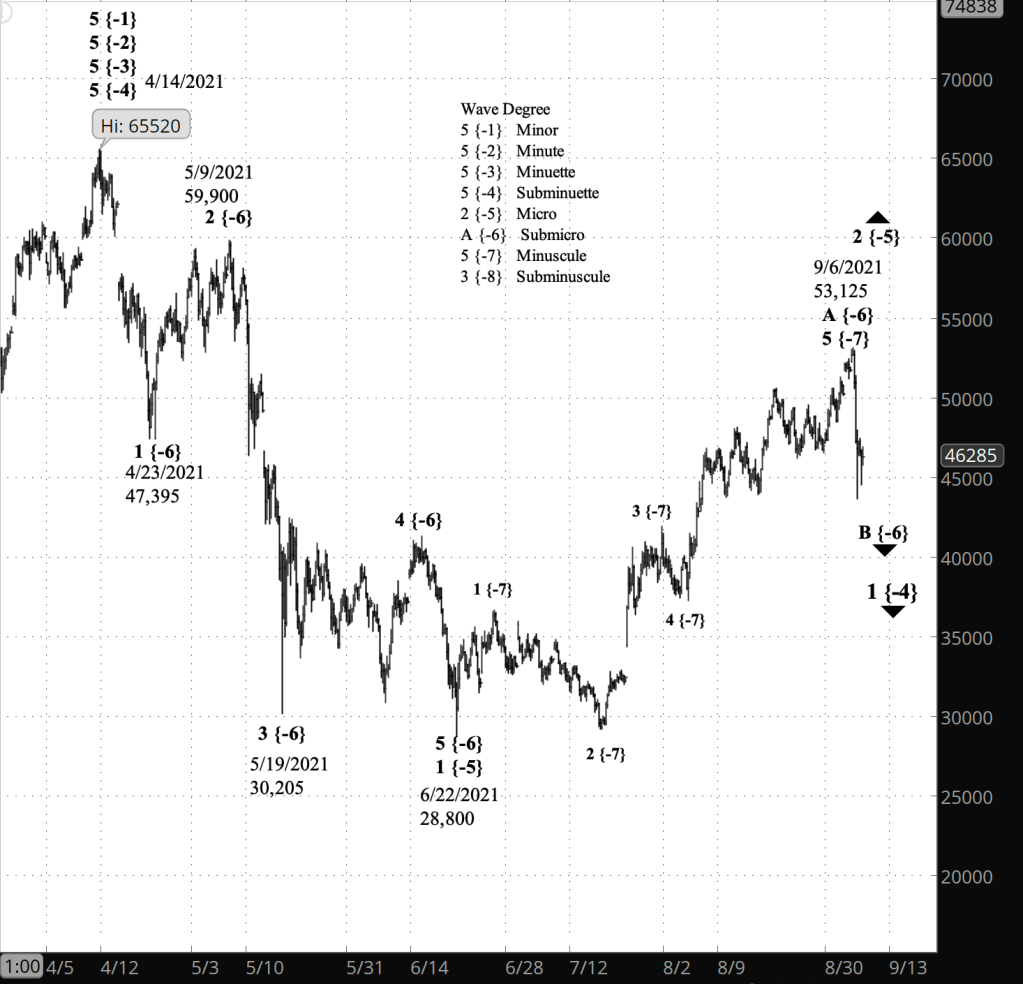
What does it mean? The early steps in a downward correction of the rise that began May 19 from 4059.50 on the index continues. The preceding uptrend peaked on September 3.
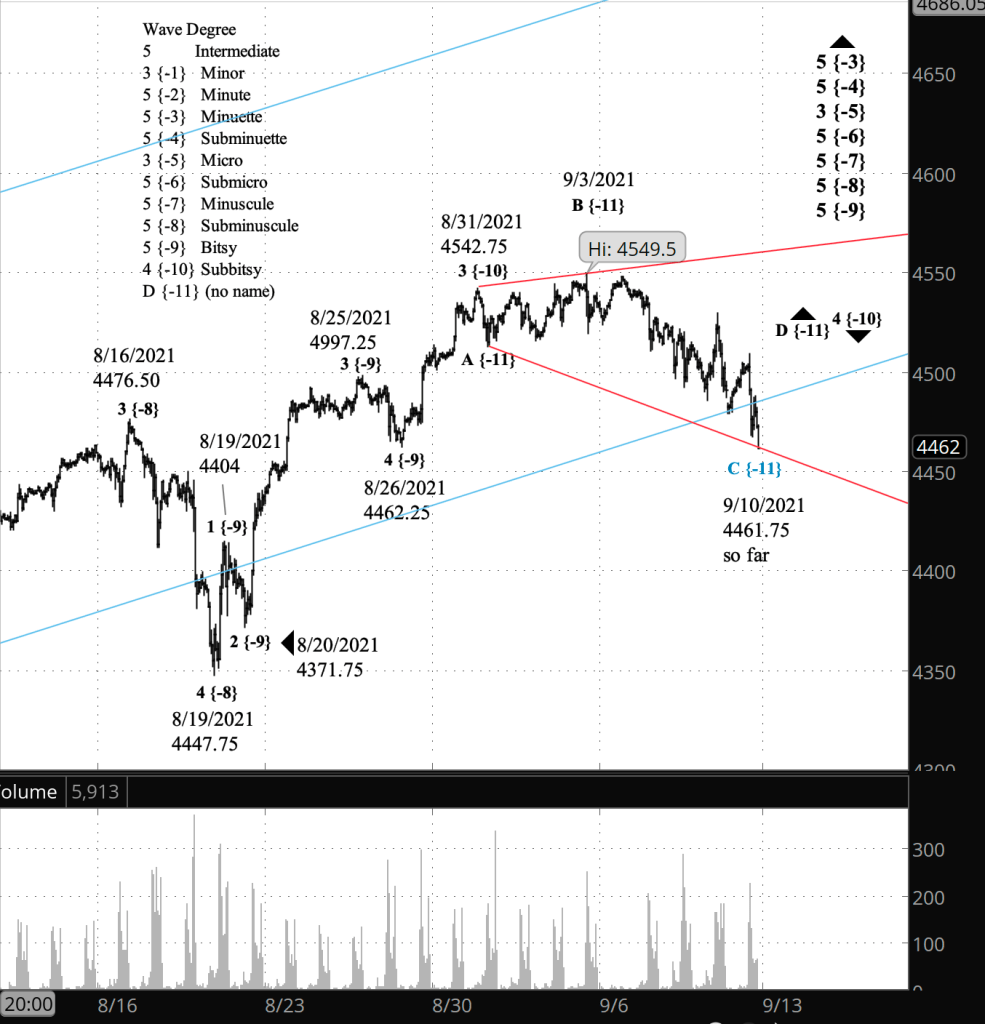
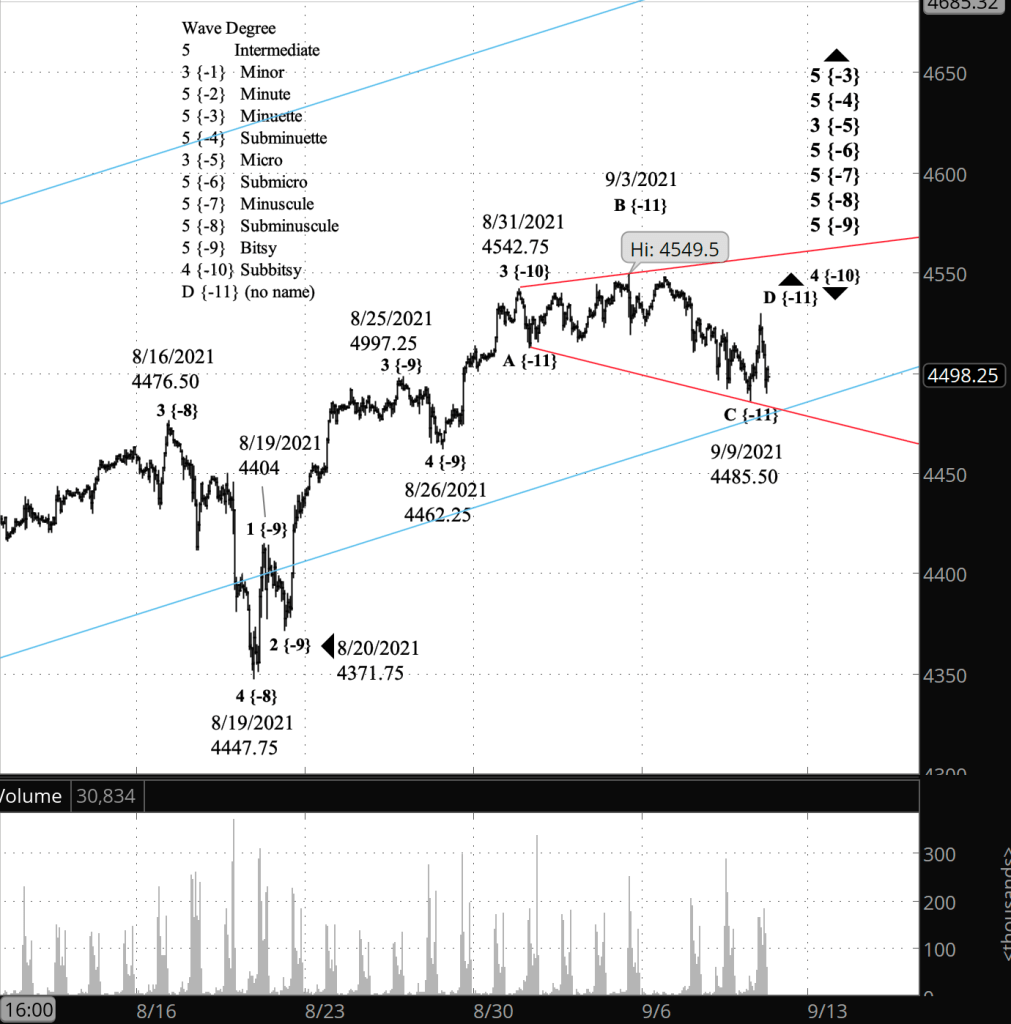
What’s the alternative? A correction within the rise that began on May 19 is still underway. The September 3 peak was a turning point within that larger rise.
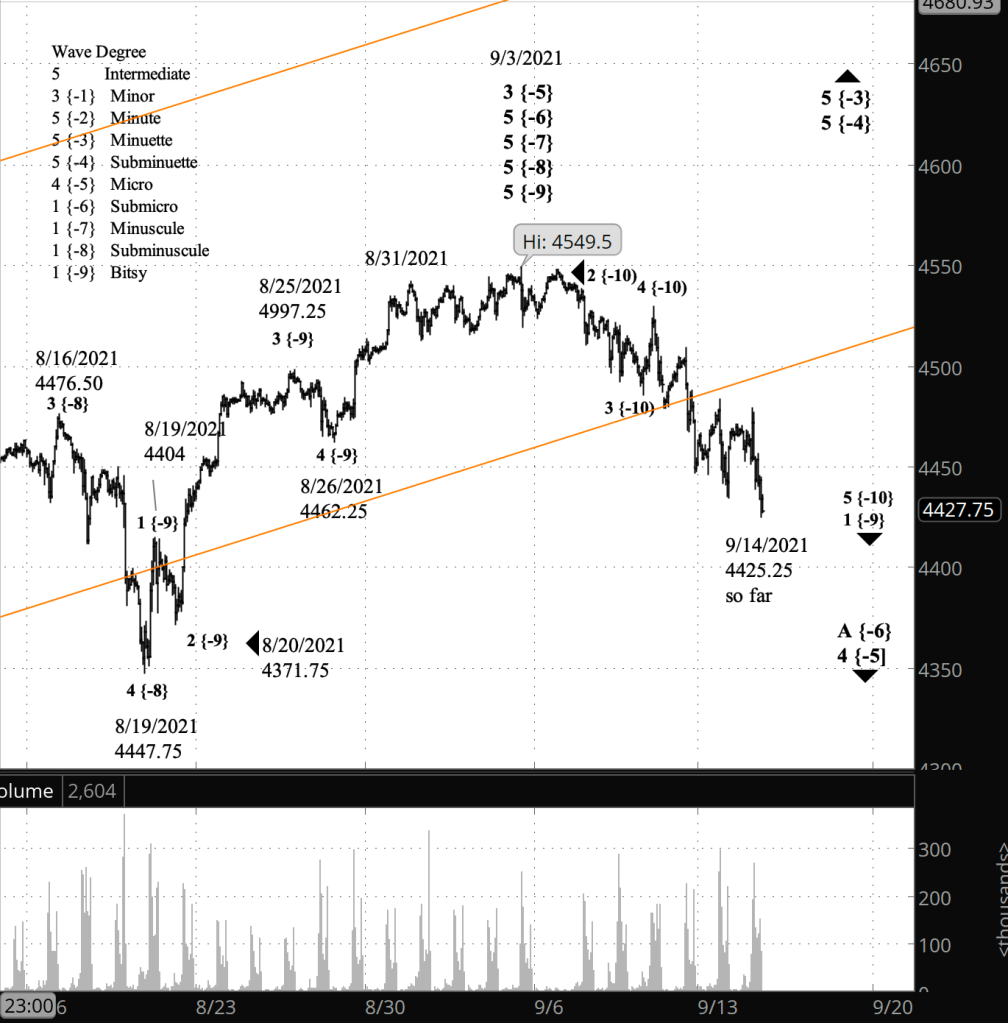
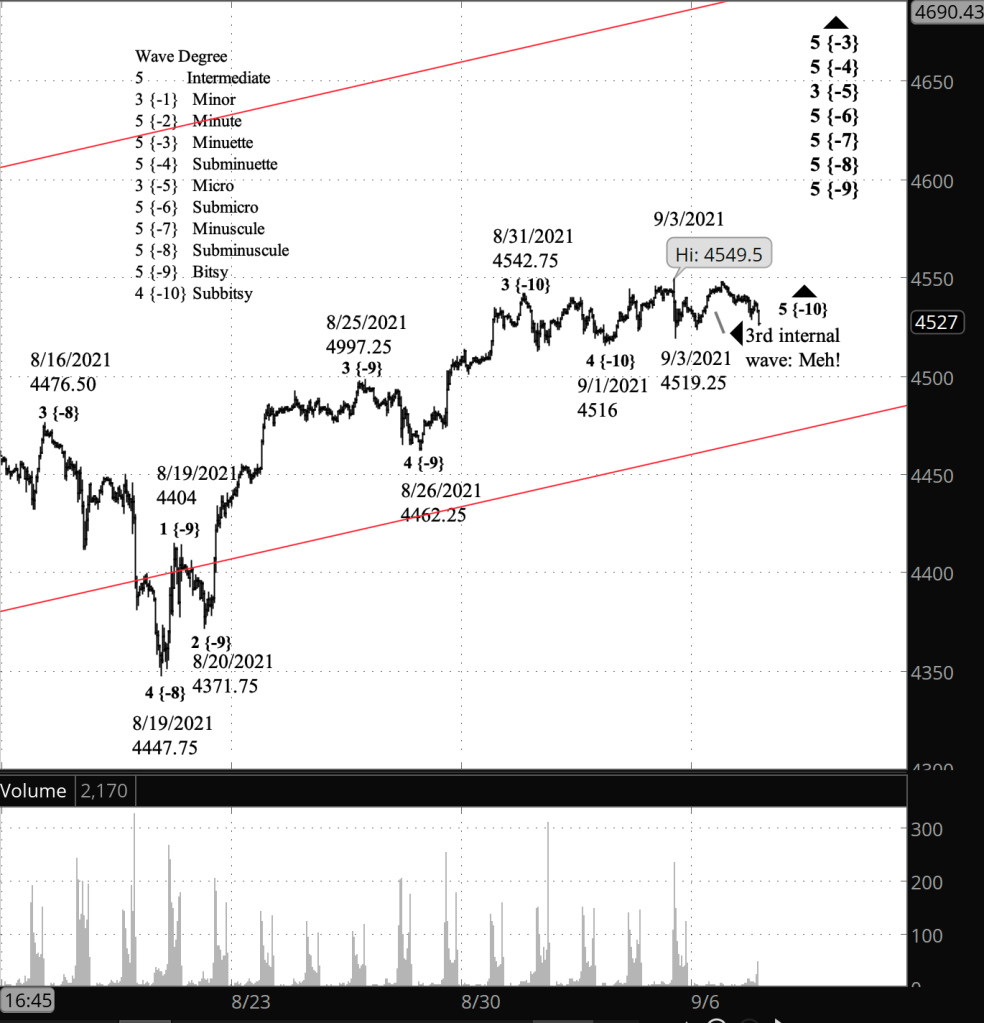
What does Elliott wave theory say? Under my principal analysis, wave 3 of Micro degree, which began on May 19, peaked on September 3, and wave 4 of Micro degree is now underway.
Under my alternate analysis, wave 3 of Micro degree is still underway, with the decline since September 3 being a correction within that wave. Wave 4 still lies in the future.
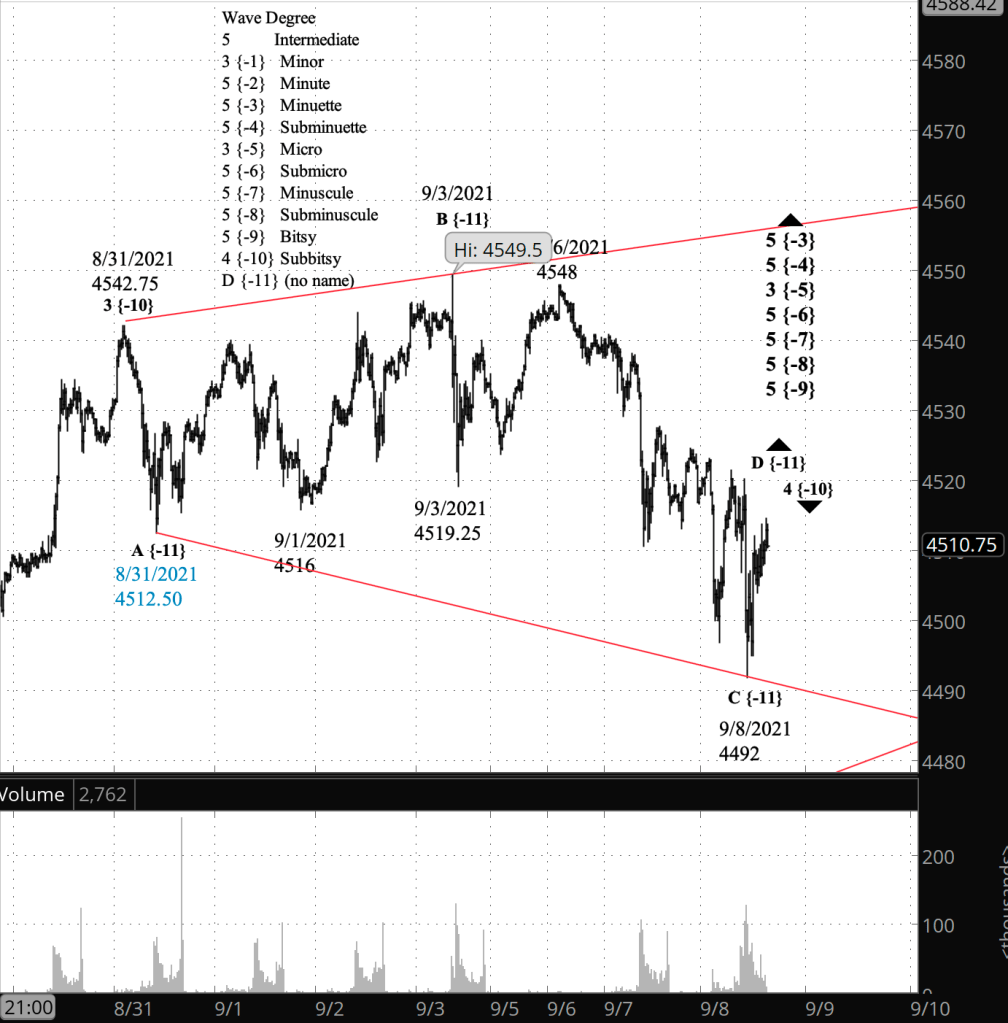
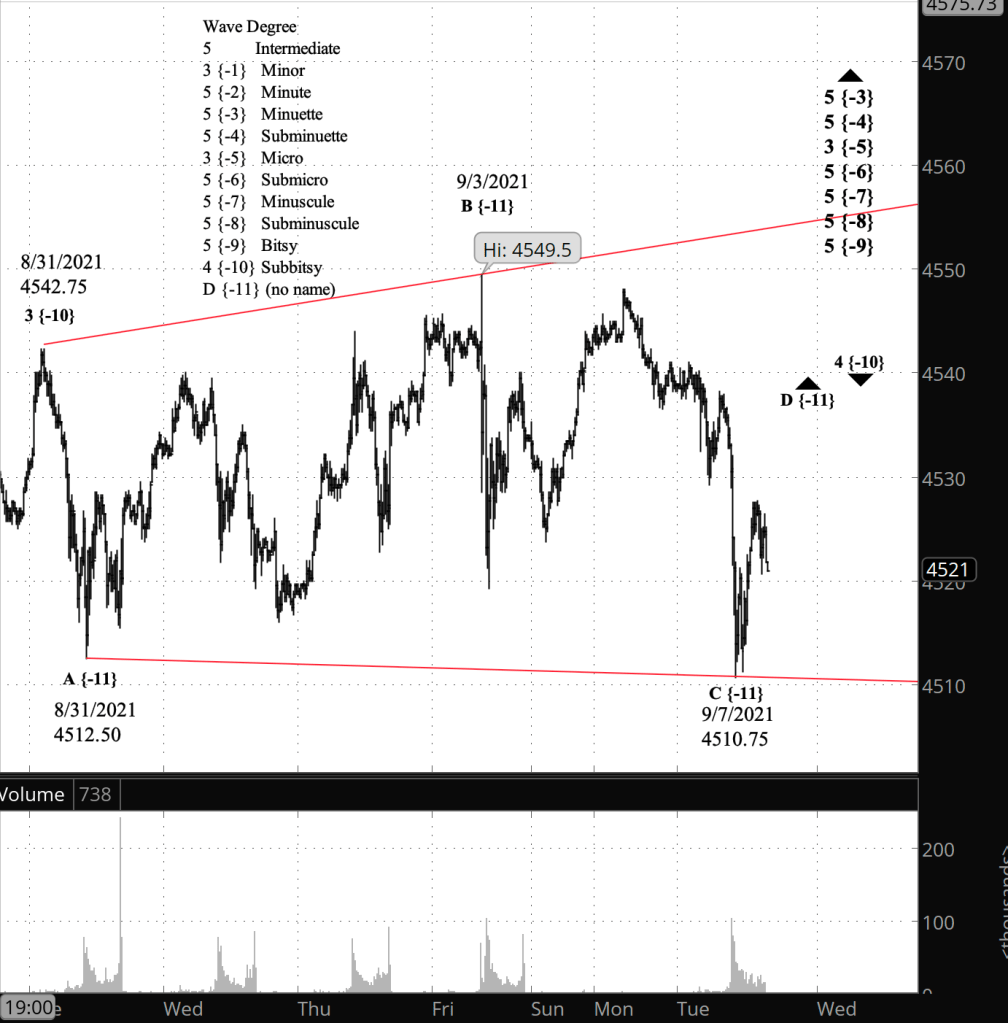
A price rise above the September 3 peak, 4549.50 on the futures and 4545.85 on the index, would mean that the alternate count is correct: wave 3 of Micro degree is not yet complete. Such an event would invalidate my present principal analysis and would promote the alternate count to principal count.
Learning and other resources. Elliott wave analysis provides context, not prophecy. As the 20th century semanticist Alfred Korzybski put it in his book Science and Sanity (1933), “The map is not the territory … The only usefulness of a map depends on similarity of structure between the empirical world and the map.” And I would add, we can judge that similarity of structure only after the fact.
See the menu page Analytical Methods for a rundown on where to go for information on Elliott wave analysis.
By Tim Bovee, Portland, Oregon, September 14, 2021
Disclaimer
Tim Bovee, Private Trader tracks the analysis and trades of a private trader for his own accounts. Nothing in this blog constitutes a recommendation to buy or sell stocks, options or any other financial instrument. The only purpose of this blog is to provide education and entertainment.
No trader is ever 100 percent successful in his or her trades. Trading in the stock and option markets is risky and uncertain. Each trader must make trading decisions for his or her own account, and take responsibility for the consequences.
License
All content on Tim Bovee, Private Trader by Timothy K. Bovee is licensed under a Creative Commons Attribution-ShareAlike 4.0 International License.
Based on a work at www.timbovee.com.

You must be logged in to post a comment.