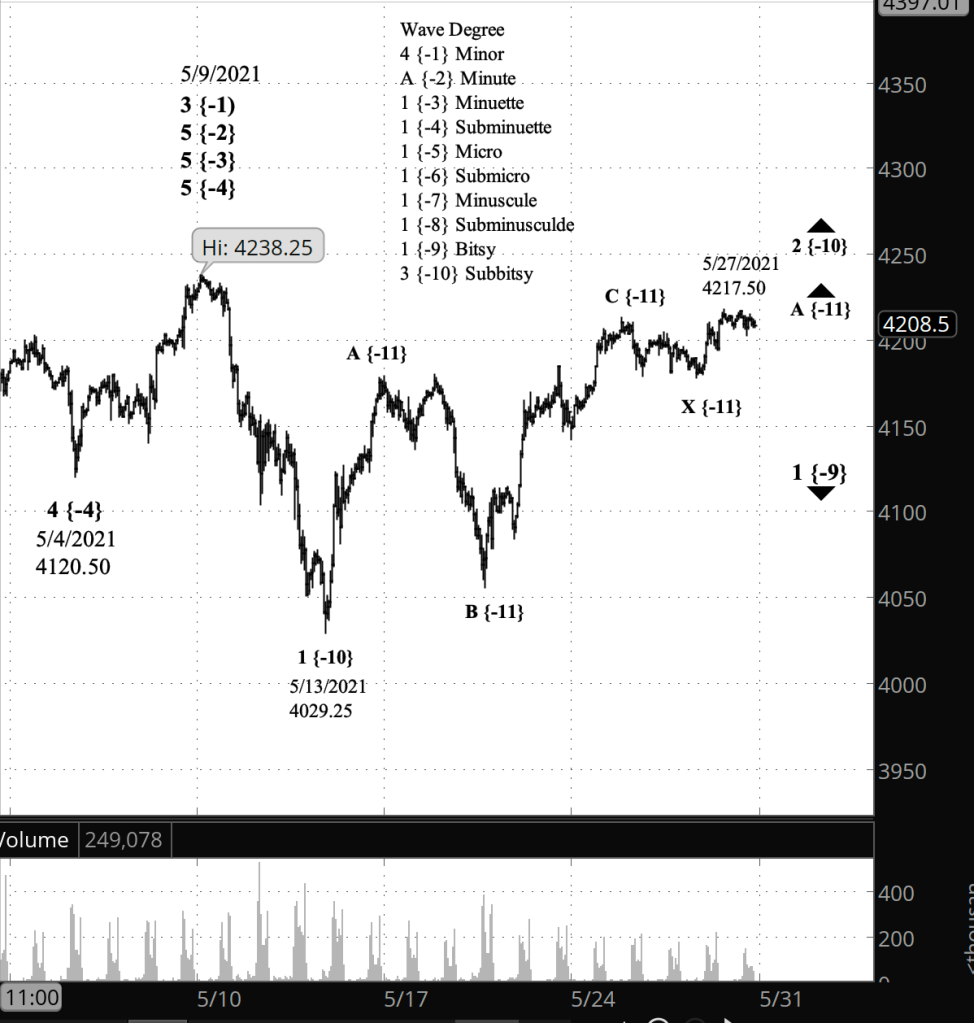
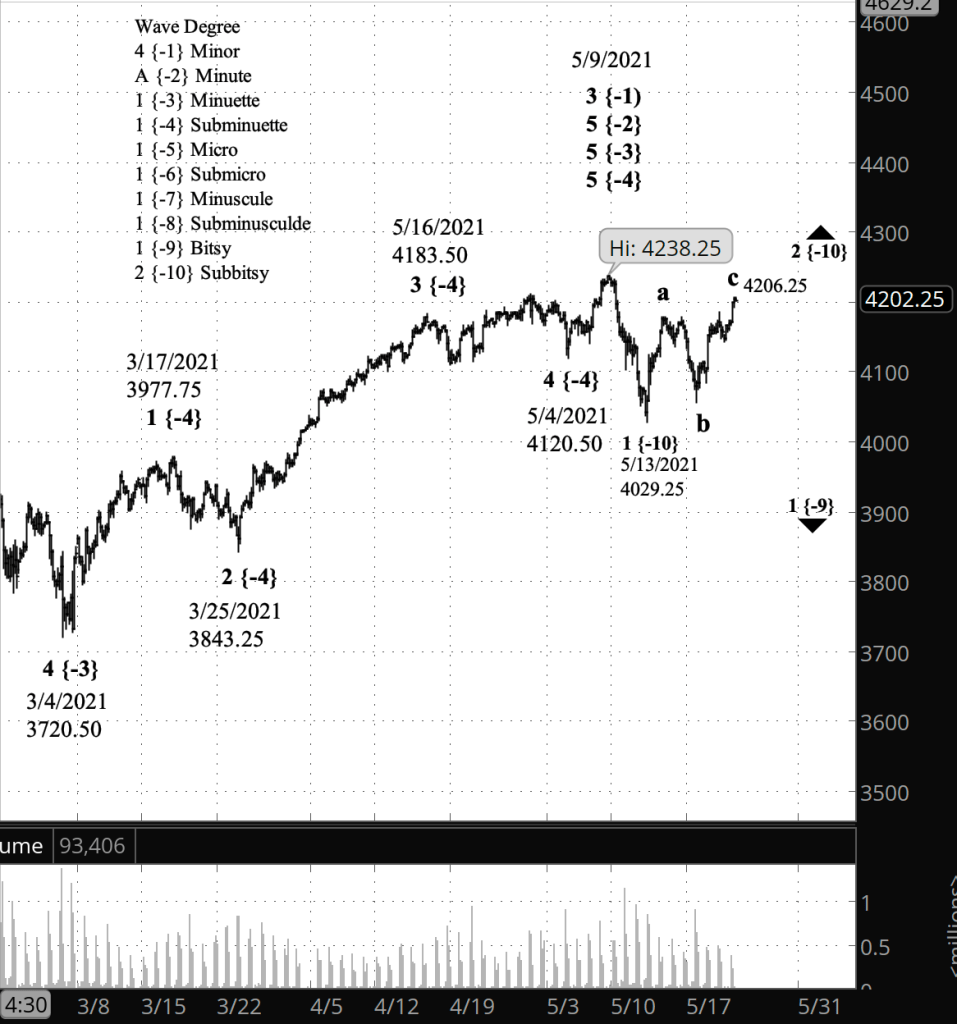
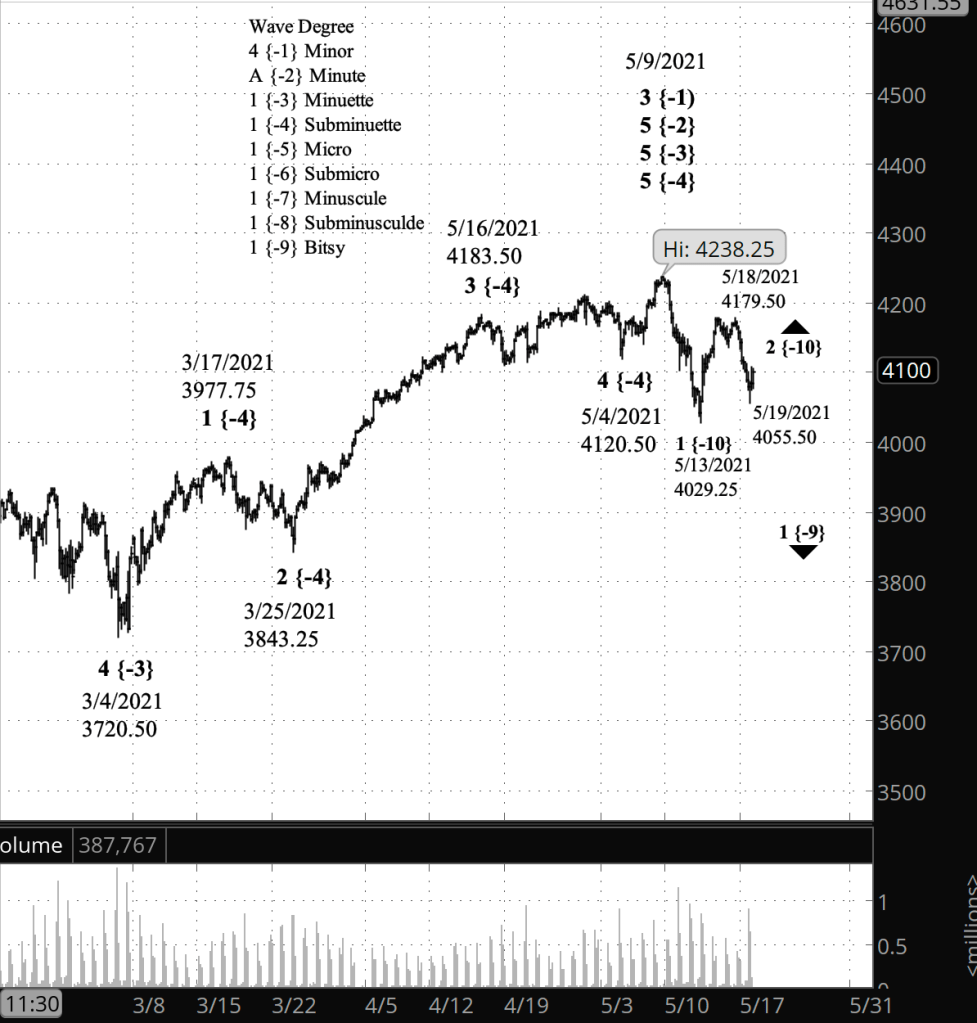
Half an hour before the closing bell. Perhaps it is in anticipation of Monday’s Memorial Day holiday in the United States, but the S&P 500 has done very little today, trading within a narrow range that is the stock-chart definition of boring. I’ve updated the chart below.
The U.S. markets are closed on Monday, but futures will trade on a truncated schedule. I’ll post an analysis of the S&P 500 E-mini futures Monday morning, and shall skip the afternoon update unless there’s a significant move.
9:40 a.m. New York time
What’s happening now? The S&P 500 E-mini futures rose higher in overnight trading, to 4217.40, and then stayed within a very narrow range.
What does it mean? The upward correction that began on May 13 from 4029.25 is still underway.
What’s the alternative? Unchanged from yesterday: If the price moves above 4238.25, the high of May 9, then the uptrend that began last year is still underway and higher prices lie ahead. If the price reverses and drops below 4029.25, the low of May 13, then the energetic middle portion of the downtrend that began May 9 is underway.
[S&P 500 E-mini futures at 3:30 p.m., hourly bars, with volume]
What does Elliott wave theory say? Under my principle analysis, the price is presently in wave A of the second portion of a compound correct, wave 2 of Subbitsy degree within downtrending wave 1 of Bitsy degree.
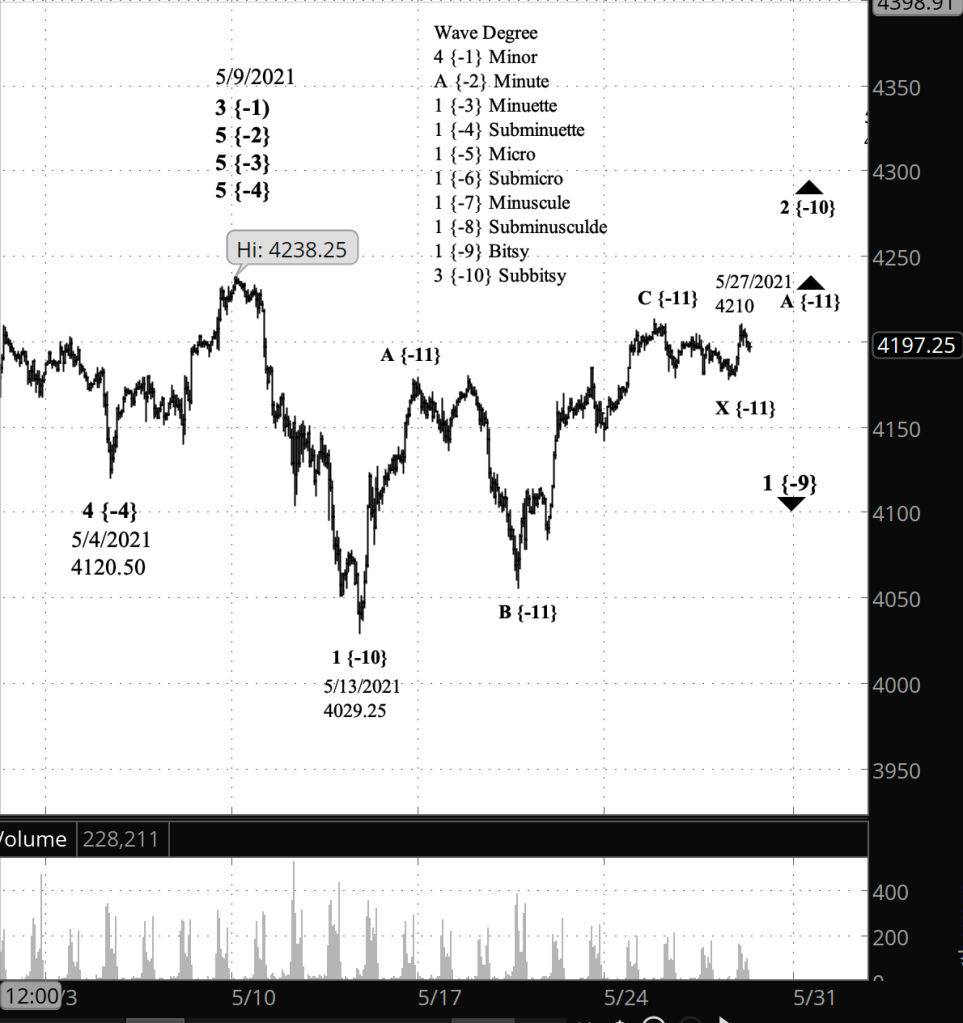
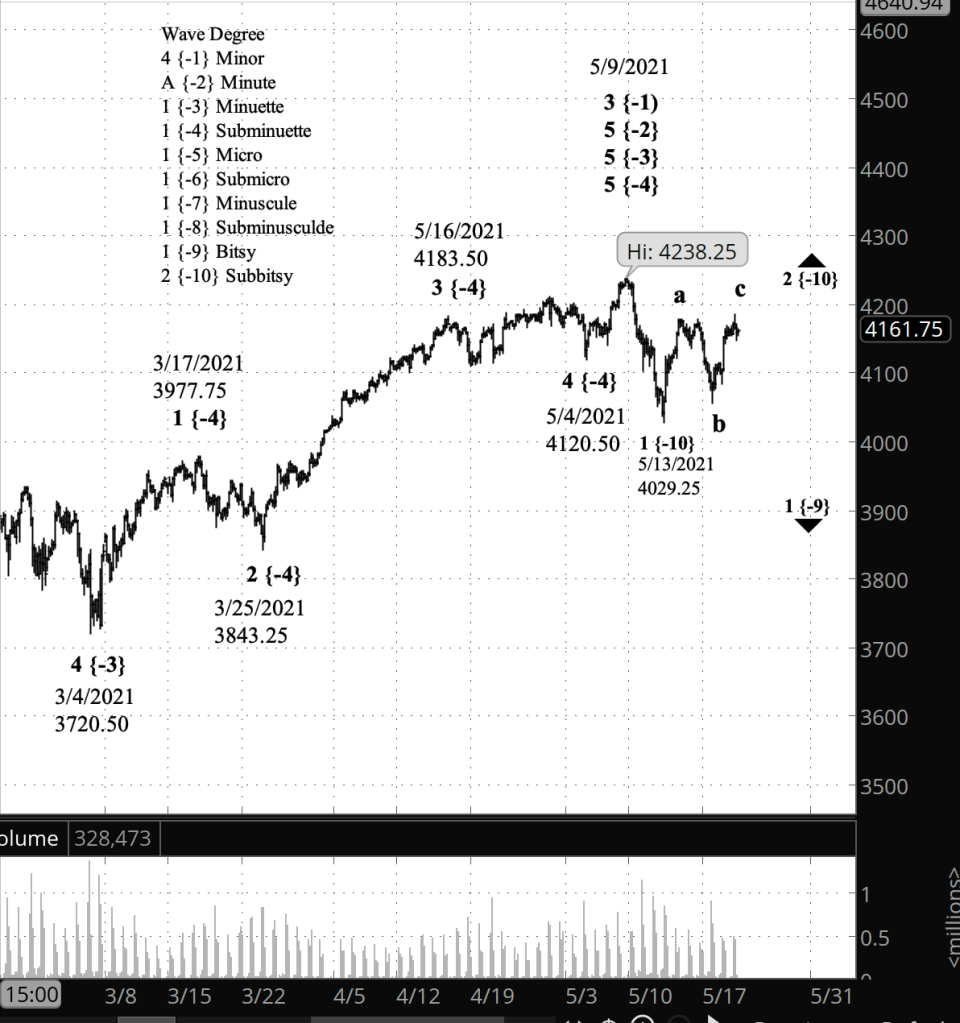
Half an hour before the closing bell. The S&P 500 worked its way downward by a little from the early afternoon high of 4210 on the futures, 4213.38 on the index. The rise is part of wave A wave within wave 2 of Subbitsy degree. After the A wave comes a downward B wave and then an upward C wave, completing the second pattern in the compound correction. Chart updated.
9:55 a.m. New York time
What’s happening now? The S&P 500 E-mini futures rose sharply at the opening bell, to a high so far of 4209.25.
What does it mean? The pattern to me looks like the second alternative scenario I outlined in yesterday’s post: A declining separator in a compound correction, following the end of one corrective pattern and the preceding that start of another. The rise is the start of the next corrective pattern.
What’s the alternative? If the price moves above 4238.25, the high of May 9, then the analysis switches to the third alternative: The uptrend that began last year is still underway and higher prices lie ahead. If the price reverses and drops below 4029.25, the low of May 13, then the principle analysis from yesterday holds sway; the energetic middle portion of the downtrend that began May 9 is underway.
[S&P 500 E-mini futures at 3:30 p.m., hourly bars, with volume]
What does Elliott wave theory say? Under the principle analysis, the decline that began May 25 from 4212.25 is wave X, a separator wave within uptrending wave 2 of Subbitsy degree. Wave X is complete and is followed by wave A of a second pattern within a compound correction. The corretive pattern can be a Zigzag, a Flat or a Triangle.
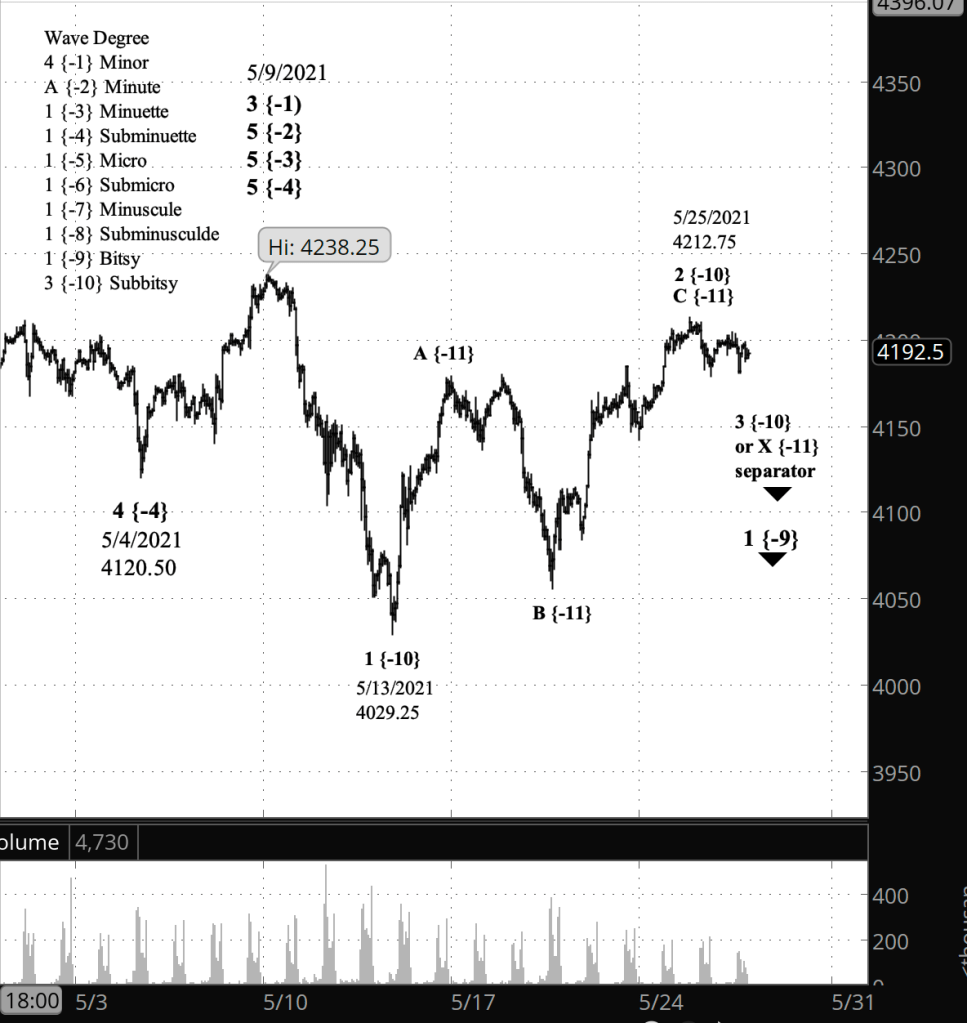
Half an hour before the closing bell. The S&P 500 fell during the day and then rose a bit, to 4199 on the futures. The price then dropped back by a few points. No change to my analysis from this morning. I’ve updated the chart.
9:55 a.m. New York time
What’s happening now? The S&P 500 E-mini futures rose slightly in overnight trading and then curled over in what appears to be a resumption of the decline that began yesterday from 4212.75.
What does it mean? Although it’s impossible to be certain this early in the game, the decline appears to be the early steps in the resumption of the downtrend that began on May 9. It eventually will reach below 4029.25, the start of an upward correction that ended yesterday.
What’s the alternative? It’s a period of vast uncertainty in the markets.
1) Possibly, the decline is a small downward correction within the larger upward correction that began on May 9. If that’s the case, then the price will reverse and reach above 4212.75.
2) Or, it could be that the decline is a separator in a compound correction, following the end of one corrective pattern and the preceding that start of another. In which case, we’ll see more bouncing around within a relatively narrow range.
3) And if the price reverses and rises above the start of the larger downtrend that began on May 9 from 4238.25, then the uptrend that began last year is still underway and higher prices lie ahead.
[S&P 500 E-mini futures at 3:30 p.m., hourly bars, with volume]
What does Elliott wave theory say? So, here’s the lineup as succinctly as I can put it.
Principle: Wave 3 of Subbitsy degree within wave 1 of Bitsy degree began on May 25 and will see a signifiant decline.
Alt 1: Wave 2 of Subbitsy degree within wave 1 of Bitsy degree is still underway and will see a further rise.
Alt 2: Wave X within wave 2 of Subbitsy degree is underway and will be followed by another corrective pattern.
Alt 3: Wave C of indeterminate degree within uptrending wave 5 of Subminuette degree is underway and will be followed by a rise above the May 9 high of 4238.25, continuing the uptrend that began last year after the crash early in the pandemic.
Half an hour before the closing bell. The S&P 500 continued to decline from its overnight peak of 4212.75. The further the decline from that price, the stronger the argument in favor of the peak being the end of wave 2 of Subbitsy degree and the beginning of wave 3 to the downside. The alternative analyses are that the decline from the peak is an X-wave separator within wave 2, which would be starting a complex pattern. Or the decline could be a small downtrend within the continuing rise of wave c within wave 2 of Subbitsy degree. Chart updated.
9:40 a.m. New York time
What’s happening now? The S&P 500 E-mini futures continued a slow rise in overnight trading, reaching a high of 4212.75 before the opening bell.
What does it mean? The correction that began on May 13 from 4029.25 continues. In yesterday’s post I gave detailed analysis of the implications of the chart, along with three alternative interpretations. That analysis still stands, with a slightly higher high.
[S&P 500 E-mini futures at 3:30 a.m., 210-minute bars, with volume]
What does Elliott wave theory say? Wave c within wave 2 of Subbitsy degree continues. See yesterday’s post for a detailed discussion of the waves.
My trades. Under my trading rules, today marks the beginning of the entry period for options expiring July 16, with June 1 being the optimal entry date, 45 days prior to expiration. I’ll be assessing prospects beginning today.
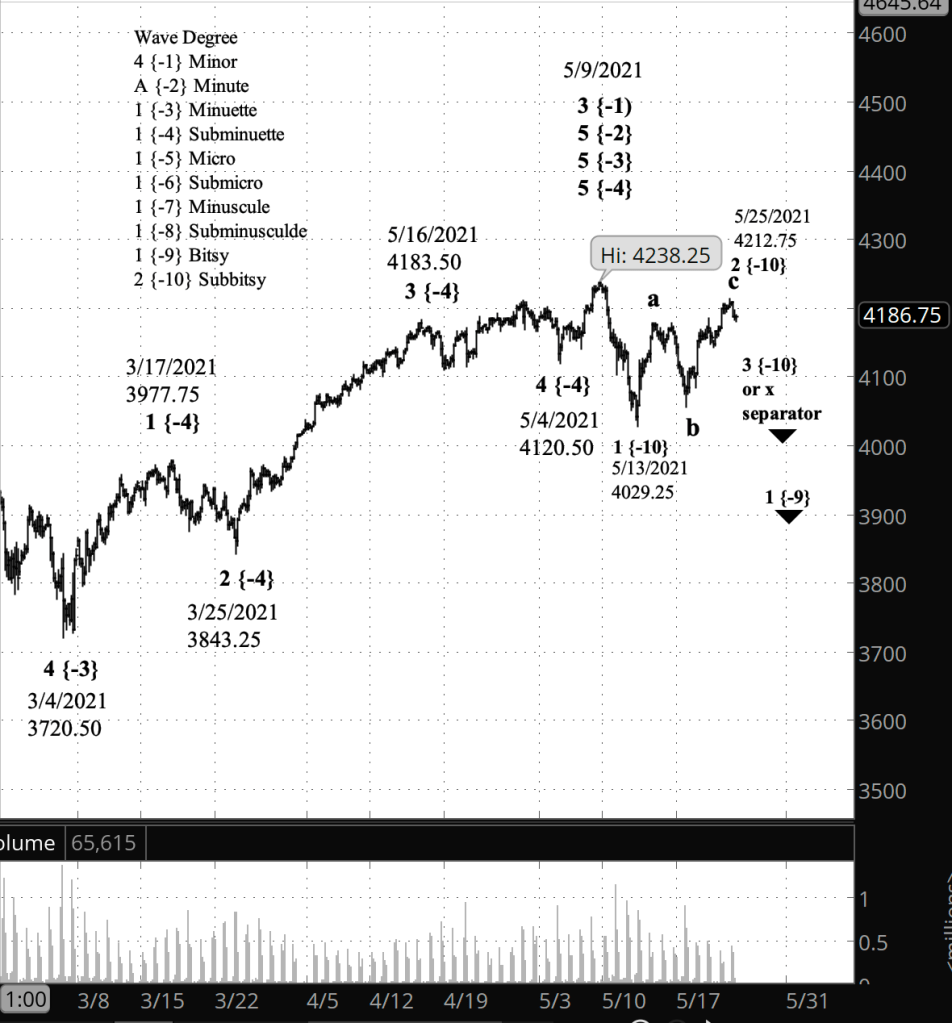
Half an hour before the closing bell. The S&P 500 rose slightly during the trading day, so far to 4206.25 on the futures and 4209.52 on the index. No change in the analysis. Chart updated.
10:15 a.m. New York time
What’s happening now? The S&P 500 E-mini futures rose slightly in overnight trading, to 4182.50, remaining below Friday’s high of 4185.
What does it mean? Friday’s high fulfilled the requirements for the correction that began May 13 from 4029.25; and my labeling of the chart reflects that interpretation. Under this scenario, the end of the correction will be followed by an energetic decline, the middle portion of a larger downtrend that began on May 9 from 4238.25.
What are the alternatives? There are three, all of nearly equal likelihood with my principle analysis.
The upward correction is not yet complete.
The correction will take a compound form.
The downtrend that began on May 9 is instead a large-scale correction of the rise that began March 4.
I describe each in greater detail in the Elliott wave theory section, below.
[S&P 500 E-mini futures at 3:30 p.m., 210-minute bars, with volume]
What does Elliott wave theory say? Under the principle analysis, an uptrending correction, wave 2 of Bitsy degree, was completed by last Friday’s high (4185 on May 21), and begun its 3rd wave, an energetic decline that will move beyond the end of the preceding wave 1, 4029.25. It is that move below the end of wave 1 that will confirm this analysis.
The alternatives:
Although Friday’s high fulfills all requirements for wave 2, there’s no guarantee that it won’t move higher. For this alternative to be correct, the price must remain below the start of wave 1 on May 9, from 4238.25.
Usually, compound wave forms are an occurrence in 4th waves, but 2nd-wave compounding isn’t unheard of. Under this scenario, the present peak will be followed by a shallow decline, an X wave that will separate the first corrective pattern from a second corrective pattern, the latter taking the form of a Zigzag, a Flat or a Triangle.
This kicks in if the present rise moves above the start of wave 1, 4238.25. It means that the wave 1 decline should be labeled wave A of Bitsy degree, followed by a rising wave B rise (labelled “a” on the chart, which tracks the principle analysis), and then a falling wave C (labelled “b” in the principle analysis). The rise from the end of wave C are the early portions of a rise that will continue the uptrend that began on March 4. wave 5 of Minuette degree. I consider this to be the least likely alternative, based on the wave count prior to the May 9 high, but it’s not an impossibility.
So we’re at a complex turning point. Elliott wave analysis describes the possible paths that lie ahead, but doesn’t predict which path actually will lead us forward.
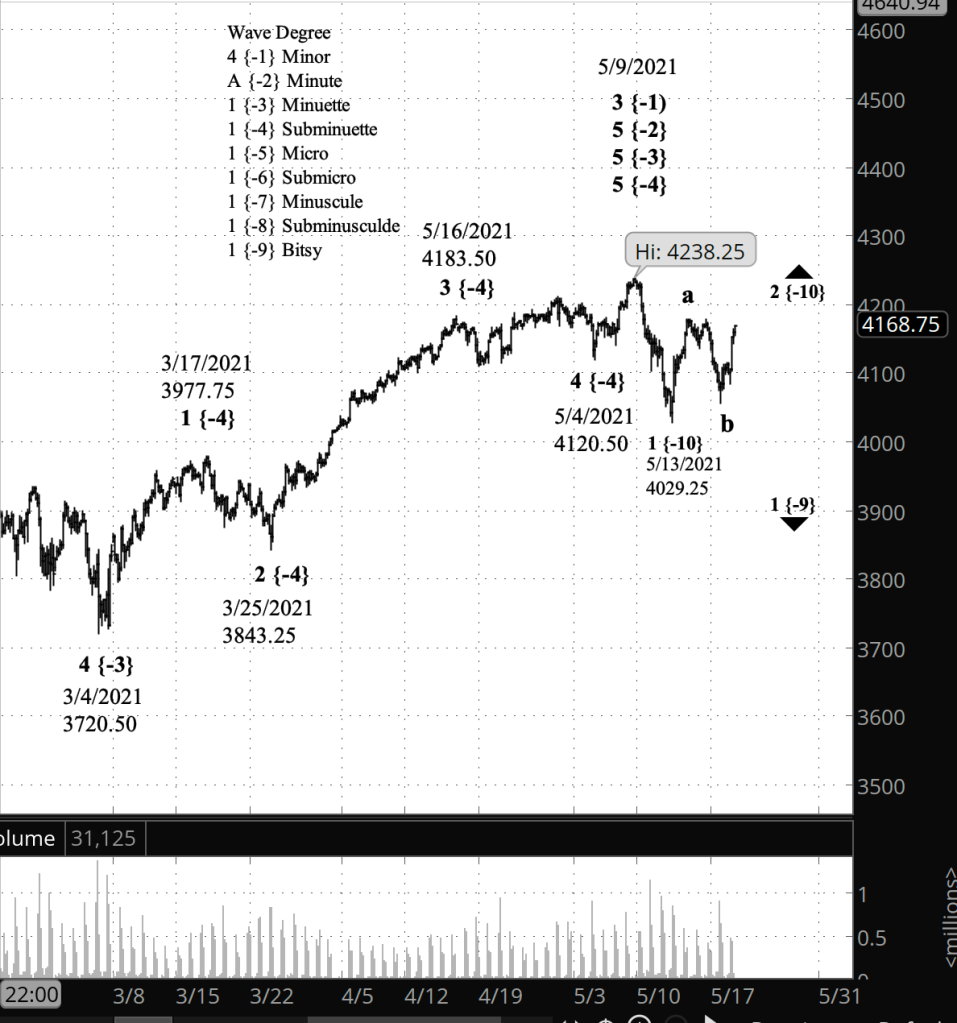
Half an hour before the closing bell. The S&P 500 reached a new high in the uptrending correction that began May 13, up to 4185 on the futures, 4188.72 on the index. The pattern has met the minimum requirements for a C wave within wave 2 of Subbitsy degree, although that’s no guarantee that today’s peak is indeed the end of wave C. A decline below 4029.25, the start of Subbitsy 2, will confirm that wave 3 of Subbitsy degree, to the downside, is now underway. I’ve updated the short-term chart below.
10:05 a.m. New York time
What’s happening now? The S&P 500 E-mini futures traded in a narrow range overnight.
What does it mean? The final leg of an upward correction that began on May 13 continues its rise. It will be followed by an energetic decline as the downtrend that began May 9 continues.
What’s the alternative? A move above the May 9 peak — 4238.25 on the futures, 4238.04 on the index — would mean that the decline from that level was correction within a continuing uptrend that has been underway for months.
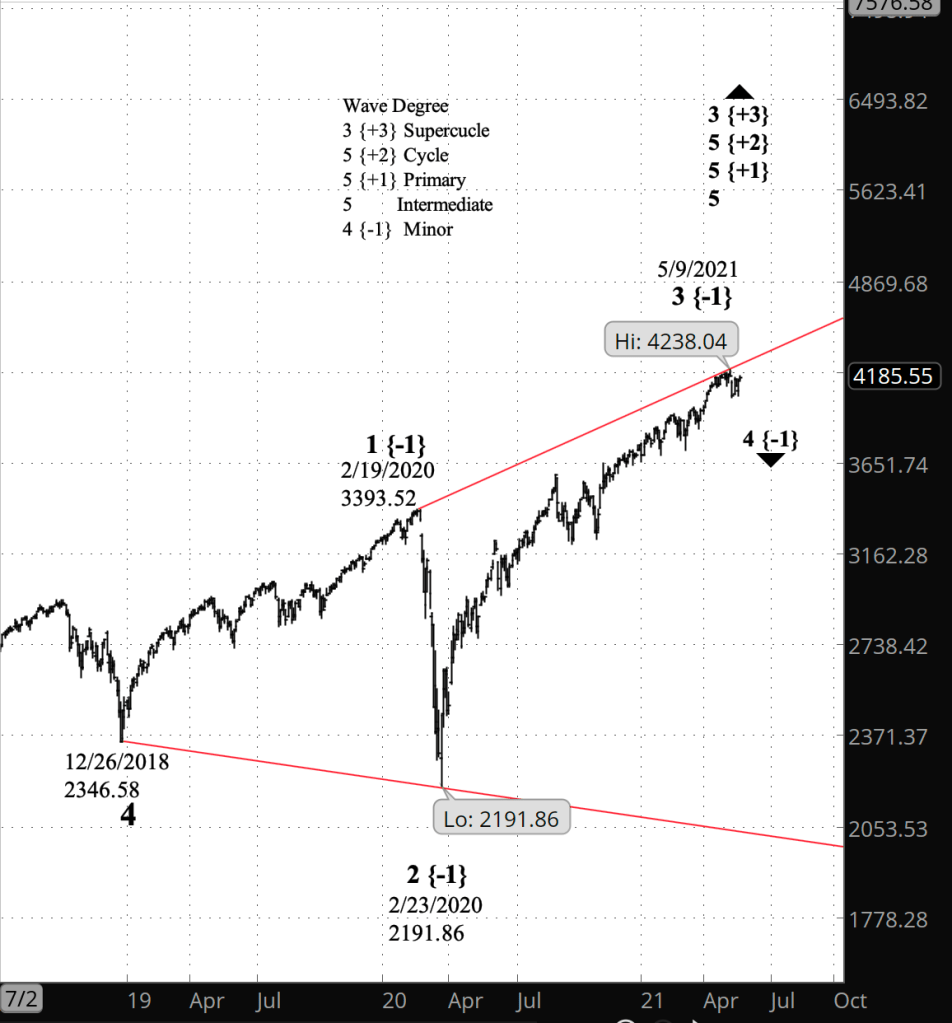
What’s the bigger picture? The price remains below the upper boundary, defined by the May 9 peak, of a large-scale expanding diagonal triangle that began on December 26, 2018. The decline from May 9 is the 4th leg within the triangle and can be expected to eventually reach the lower boundary, presently just above 2000 on the index. The 3rd leg’s journey, boundary to boundary, took more than 14 months to complete, and I would a expect a similar timeframe for the 4th leg.
[S&P 500 E-mini futures at 3:30 p.m., 210-minute bars, with volume]
What does Elliott wave theory say? Close up: The decline from May 9 is a 1st wave of Bitsy degree within a series of 1st waves of progressively higher degree, all the way to Minuette degree. Within the Bitsy degree, wave 1 of Subbitsy degree ended on May 13 and the wave 2 correction of Subbitsy degree is now underway, in its rising C wave internally. I expect the end of wave C to complete wave 2, since 2nd waves are less likely to extend in compound patterns.
A move above the start of wave 10 of Subbitsy degree would mean that May 9 wasn’t the peak of the uptrend and would require a full reanalysis under the rules of Elliott wave theory, treating the decline from May 9 as a downward correction within a continuing uptrend.
[S&P 500 index at 10:01 a.m., 2-day bars]
Big picture: The peak of May 9 completed wave 3 of Minor degree and began Minor wave 4, which will eventually — perhaps in 2022 — reach the lower boundary of the expanding diagonal triangle that began in late 2018. Minor 4 will be followed by Minor wave 5, which will work its way back up to the upper boundary of the triangle, which by then will have expanded to well beyond the May 9 high. Minor wave 5 will complete the triangle, along with a series of 5th waves of progressively higher degrees, up to Cycle degree, and marking the end of wave 3 of Supercycle degree, which began in 1932, when markets began to recover from the Crash of 1929. Supercycle 3 will be followed by a 4th wave correction to the downside.
Half an hour before the closing bell. The S&P 500 rose through the day, as wave C within wave 2 of Subbitsy degree continued. No change in the analysis. Chart updated.
10 a.m. New York time
What’s happening now? The S&P 500 E-mini futures continued to rise in overnight trading, reaching a high so far today of 4135.
What does it mean? Continuation of the rise situates the S&P 500 in the middle wave of a three-wave correction to the upside.
What’s the alternative? If the price should rise above the May 9 high of 4238.25, then the decline that ended on May 13 was a downward correction and the rise that began on months earlier is continuing.
[S&P 500 E-mini futures at 3:30 p.m., 210-minute bars, with volume]
What does Elliott wave theory say? By my principle analysis, the wave 2 of Subbitsy degree correction that began on May 13 has completed its first internal wave A to the upside and its second, wave B to to the downside. The present rise is wave C to the upside. Second waves typically are simple Zigzags, so the completion of wave C will likely end Subbitsy wave 2 and mark the start of Subbitsy wave 3, an energetic move to the downside. This is all happening within the 1st wave of Bitsy degree and higher, the first tentative steps of a significant downtrend.
By my alternative analysis, the decline that began on May 9 is a continuation of a 4th wave correction within wave 5 of Minuette degree, which began on March 4.
Half an hour before the closing bell. The S&P 500 E-mini futures fell to 4055.50 and then reversed, rising slightly. The B-wave low was was beyong a 79% retracement of the preceding A wave within the wave 2 of a Bitsy degree upward correction that began on May 13. B waves in a Zig-zag pattern tend to retrace no more than 79%, but it’s a guideline, not a firm rule. The rapid retreat from the low suggests that upward wave C within Bitsy wave 2 has begun, although it’s not a certainty.
“Nothing is but what is not.” –William Shakespeare, “Macbeth” (1605).
10 a.m. New York time
What’s happening now? The S&P 500 E-mini futures continued to decline, reaching into the 4060s in overnight trading, more than 100 points below the May 18 peak of 4179.30
What does it mean? The lower the price goes, the stronger the argument that the upward correction that began from 4029.25 on May 13 has ended, and the middle leg of the downtrend that began on May 9, from 4238.25, has begun. The price remains above 4029.25, the end of the 1st leg of the downtrend. A decline below that level confirm that the upward correction has ended.
What’s the alternative? Until then, the possibility remains that the upward correction is still underway and the price will resume its rise, moving above 4179.30, the peak attained on May 18.
[S&P 500 E-mini futures at 3:30 p.m., 210-minute bars, with volume]
What does Elliott wave theory say? By my principle count, wave 2 of Bitsy degree is still underway, with the decline from May 18 being wave B within wave 2.
B waves tend to retrace no more than 79% of the preceding A wave, which in this case would put the maximum retracement at 4060.75 on the futures. The low so far today has been 4061. So if the principle count is correct, a C wave to the upside has begun or will be beginning soon.
Under the alternative count, the decline from the May 18 peak is wave 3 of Bitsy degree. Third waves tend to be the most energetic of a trend, and wave 3 will carry the price below the end on May 13 of the the preceding wave 1 of Bitsy degree. A move below below 4029.25, the end of wave 1, will confirm that the alternative count is correct and wave 3 is underway.
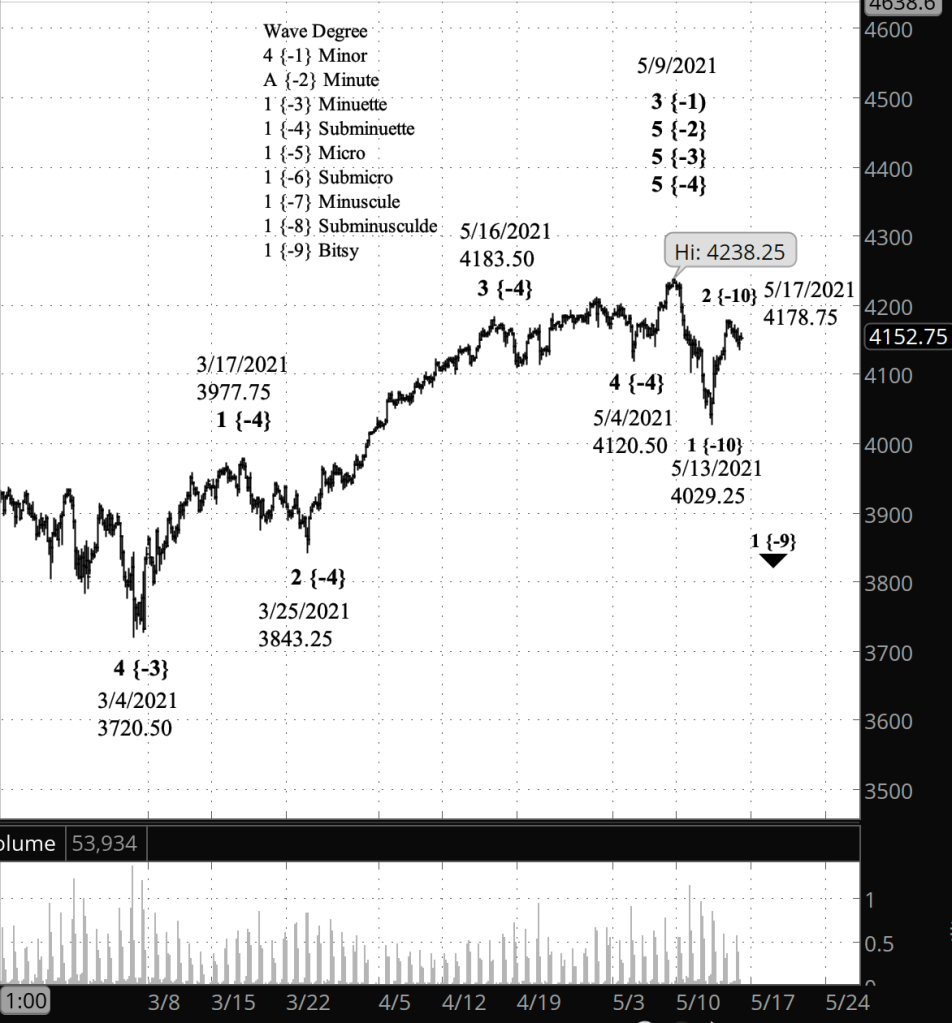
Half an hour before the closing bell. The S&P 500 continued to meander quietly within a narrow range, staying below the overnight high. No change to the analysis. Chart updated.
9:35 a.m. New York time
What’s happening now? The S&P 500 E-mini futures reached a new high in overnight trading — 4179.50 — less than a point above Monday’s high.
What does it mean? The upward correction that began on May 13 continues and may with the overnight high have reached its peak.
What’s the alternative? … or perhaps 4179.50 isn’t the peak. The upward correction is within a larger downtrend and is within the rules of Elliiott wave analysis as long as the price remains below the start of the downward, 4238.25 on May 9. It’s also possible that the downtrend that began on May 9 is a correction within an ongoing uptrend, which would become the principle analysis should the price move above 4238.25.
[S&P 500 E-mini futures at 3:30 p.m., 180-minute bars, with volume]
What does Elliott wave theory say? The upward correction is wave 2 of Subbitsy degree within wave 1 of Bitsy degree, the very early subwaves of the downtrend that began May 9. Subbitsy wave 2 will be followed by a 3rd wave that will carry the price below 4029.25, which is where Subbitsy 2 began.
Elliott wave rules forbid a 2nd wave moving beyond the beginning of the previous 1st wave of the same degree, in this case a move above 4238.25. If that were to happen, then the downtrend would be seen as a downward correction within an ongoing uptrend, wave 5 of Minuette degree, which began on October 30, 2020 from 3225.
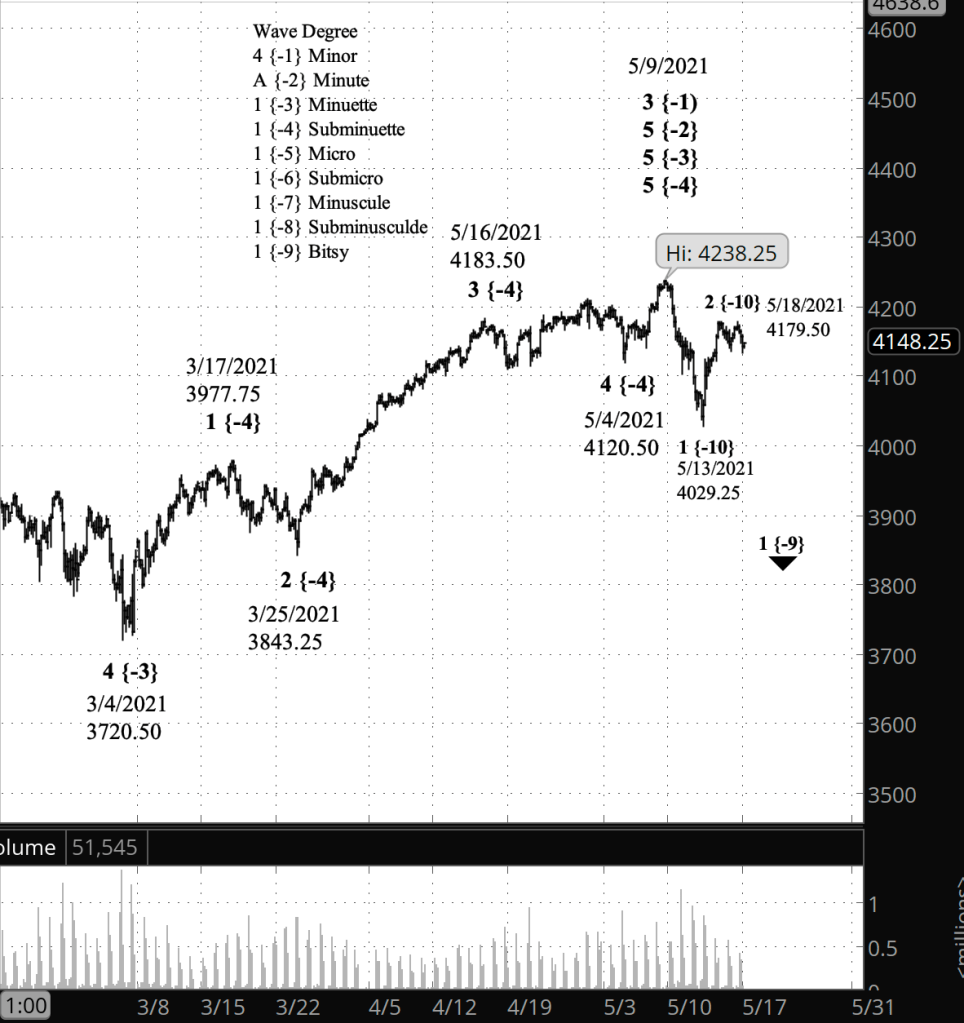
Half an hour before the closing bell. The S&P 500 barely budged throughout the day, remaining below the overnight high of 4178.75. No change to the analysis. Chart updated.
9:40 a.m. New York time
What’s happening now? The S&P 500 E-mini futures drifted higher, to 4178.75, when trading resumed Sunday evening and continued to trade slightly below that level
What does it mean? The overnight high might mark the end of a correction that began on May 13. The correction will be followed by an energetic movement to the downside, reaching below 4029.25, the correction’s starting point.
What’s the alternative? The Sunday evening high and small decline might well be a pause in the correction, which will continue higher.
[S&P 500 E-mini futures at 3:30 p.m., 210-minute bars, with volume]
What does Elliott wave theory say? The correction is wave 2 of Subbitsy degree, an early small-degree portion of a larger correction to the downside that began on May 9 from 4238.25. Subbitsy 2 will be followed by a declining Subbitsy wave 3. Third waves tend to be quite energetic, so I’m looking for a bit of drama when that wave 3 kicks in.

You must be logged in to post a comment.