SP500 Analysis

3:30 p.m. New York time

Half an hour before the closing bell. The S&P 500 decline below the sideways movement that has defined it since the November 5 peak. The decline adds a bit of weight to the idea that November 5 marks the end of wave 3 of Subminscule degree, and that the 4th wave has begun. The 4th wave target range, discussed below, remains valid. I’ve added a new chart with the revised mark-up, leaving this morning’s chart with the old mark-up for comparison.

What I’ve marked after November 5 as waves 1 , 2 and 3 with a {-10} subscript, indicating Subbitsy degree, may well be a or two below Subbitsy. The chart will gain clarity as the post-November 5 decline develops.
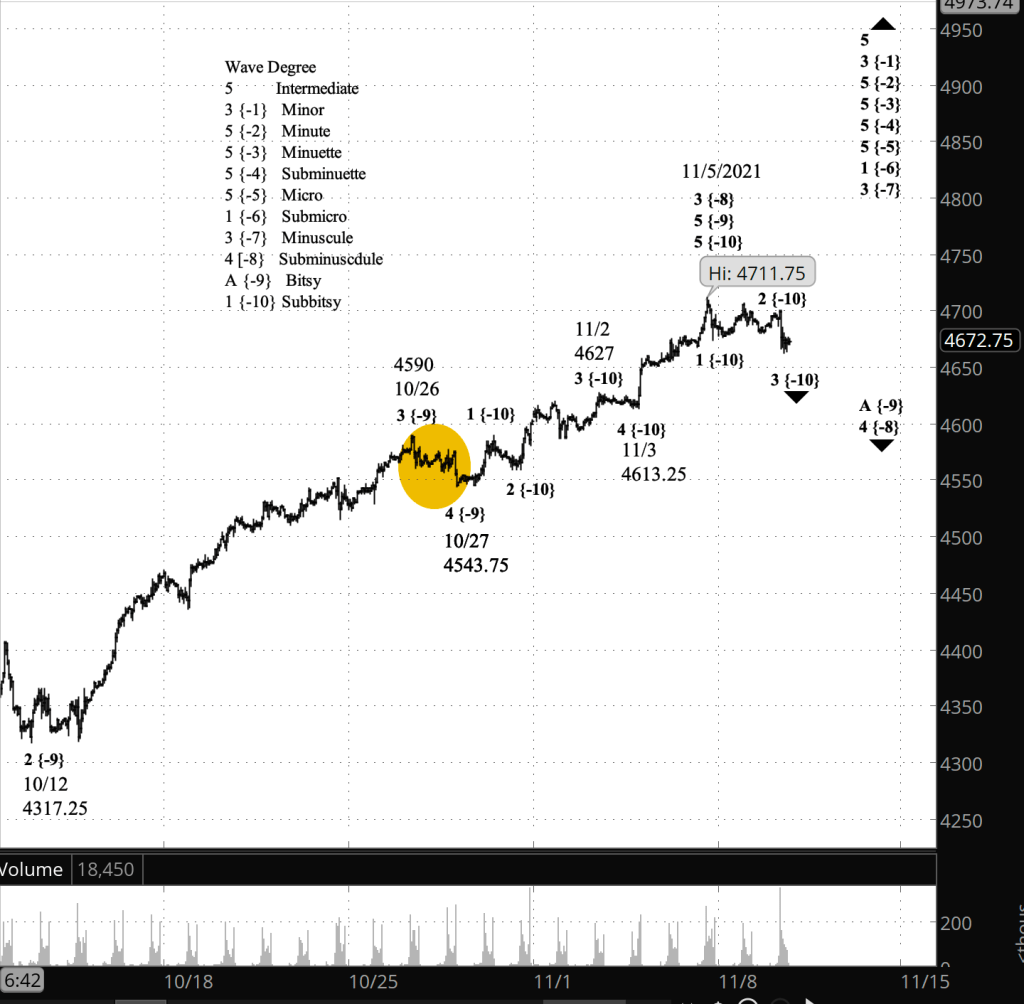
[Revised mark-up: S&P 500 E-mini futures at 3:30 p.m., 57-minute bars, with volume]

1:35 p.m. New York time

My trades. Today is the last day under my rules to enter an options spread position using contracts that expire December 17. The ambiguity that I see in the S&P 500 also exists in various forms in my prospective trades. So I’ll be trading simple long calls and puts, and shares, until the entry period for options expiring January 21. Entry runs from November 30 to December 14, with December 7 being the optimal date.

Meanwhile, my short bear call spread on FXI is slightly above the profit zone. It expires next week on Friday, and ideally I’ll be out of the position before the end of this week, for a profit or a small loss.

9:35 a.m. New York time

What’s happening now? The S&P 500 E-mini futures continued to move sideways, having completed three waves and embarked on a fourth.

What does it mean? If the price moves above the November 5 peak, 4711.75, then the correction is over and the uptrend has resumed.

What’s the alternative? If the price remains below 4711.75, then the chart is ensnared in a great deal of ambiguity. The correction seems too shallow to be at the level of the rise that began on October 27, or even down one level from that. I discuss the targets in the Elliott wave theory section below.

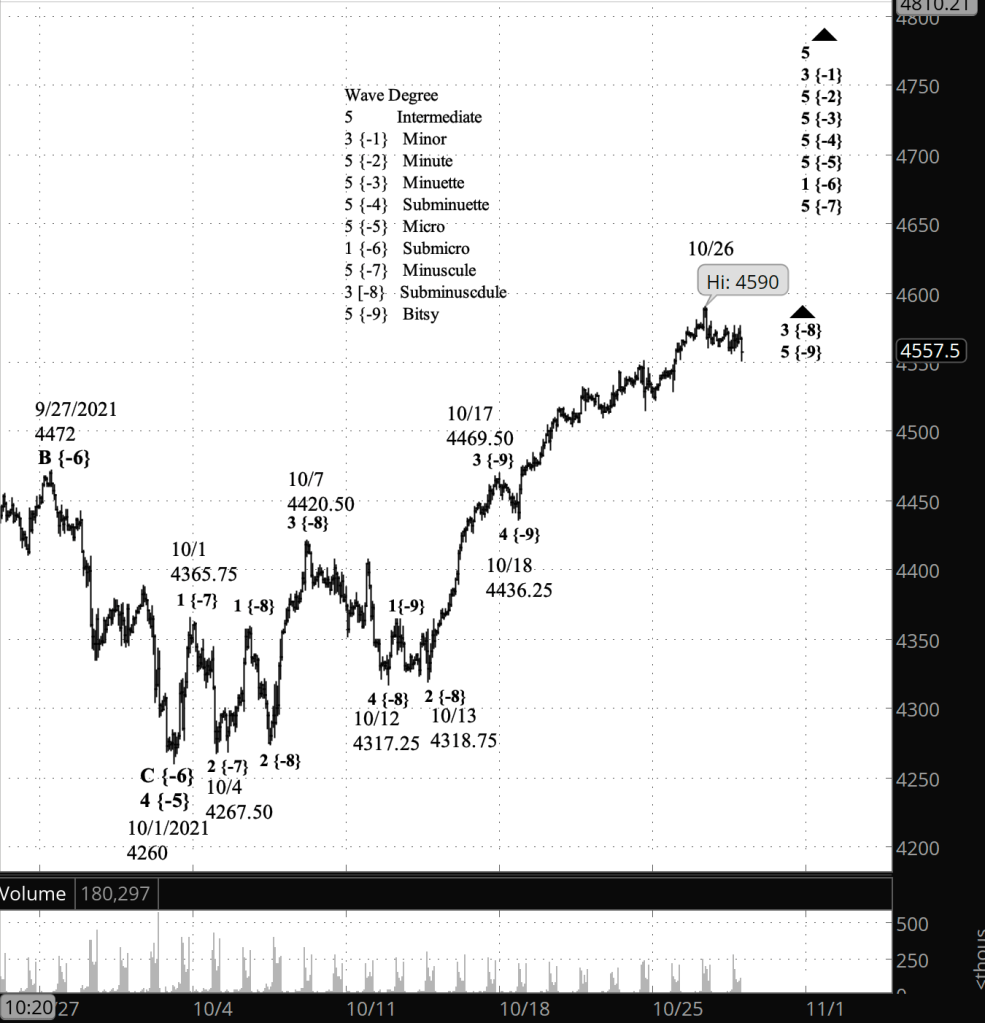
(The chart below is the old mark-up from this morning, which has the rise still underway. The chart above, posted shortly before the closing bell, shows the revised mark-up with the rise ending on November 5.)
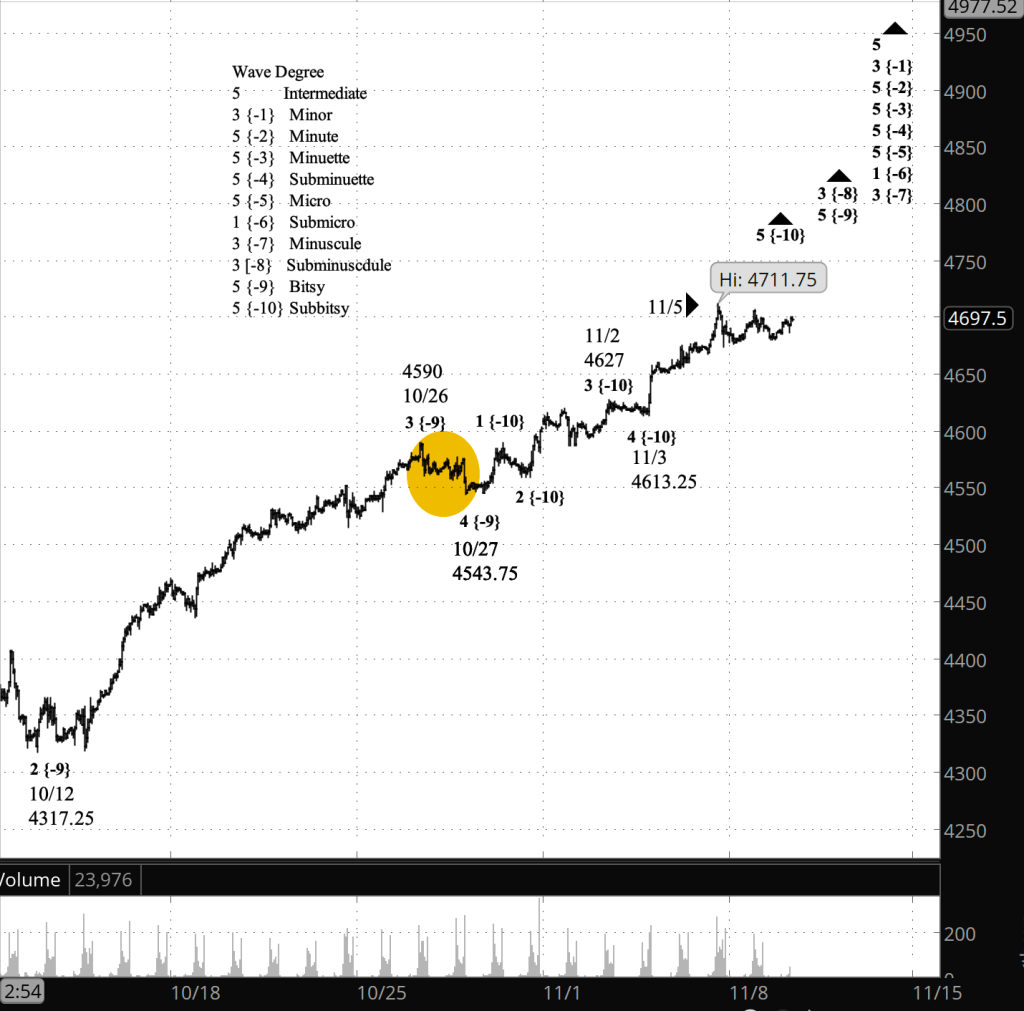
[Old mark-up: S&P 500 E-mini Futures at 9:35 a.m., 57-minute bars, with volume]

What does Elliott wave theory say? The S&P 500 is present in wave 5 of Subbitsy degree within wave 5 of Bitsy degree within wave 3 of Subminuscule degree. The sideways movement beginning November 5 is a 4th wave correction within wave 5 of Subbitsy degree.

A 4th wave differs in form from the prior 2nd wave of the same degree. That is, if wave 2 is a Zigzag, then wave 4 will most likely be a Flat. And indeed, within wave 3 of Subminuscule degree, Bitsy wave 2 was a Zigzag and so the 4th wave correction most likely will be a Flat or a Triangle.

If a 4th wave correction takes the form of a Flat, it tends to reach down into the range 4th wave one degree lower within the preceding 3rd wave. In this case, if wave 4 of Subminuscule degree has begun, it should reach down to the range of wave 4 of Bitsy degree within wave 3 of Subminuscule degree. I’ve marked that 3rd wave on the chart with a tan circle. The range is 4543.75 up to 4590.

The present sideways pattern at its lowest is 80 points above the target range. And so, is the correction a 4th wave of Subminuscule degree, or of some lower degree.

The target range is a tendency, not a firm expectation. So this extremely shallow correction could be wave 4 of Subminuscule degree. But it’s not a certainty, and I’ve refrained from labelling it that way on the chart.

The ambiguity can be resolved either by the price exceeding the November 5 peak, meaning that wave 3 of Subminuscule degree is still underway, or by the price declining to within, or at least close to, the range marked by the tan circle, which would mean that wave 4 of Subminuscule degree began on November 5.

Give the low degree of the conundrum, I expect a resolution of the question within days, a week or so at the longest. That’s a guess, not a guarantee.

Learning and other resources. Elliott wave analysis provides context, not prophecy. As the 20th century semanticist Alfred Korzybski put it in his book Science and Sanity (1933), “The map is not the territory … The only usefulness of a map depends on similarity of structure between the empirical world and the map.” And I would add, we can judge that similarity of structure only after the fact.

See the menu page Analytical Methods for a rundown on where to go for information on Elliott wave analysis.

By Tim Bovee, Portland, Oregon, November 9, 2021

Disclaimer

Tim Bovee, Private Trader tracks the analysis and trades of a private trader for his own accounts. Nothing in this blog constitutes a recommendation to buy or sell stocks, options or any other financial instrument. The only purpose of this blog is to provide education and entertainment.

No trader is ever 100 percent successful in his or her trades. Trading in the stock and option markets is risky and uncertain. Each trader must make trading decisions for his or her own account, and take responsibility for the consequences.

License
Creative Commons License

All content on Tim Bovee, Private Trader by Timothy K. Bovee is licensed under a Creative Commons Attribution-ShareAlike 4.0 International License.

Based on a work at www.timbovee.com.
SP500 Analysis

3:30 p.m. New York time

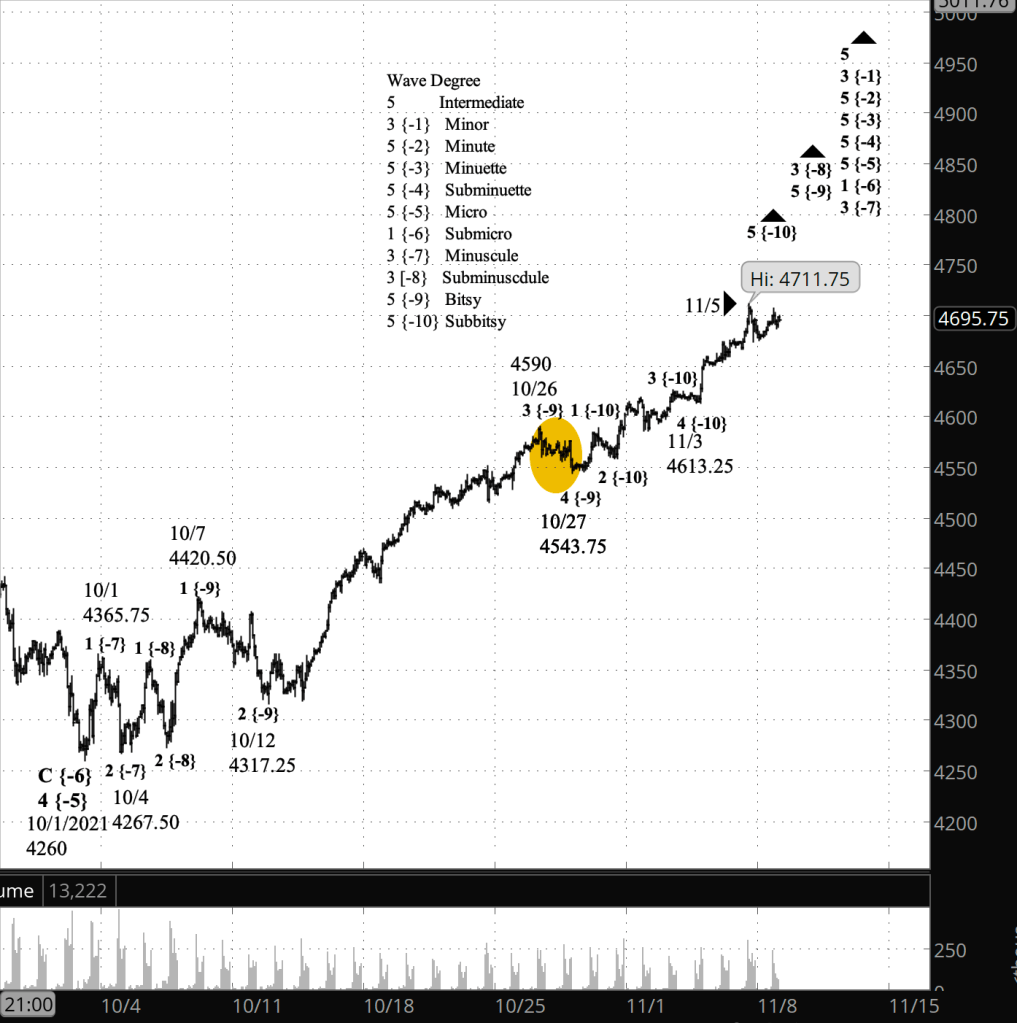
Half an hour before the closing bell. The S&P 500 has remained below Friday’s peak so far in the trading session. The price has traced three waves down, three waves up, and now has entered the last leg, which should have five waves internally. The problem with this analysis is that the price is barely 10 points below the peak, and the more likely target would bee around 100 points below the peak. There’s something happening here, but what it is isn’t exactly clear. I’ll retain my present count, that wave 3 of Subminuscule degree is still rising, until the chart regains its clarity.

9:35 a.m. New York time

What’s happening now? The S&P 500 E-mini futures moved up in overnight trading, so far remaining below Friday’s peak of 4711.75.

What does it mean? The rise could be a resumption of the uptrend that began November 3 and could lead to new heights.

What’s the alternative? Or the rise could be a small upward correction in a downtrend that began from the peak of November 5.

[S&P 500 E-mini futures at 3:30 p.m., 80-minute bars, with volume]

What does Elliott wave theory say? Under my principal analysis, wave 5 of Subbitsy degree within wave 5 of Bitsy degree within wave 3 of Subminuscule degree remains underway.

Under my alternative analysis, Subbitsy 5, Bitsy 5 and Subminuscule 3 ended at Friday’s peak, and the present wave is Subbitsy A within Bitsy A within Subminuscule 4, a correction that will most likely take the form of a Flat.

At this point, in my view, both analyses have an equal chance of playing out.

If Subminuscule 4 is a Flat, it’s likely target range is the boundaries of wave 4 of Bitsy degree within the preceding wave 3 of Subminuscule degree, ranging from 4543.75 up to 4590. I’ve marked that wave with a tan oval on the chart.

Learning and other resources. Elliott wave analysis provides context, not prophecy. As the 20th century semanticist Alfred Korzybski put it in his book Science and Sanity (1933), “The map is not the territory … The only usefulness of a map depends on similarity of structure between the empirical world and the map.” And I would add, we can judge that similarity of structure only after the fact.

See the menu page Analytical Methods for a rundown on where to go for information on Elliott wave analysis.

By Tim Bovee, Portland, Oregon, November 8, 2021

Disclaimer

Tim Bovee, Private Trader tracks the analysis and trades of a private trader for his own accounts. Nothing in this blog constitutes a recommendation to buy or sell stocks, options or any other financial instrument. The only purpose of this blog is to provide education and entertainment.

No trader is ever 100 percent successful in his or her trades. Trading in the stock and option markets is risky and uncertain. Each trader must make trading decisions for his or her own account, and take responsibility for the consequences.

License
Creative Commons License

All content on Tim Bovee, Private Trader by Timothy K. Bovee is licensed under a Creative Commons Attribution-ShareAlike 4.0 International License.

Based on a work at www.timbovee.com.
SP500 Analysis

3:30 p.m. New York time

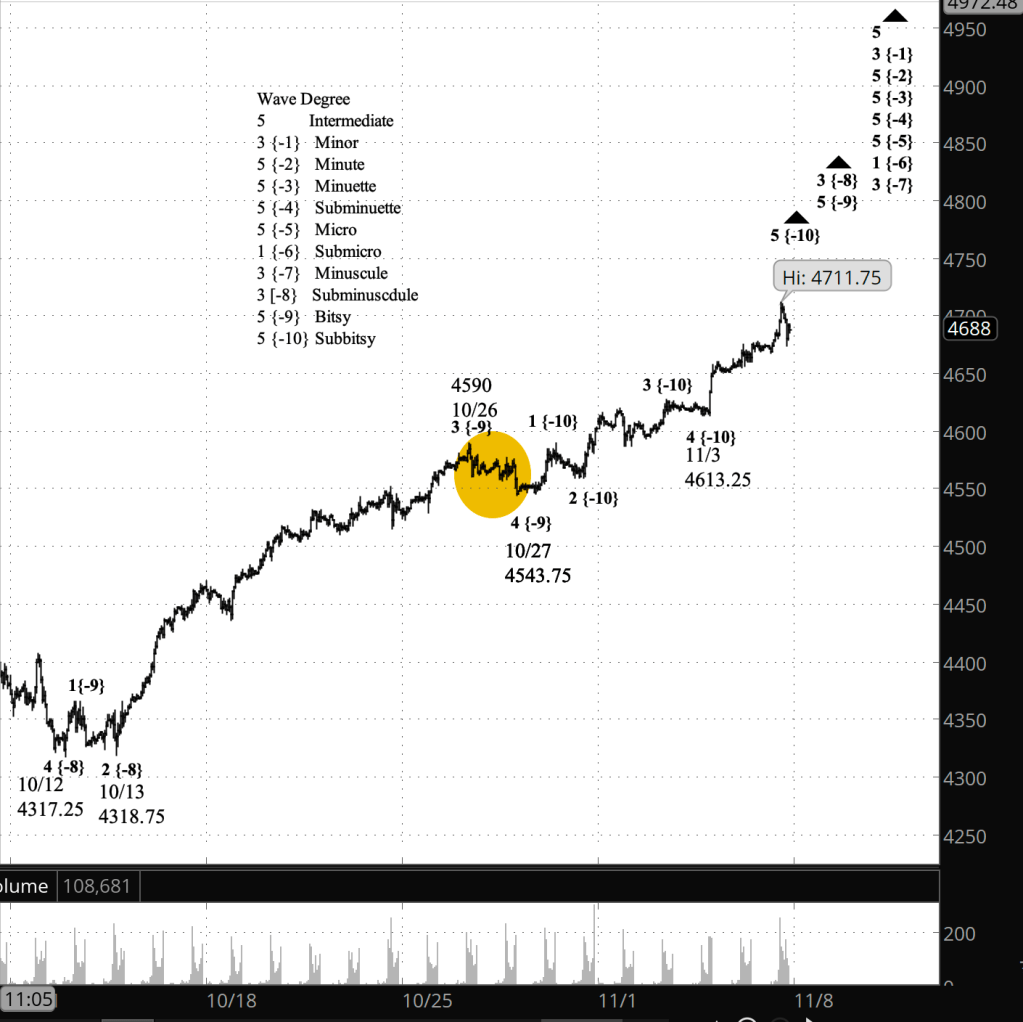
Half an hour before the closing bell. The S&P 500 peaked half an hour into the trading session and then declined, giving back its overnight gains. The peak was 4711.75 on the futures, 4718.50 on the index. The decline is not yet large enough to reach a conclusion that the peak ends the rise that began October 27. It might have done so, but then again, maybe not.

In Elliott wave analysis, there’s a trick of the trade. When a wave has fulfilled all of the requirements for completion, and yet has a small pullback and then a rise to even higher highs, the normal practice is to count that pullback and rise, and perhaps some earlier fluctuations, as being of a smaller degree; basically, the analyst pushes them down a degree, quite arbitrarily, in order for the count to work.

I’ll do that if the price reverses quickly and moves to a new peak. Otherwise, I’m going to wait for more decline, and then make a decision.

So how long should I wait? If today’s peak is in fact the end of of the rise from October 27 — wave 5 of Bitsy, it is also the end of wave 3 of the parent wave of Subminuscule degree. So the subsequent correction will be wave 4 of Subinuscule degree, probably a Flat, and it is likely to end within the price range of wave 4 of Bitsy degree within wave 3 of Minuscule degree. That Bitsy wave 4 declined from 4590 to 4543.75 (marked on the chart with a tan oval). And so if the price reaches the low 4600s, then I’ll be inclined to label the present wave as wave 4 of Subminuscule degree. That target range is something that often happens with 4th waves, but it’s not a rule, so the decline could be shallower or deeper. Which will make chart analysis decisions “interesting” over the next few days.

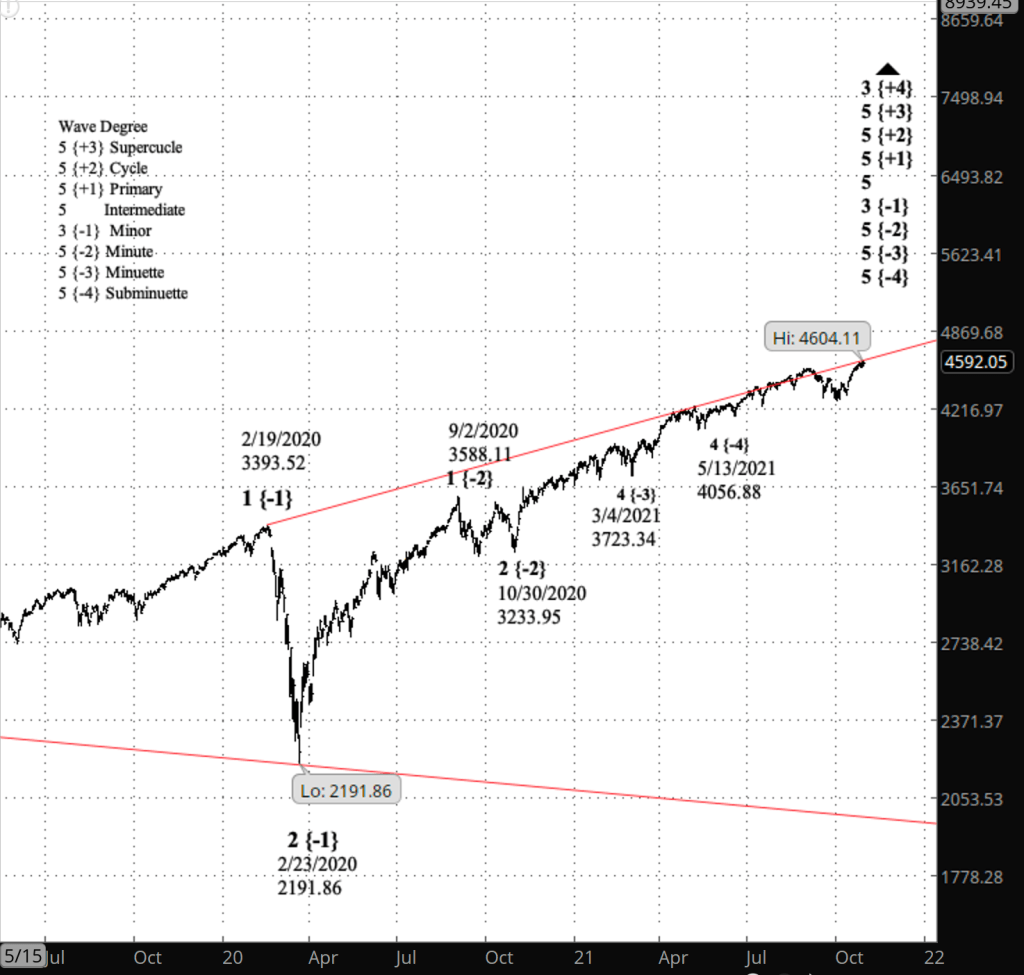
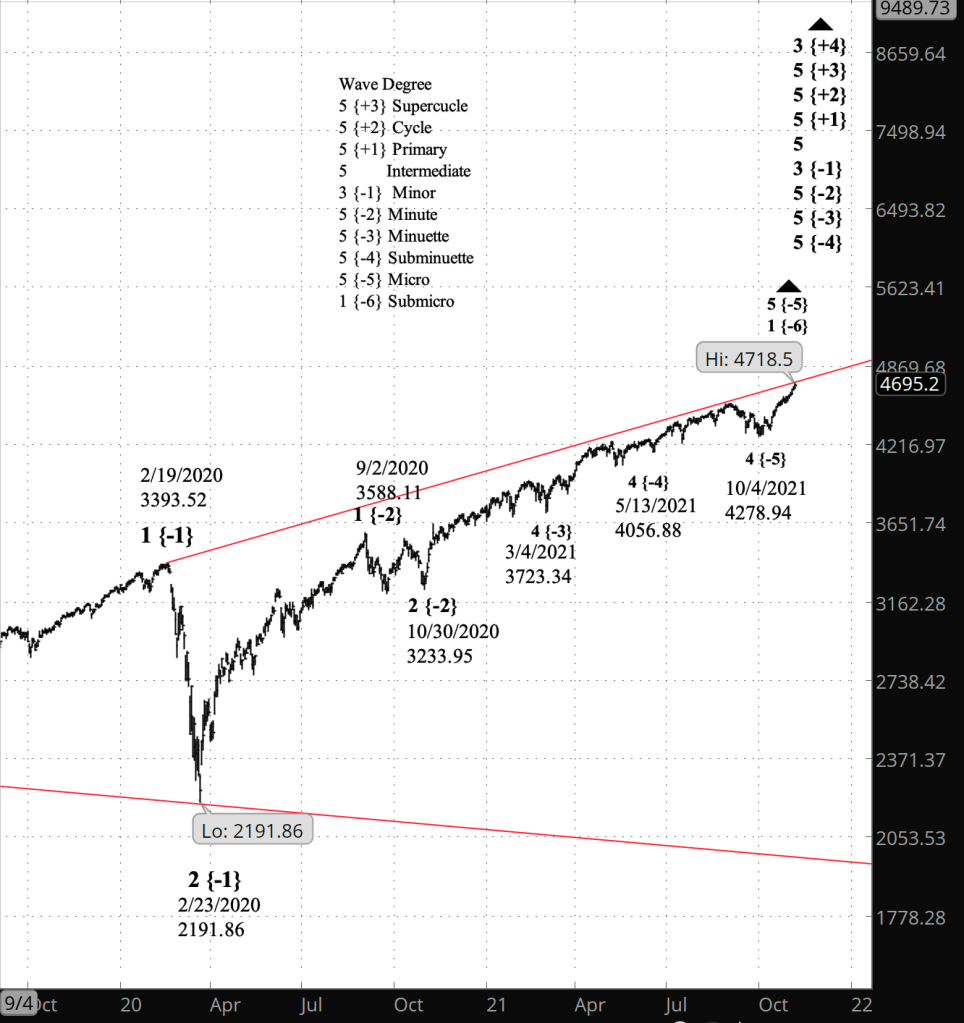
I’ve added in a longer-term chart showing the upper and lower boundaries of the expanding Diagonal Triangle, wave 5 of Intermediate degree, that began in December 2018. It is currently in its 3rd wave, of Minor degree, which began on February 23, 2020, at the end of the early pandemic market crash. In an Expanding Triangle, the boundaries keep moving further from each other, which creates additional room for upside potential without the price moving too far past the upper boundary.

9:37 a.m. New York time

What’s happening now? The S&P 500 E-mini futures rose to a new peak in overnight trading and the price moved still higher after the opening bell rang, so far to 4705 on the futures, 4712.28 on the index.

What does it mean? The rise that began November 3 continues.

What’s the alternative? Under the rules of Elliott wave analysis the rise has met all of the requirements for completion. Any peak could be, but won’t necessarily be, the end the rise.

[S&P 500 E-mini futures at 3:30 p.m., 55-minute bars, with volume]
[S&P 500 Index at 3:25 p.m., daily bars]

What does Elliott wave theory say? The rise from November 3 is wave 5 of Subbitsy degree within wave 5 of Bitsy degree within wave 3 of Subminuscule degree. Under Elliott, a move in the direction of the trend consists of five waves, so the rise is on its last leg at the Subbitsy and Bitsy degrees. Their completion will also be the end of wave 3 of Subminuscule degree, which began October 13. Subminuscule 3 will be followed by a 4th wave correction, likely taking the form of a Flat, in contrast to the Zigzag pattern of the preceding 2nd wave. In Elliott this is known as the Rule of Alternation. Subminuscule wave 4 will be followed by a 5th wave rise to new heights.

Learning and other resources. Elliott wave analysis provides context, not prophecy. As the 20th century semanticist Alfred Korzybski put it in his book Science and Sanity (1933), “The map is not the territory … The only usefulness of a map depends on similarity of structure between the empirical world and the map.” And I would add, we can judge that similarity of structure only after the fact.

See the menu page Analytical Methods for a rundown on where to go for information on Elliott wave analysis.

By Tim Bovee, Portland, Oregon, November 5, 2021

Disclaimer

Tim Bovee, Private Trader tracks the analysis and trades of a private trader for his own accounts. Nothing in this blog constitutes a recommendation to buy or sell stocks, options or any other financial instrument. The only purpose of this blog is to provide education and entertainment.

No trader is ever 100 percent successful in his or her trades. Trading in the stock and option markets is risky and uncertain. Each trader must make trading decisions for his or her own account, and take responsibility for the consequences.

License
Creative Commons License

All content on Tim Bovee, Private Trader by Timothy K. Bovee is licensed under a Creative Commons Attribution-ShareAlike 4.0 International License.

Based on a work at www.timbovee.com.
SP500 Analysis

3:30 p.m. New York time

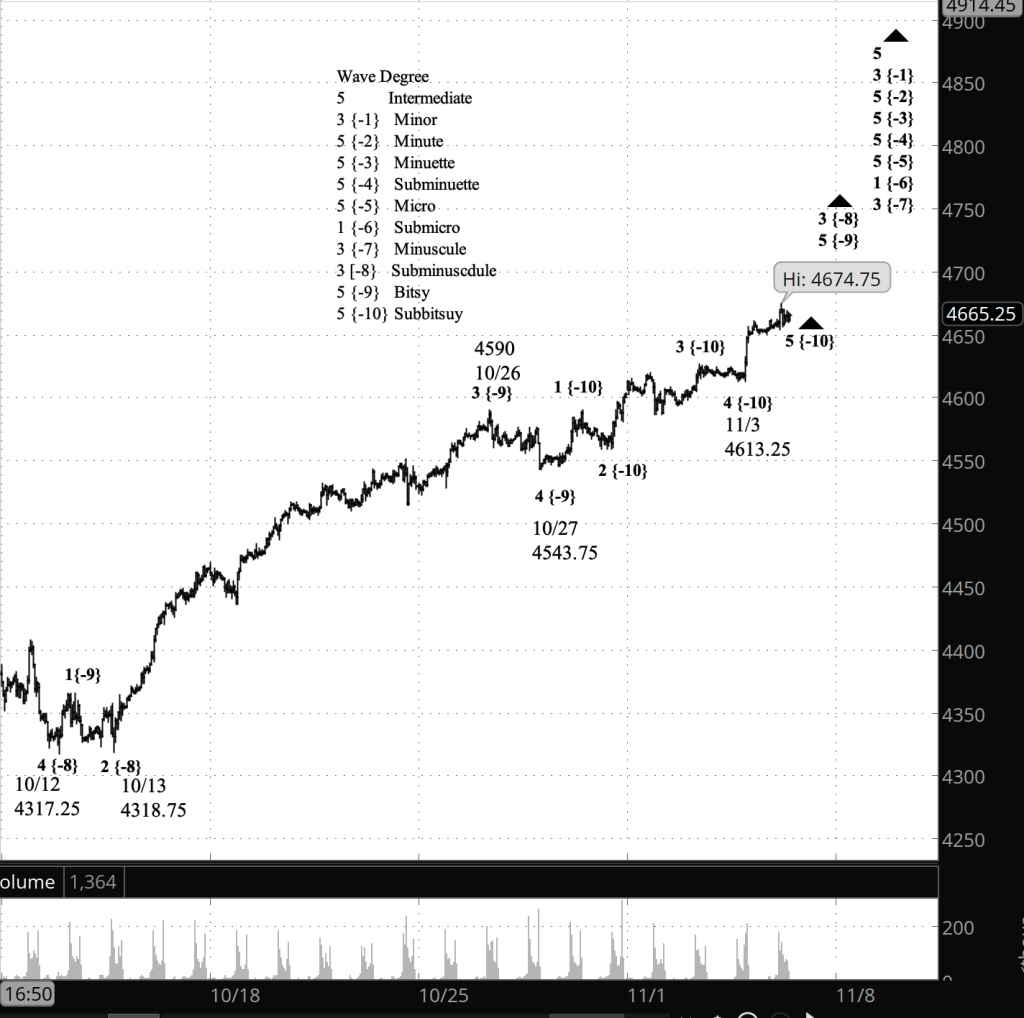
Half an hour before the opening bell. The S&P 500 moved to higher peak 40 minutes after the opening bell, to 4674.75 on the futures, 4683 on the index. Thereafter the price has so far traded in a narrow range. No change in the analysis. I’ve updated the chart.

9:35 a.m. New York time

What’s happening now? The S&P 500 E-mini futures attained a new high in overnight trading, 4662.50. The greater part of the rise that began with yesterday’s Federal Open Market Committee statement was complete by yesterday evening, and today’s early morning peak came during a sideways movement.

What does it mean? The price has met all of the requirements for completion of the rise that began on October 27 from 4543.75. However, there’s also no barrier to the rise continuing. I’ll discuss the matter further in the Elliott wave theory section. If the rise is complete, the next movement will be a 4th wave correction of the rise from late October.

What’s the alternative? As noted above, there’s ambiguity in whether the rise has further to go. There’s also ambiguity as to the degree — the size — of the rise. Does the end of the present rise mean the end of the rise that began on October 13? Or is it a lower level rise within a parent wave that has much further to go before reaching completion?

[S&P 500 E-mini futures at 3:30 p.m., 50-minute bars, with volume]

What does Elliott wave theory say? The rise from October 27 is wave 5 of Bitsy degree within wave 3 of Subminuscule degree, which began October 13 from 4318.75. Internally, Bitsy wave is in its 5th and final wave, of Subbitsy degree.

In Elliott, there is no limit to how high a 5th wave can go, nor any barrier to it being over with only a small rise.

On the chart, I’ve labeled the rise from October 27 as being of Subbitsy degree, but it’s possible that it could be a degree or even two degrees smaller, a 1st wave of Subbitsy degree. This would magnify the amount of upside we can expect.

In any case, the end of Subbitsy 5 also marks the end of Bitsy wave 5 and Subminuscule wave 3, and will be followed by a 4th wave correction of Subminuscule degree.

Learning and other resources. Elliott wave analysis provides context, not prophecy. As the 20th century semanticist Alfred Korzybski put it in his book Science and Sanity (1933), “The map is not the territory … The only usefulness of a map depends on similarity of structure between the empirical world and the map.” And I would add, we can judge that similarity of structure only after the fact.

See the menu page Analytical Methods for a rundown on where to go for information on Elliott wave analysis.

By Tim Bovee, Portland, Oregon, November 4, 2021

Disclaimer

Tim Bovee, Private Trader tracks the analysis and trades of a private trader for his own accounts. Nothing in this blog constitutes a recommendation to buy or sell stocks, options or any other financial instrument. The only purpose of this blog is to provide education and entertainment.

No trader is ever 100 percent successful in his or her trades. Trading in the stock and option markets is risky and uncertain. Each trader must make trading decisions for his or her own account, and take responsibility for the consequences.

License
Creative Commons License

All content on Tim Bovee, Private Trader by Timothy K. Bovee is licensed under a Creative Commons Attribution-ShareAlike 4.0 International License.

Based on a work at www.timbovee.com.
SP500 Analysis

3:30 p.m, New York time

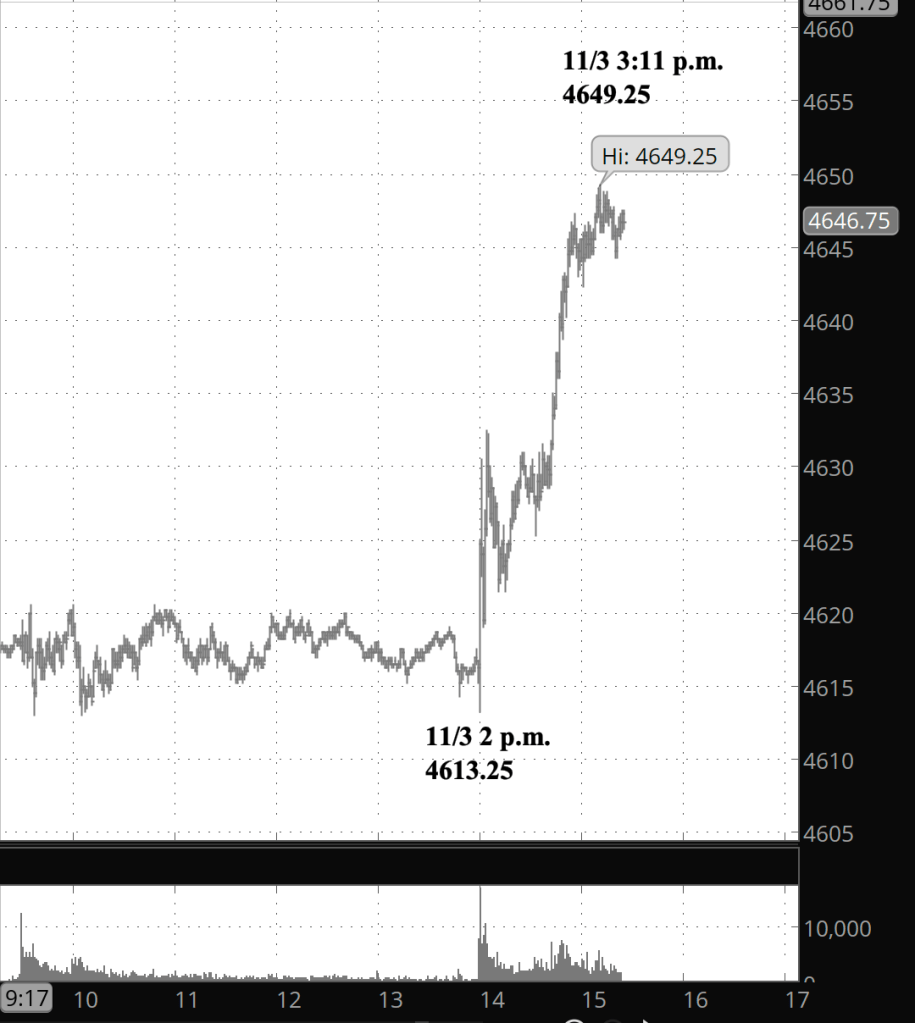
Half an hour before the closing bell. The S&P 500 began to climb immediately upon the release of the Federal Open Market Committee statement on monetary policy. The futures rose by 36 points in 71 minutes, from 4613.25 to 4649.25 and at present has fallen back a little in a correction of very low degree. In terms of the analysis, the low degree correction within wave 5 of Bitsy degree is over and the price is again trending upward.

I’ve added a very near term chart showing the rise and updated the longer term chart from this morning.

[S&P 500 E-mini futures at 3:25 p.m., 1-minute bars, with volume]

9:35 a.m. New York time

What’s happening now? The S&P 500 moved sideways in overnight trading, for the most part staying within 10 points of yesterday’s high of 4627 on the futures, 4635.15 on the index.

What does it mean? The movement can be interpreted as the second correction within the rise that began on October 27. Typically such corrections are shallow, without much in the way of drama.

What’s the alternative? The placement of the fluctuations within the rise from late October are open to interpretation. Is the present correction one level down from the top level of the rise? Two levels down? The answer as an impact mainly on the timing of future movements.

[S&P 500 E-mini futures at 3:30 p.m., 70-minute bars, with volume]

What does Elliott wave theory say? My analysis yesterday labeled the movement as down one degree, to the Subbitsy degree, from the parent wave 5 of Bitsy degree. It’s also possible that the degree is below the Subbitsy level. In any case, the end of the parent wave, the 5th of Bitsy degree, will mark the end of the parent wave 3 of Subminuscule degree and the beginning of a 4th wave correction, most likely a shallow Flat pattern, as 4th waves tend to be. It will be followed by a rise to new highs.

Learning and other resources. Elliott wave analysis provides context, not prophecy. As the 20th century semanticist Alfred Korzybski put it in his book Science and Sanity (1933), “The map is not the territory … The only usefulness of a map depends on similarity of structure between the empirical world and the map.” And I would add, we can judge that similarity of structure only after the fact.

See the menu page Analytical Methods for a rundown on where to go for information on Elliott wave analysis.

By Tim Bovee, Portland, Oregon, November 3, 2021

Disclaimer

Tim Bovee, Private Trader tracks the analysis and trades of a private trader for his own accounts. Nothing in this blog constitutes a recommendation to buy or sell stocks, options or any other financial instrument. The only purpose of this blog is to provide education and entertainment.

No trader is ever 100 percent successful in his or her trades. Trading in the stock and option markets is risky and uncertain. Each trader must make trading decisions for his or her own account, and take responsibility for the consequences.

License
Creative Commons License

All content on Tim Bovee, Private Trader by Timothy K. Bovee is licensed under a Creative Commons Attribution-ShareAlike 4.0 International License.

Based on a work at www.timbovee.com.
SP500 Analysis

3:30 p.m. New York time

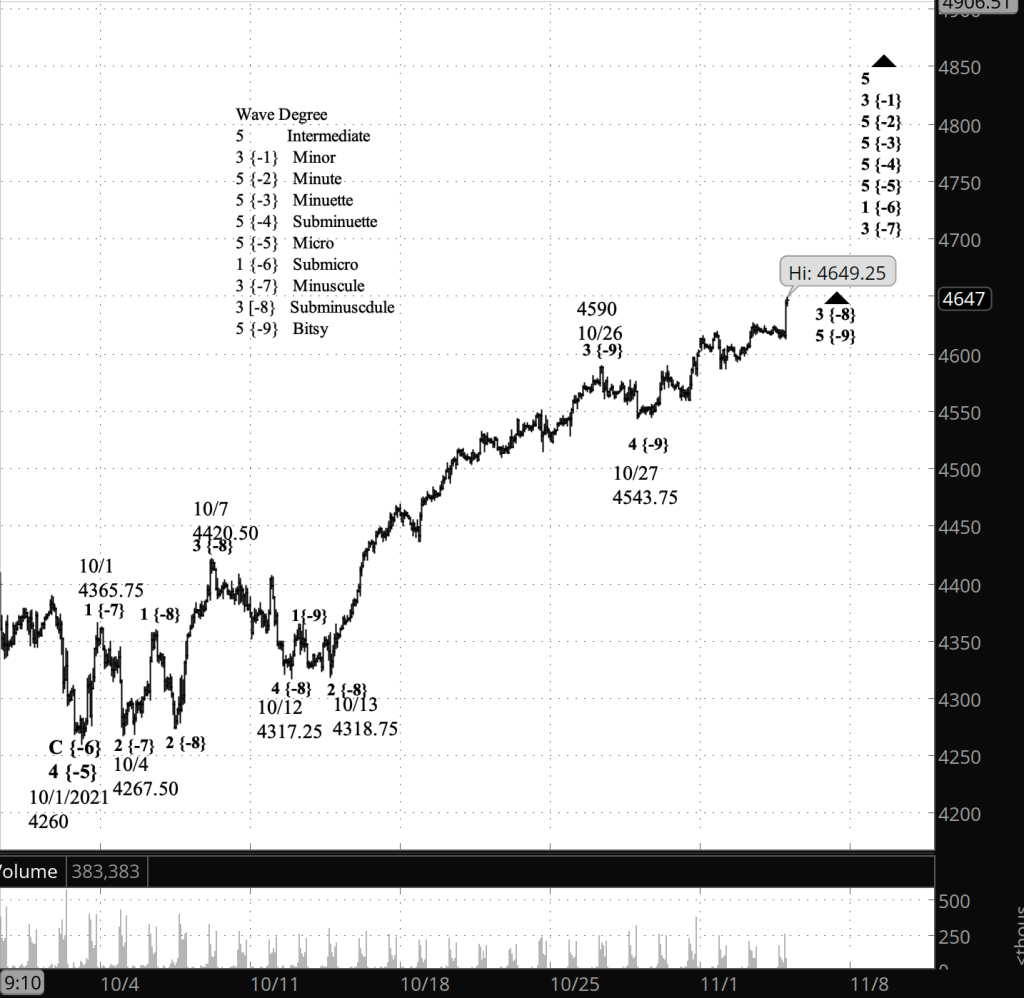
Half an hour before the closing bell. The S&P 500 has continued to rise through the trading session, reaching 4267 on the futures, 4635.15 on the index. The new highs exceed yesterday’s high, which means that wave 4 of Subbitsy degree within wave 5 of Bitsy degree is complete, and wave 5 of Subbitsy degree has begun. Alternatively, the degree could be smaller than Subbitsy. I’ve updated the chart.

9:35 a.m. New York time

What’s happening now? The S&P 500 E-mini futures remained below Monday’s peak, 4619.50, as the price traced a sideways pattern.

What does it mean? The shallow correction is the fourth leg of the rise that began October 27 and will be followed by a rise to new highs.

What’s the alternative? The ambiguities have to do with how long the correction might take and how far the price might rise after the correction. I discuss the possibilities in the Elliott wave section, below.

[S&P 500 E-mini futures at 3:30 p.m., 70-minute bars, with volume]

What does Elliott wave theory say? Under my principal analysis, the rise that began October 27 is wave 5 of Bitsy degree within wave 3 of Subminuscule degree, the larger wave having begun on October 13. Yesterday’s peak marked the end of wave 3 of Subbitsy degree within Bitsy wave 5, and the subsequent sideways movement is wave 4 of Subbitsy degree. After Subbitsy 4 is complete, Subbitsy wave 5 will rise to new highs. When Subbitsy wave 5 reaches its end, the parent, Bitsy wave 5, will be complete, as will the grandparent, Subminuscule wave 3. Subminuscule 3 will be followed by a larger 4th wave correction, most likely one that is shallow, following a Flat pattern.

The ambiguities surround the nature of the corrections, what form they will take and how much time each will consume before completion.

What I have called Subbitsy wave 4 could in fact be a smaller degree, one that must reach completion before its parent or grandparent wave, Subbitsy wave 3, is complete. Degrees in Elliott wave theory always have a bit of ambiguity.

In any degree, 4th waves tend to be Flats, trending sideways, but sometimes they trace Triangles, which can have more verticality, or compound structures, containing two Flats, a Flat and a Zigzag or a Flat and a Triangle in some order.

The same ambiguity applies to the future and larger 4th wave of Subminuscule degree.

So based on the analysis, we know that there will be higher highs in the near future. How high and when it will happen remain uncertain.

Learning and other resources. Elliott wave analysis provides context, not prophecy. As the 20th century semanticist Alfred Korzybski put it in his book Science and Sanity (1933), “The map is not the territory … The only usefulness of a map depends on similarity of structure between the empirical world and the map.” And I would add, we can judge that similarity of structure only after the fact.

See the menu page Analytical Methods for a rundown on where to go for information on Elliott wave analysis.

By Tim Bovee, Portland, Oregon, November 2, 2021

Disclaimer

Tim Bovee, Private Trader tracks the analysis and trades of a private trader for his own accounts. Nothing in this blog constitutes a recommendation to buy or sell stocks, options or any other financial instrument. The only purpose of this blog is to provide education and entertainment.

No trader is ever 100 percent successful in his or her trades. Trading in the stock and option markets is risky and uncertain. Each trader must make trading decisions for his or her own account, and take responsibility for the consequences.

License
Creative Commons License

All content on Tim Bovee, Private Trader by Timothy K. Bovee is licensed under a Creative Commons Attribution-ShareAlike 4.0 International License.

Based on a work at www.timbovee.com.
SP500 Analysis

3:25 p.m. New York time

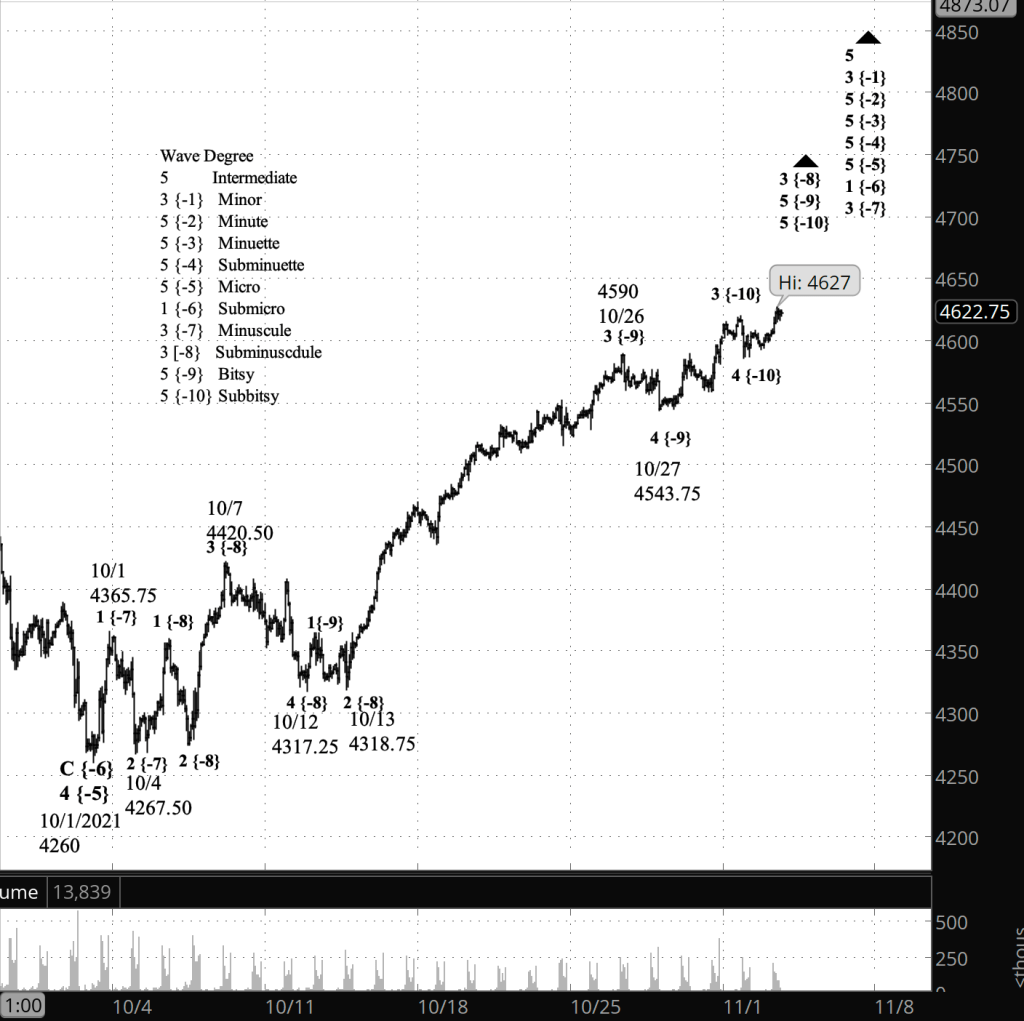
Thirty-five minutes before the closing bell. The high set in overnight trading has prove to be the high (so far) of the day. The S&P 500 fell thereafter, so far reaching a low of 4586.50. The decline could be the end of the 3rd wave of Subbitsy degree within wave 5 of Bitsy degree. Or it could be a subwave of the 1st wave of Subbitsy degree. In either case, the corrective decline will be followed by a rise to new heights. No change in the analysis. I’ve updated the chart.

9:35 a.m. New York time

What’s happening now? The S&P 500 E-mini futures continued to rise when trading resumed overnight, so far reaching 4619.50.

What does it mean? The uptrend that began October 12 is still underway and in the middle section of its rise. Internally, it is in its final section, which in turn is in its middle section. (A trend has three movements in the direction of the trend.)

What’s the alternative? There is no strict upper limit to the rise, beyond the need to be proportional to the size of the overall movement and to more or less adhere to the price channels and triangle boundaries. The S&P 500 has been working its away along the upper boundary of an expanding Diagonal Triangle that began in December 2018. This provides a very loose limit to how high the trend can go.

[S&P 500 E-mini futures at 3:35 p.m., 70-minute bars, with volume]

What does Elliott wave theory say? The present rise is wave 5 of Bitsy degree within wave 5 of Subminuscule degree within wave 3 of Minuscule degree, which began on October 4 from 4267.50. Within Bitsy wave 5, at the Subbitsy degree, the 3rd wave is underway.

Subminuscule wave 5, when complete, will mark the end of its parent, Minuscule wave 3, which will be followed by a shallow correction, Minuscule wave 4, that in turn will be followed by a move to new highs by as Minuscule wave 5.

Learning and other resources. Elliott wave analysis provides context, not prophecy. As the 20th century semanticist Alfred Korzybski put it in his book Science and Sanity (1933), “The map is not the territory … The only usefulness of a map depends on similarity of structure between the empirical world and the map.” And I would add, we can judge that similarity of structure only after the fact.

See the menu page Analytical Methods for a rundown on where to go for information on Elliott wave analysis.

By Tim Bovee, Portland, Oregon, November 1, 2021

Disclaimer

Tim Bovee, Private Trader tracks the analysis and trades of a private trader for his own accounts. Nothing in this blog constitutes a recommendation to buy or sell stocks, options or any other financial instrument. The only purpose of this blog is to provide education and entertainment.

No trader is ever 100 percent successful in his or her trades. Trading in the stock and option markets is risky and uncertain. Each trader must make trading decisions for his or her own account, and take responsibility for the consequences.

License
Creative Commons License

All content on Tim Bovee, Private Trader by Timothy K. Bovee is licensed under a Creative Commons Attribution-ShareAlike 4.0 International License.

Based on a work at www.timbovee.com.
SP500 Analysis

3:30 p.m. New York time

Half an hour before the closing bell. The S&P 500 has dropped back from its new peak as the closing bell approaches. No change in the revised analysis. I’ve updated the charts.

1:35 p.m. New York time

New peak. The S&P 500 has exceeded the October 26 high, confirming that the rise from October 13 is still underway. In Elliott wave terms, that rise is wave 5 of Bitsy degree within wave 3 of Subminuscule degree. So far the peak is 4596.75 on the futures; 4604.11 on the index. Chart updated.

11:20 a.m. New York time

My trades. Today is management day for my short bear call vertical spread position on FXI, 21 days before the options expire. The price rose the day after I entered the position, putting my position in the money and therefore unprofitable. The price peaked on October 22 and since then has fallen back toward profitability. Under my rules, had the position been profitable I would have exited today. It’s not profitable at present, but the price is moving toward profitability. So I’ll continue to hold in the expectation that the price, now at $40.43, will move below the short call strike of $39. One the position is at break-even or better, I’ll exit.

10:20 a.m. New York time

Long-term chart. I’ve added in a longer-term chart of the S&P 500 index, showing the boundaries of the expanding Diagonal Triangle that has been underway since December 2018. It gives perspective to the present market drop, which is a nearly invisible scratch to the right of the 4598.53 peak. The chart is below the shorter-term chart in the original post.

9:35 a.m. New York time

What’s happening now? The S&P 500 E-mini futures continued a shallow sideways movement, remaining below Wednesday’s high as it traced the third leg of the pattern.

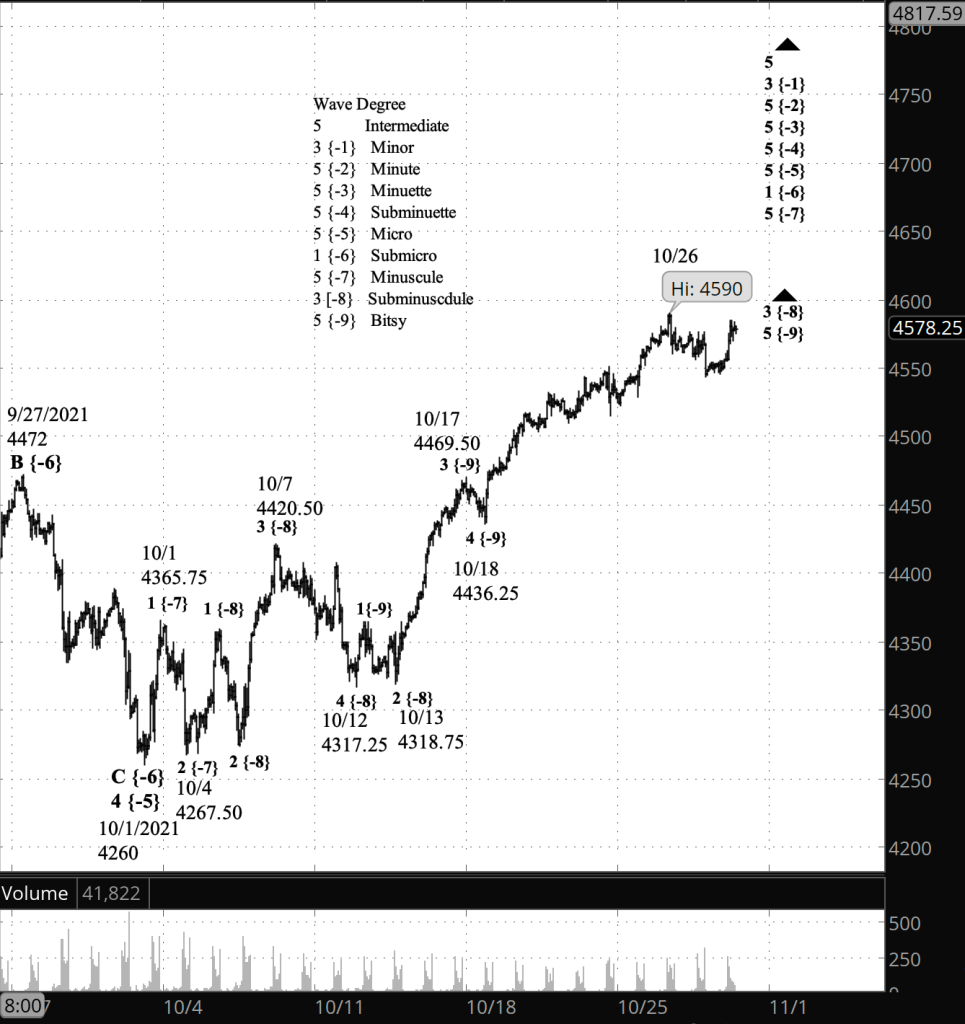
What does it mean? The correction appears to be too shallow to be correcting the rise from October 13. A Fibonacci ladder (in red) shows the retracement falls significantly short of a 23.6% Fib retracement.

What’s the alternative? That the retracement is a correction of the rise from October 13. See the Elliott wave theory section below for a discussion.

[Shorter term: S&P 500 E-mini futures at 3:30 p.m., 65-minute bars, with volume]
[Longer-term: S&P 500 index at 3:29 p.m., daily bars]

What does Elliott wave theory say? The correction of the rise from October 13, if it’s happening, would be wave 4 of Subminuscule degree. There is no rule in Elliott in Elliott requiring a certain depth of correction in a 4th wave.

The Elliott guidance is that the wave alternate in form from the preceding 2nd wave, which this sideways movement fulfills. The 2nd wave was a Zigzag; this movement is a Flat.

The only guidance as to the depth of the correction is that 4th waves generally end within the 4th wave of the preceding 3rd wave, which I’ve marked with a tan oval on the chart. In this case that would imply a 50% retracement, and the three waves of the present pattern falls well short of that.

Long story short: I’m not sure what a degree of movement we’re seeing. As always, the ambiguity will resolve itself, either with the price falling to a level appropriate for a correction of this degree, or the price rising above 4590, the high of October 26, which would demonstrate that the uptrending wave 5 of Bitsy degree within wave 3 of Subminuscule degree is still underway.

Learning and other resources. Elliott wave analysis provides context, not prophecy. As the 20th century semanticist Alfred Korzybski put it in his book Science and Sanity (1933), “The map is not the territory … The only usefulness of a map depends on similarity of structure between the empirical world and the map.” And I would add, we can judge that similarity of structure only after the fact.

See the menu page Analytical Methods for a rundown on where to go for information on Elliott wave analysis.

By Tim Bovee, Portland, Oregon, October 29, 2021

Disclaimer

Tim Bovee, Private Trader tracks the analysis and trades of a private trader for his own accounts. Nothing in this blog constitutes a recommendation to buy or sell stocks, options or any other financial instrument. The only purpose of this blog is to provide education and entertainment.

No trader is ever 100 percent successful in his or her trades. Trading in the stock and option markets is risky and uncertain. Each trader must make trading decisions for his or her own account, and take responsibility for the consequences.

License
Creative Commons License

All content on Tim Bovee, Private Trader by Timothy K. Bovee is licensed under a Creative Commons Attribution-ShareAlike 4.0 International License.

Based on a work at www.timbovee.com.
SP500 Analysis

3:30 p.m. New York time

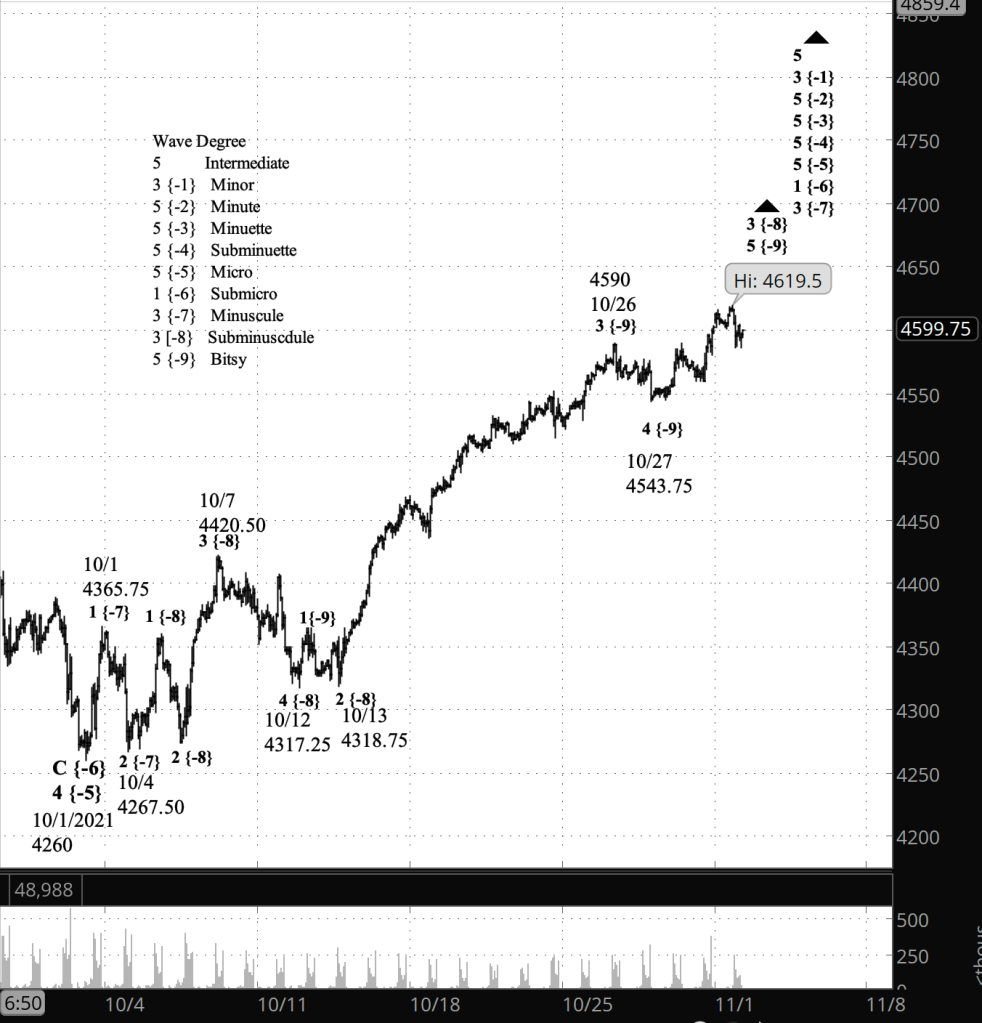
Half an hour before the closing bell. The S&P 500 rose during the trading session, reaching 4584.75 on the futures, 4592.69 on the index, each slightly below the October 26 peak of 4590 on the futures, 4598.53 on the index. No change in the analysis. I’ve updated the chart.

9:40 a.m. New York time

What’s happening now? The S&P 500 E-mini futures reached a low of 4543.75 in overnight trading, down 46 points from the October 26 peak, and then rose slightly in a sideways pattern, remaining below the peak.

What does it mean? The two alternatives I described yesterday remain: Either the decline is a small internal correction as the rise that began October 13 continues. Or the October 26 peak ended that rise, and the subsequent decline is the first small steps in what will be a correction of that rise. I consider the two alternatives to be of equal likelihood. The lower the price goes, the more likely it is that the second alternative is correct. At this point, however, I’ve continued to label the chart with the first alternative.

Other alternatives? It’s possible, although unlikely, that October 26 marked the end of the rise that began on in February 2020, from the end of the early pandemic crash. The end of that rise will be followed by a decline that will eventually carry the price down by more than 2,000 points. This alternative would require a major reworking of the chart analysis since February of last year.

[S&P 500 E-mini futures at 3:30 p.m., 70-minute bars, with volume]

What does Elliott wave theory say? By the first principal count, wave 5 of Bitsy degree within wave 3 of Subminuscule degree continue to rise. By the second principal count, Bitsy 5 within Subminuscule 3 ended on October 26, and wave 4 of Subminuscule degree is underway. Since the preceding 2nd wave of Subminuscule degree was a Zigzag pattern, it is likelh that Subminuscule 4 will be Flat, although there are other options.

Learning and other resources. Elliott wave analysis provides context, not prophecy. As the 20th century semanticist Alfred Korzybski put it in his book Science and Sanity (1933), “The map is not the territory … The only usefulness of a map depends on similarity of structure between the empirical world and the map.” And I would add, we can judge that similarity of structure only after the fact.

See the menu page Analytical Methods for a rundown on where to go for information on Elliott wave analysis.

By Tim Bovee, Portland, Oregon, October 28, 2021

Disclaimer

Tim Bovee, Private Trader tracks the analysis and trades of a private trader for his own accounts. Nothing in this blog constitutes a recommendation to buy or sell stocks, options or any other financial instrument. The only purpose of this blog is to provide education and entertainment.

No trader is ever 100 percent successful in his or her trades. Trading in the stock and option markets is risky and uncertain. Each trader must make trading decisions for his or her own account, and take responsibility for the consequences.

License
Creative Commons License

All content on Tim Bovee, Private Trader by Timothy K. Bovee is licensed under a Creative Commons Attribution-ShareAlike 4.0 International License.

Based on a work at www.timbovee.com.
SP500 Analysis

3:30 p.m. New York time

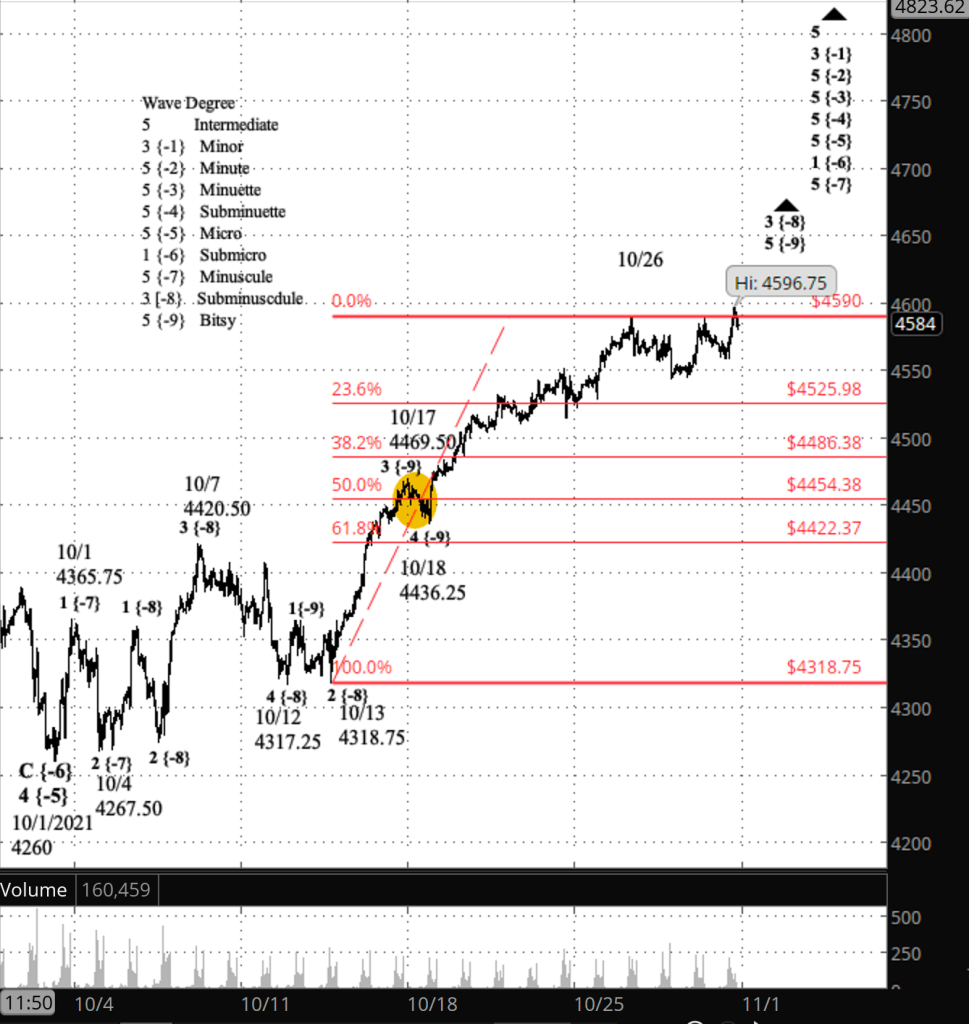
Half an hour before the closing bell. The S&P 500 continued to trade slightly below Friday’s high of 4590 as the session neared its end, staying within 35 points of that peak until late in the session, when the price dropped to 4550.50. No change in the analysis. I’ve updated the chart.

9:50 a.m. New York time

What’s happening now? The S&P 500 E-mini futures remained slightly below yesterday’s peak, 4590,

What does it mean? Two possibilities, of equal likelihood: Either the decline from the peak is a low-level correction that will be quickly followed by a rise to new highs (which is how I’ve labelled the chart).

Or the decline marks the end of larger rise that began October 13 and the beginning of a shallow correction which in turn will be followed by a rise to new highs.

What is the alternative? A bearish alternative would be to redo the analysis entirely, making yesterday’s high the end of the rise that began February 23, 2020. Based on the internal count, I consider this to be of extremely low probability.

[S&P 500 E-mini futures at 3:30 p.m., 70-minute bars, with volume]

What does Elliott wave theory say? The rise from October 13 is wave 3 of Subminuscule degree. Internally, it is in wave 5 of Bitsy degree, which has turned to be a hard-to-count wave, which lots of ambiguity. I think it has met all of the Elliott requirements for completion, but it can continue extending for quite some time.

Of equal likelihood is a scenario where yesterday’s high ended wave 3 of Subminuscule degree, and the subsequent slight decline is an early stage within wave 4 of Subminuscule degree. The 4th wave could trace one of three patterns: Zigzag, Flat or Triangle. I’m betting on Flat, which is a shallow correction.

The alternative scenario sees yesterday’s high as the end of wave 2 and the beginning of wave 3 of Minor degree, at the end of the early pandemic crash, on February 23, 2000. Minor degree is seven degrees larger than Subminuscule degree and is the largest internal degree of wave 5 of Intermediate degree, an expanding Diagonal Triangle, wave 5 of Intermediate degree, that began in December 2018. The internal count suggests that the price is in wave 1 of Submicro degree, four levels below Intermediate, and that Minor wave 3 won’t be complete until the end of wave 5 of Submicro degree.

So how much high does the S&P 500 really have? As shown in the longer-term chart that I posted on Friday, the price since April has been bouncing along the upper boundary of the Diagonal Triangle that began nearly three years ago. The price can go above that boundary, but usually not by a lot. So I expect the price to continue its work at the boundary, with maybe a final push above to complete wave 5 of Intermediate degree.

Learning and other resources. Elliott wave analysis provides context, not prophecy. As the 20th century semanticist Alfred Korzybski put it in his book Science and Sanity (1933), “The map is not the territory … The only usefulness of a map depends on similarity of structure between the empirical world and the map.” And I would add, we can judge that similarity of structure only after the fact.

See the menu page Analytical Methods for a rundown on where to go for information on Elliott wave analysis.

By Tim Bovee, Portland, Oregon, October 27, 2021

Disclaimer

Tim Bovee, Private Trader tracks the analysis and trades of a private trader for his own accounts. Nothing in this blog constitutes a recommendation to buy or sell stocks, options or any other financial instrument. The only purpose of this blog is to provide education and entertainment.

No trader is ever 100 percent successful in his or her trades. Trading in the stock and option markets is risky and uncertain. Each trader must make trading decisions for his or her own account, and take responsibility for the consequences.

License
Creative Commons License

All content on Tim Bovee, Private Trader by Timothy K. Bovee is licensed under a Creative Commons Attribution-ShareAlike 4.0 International License.

Based on a work at www.timbovee.com.