SP500 Analysis

3:30 p.m. New York time

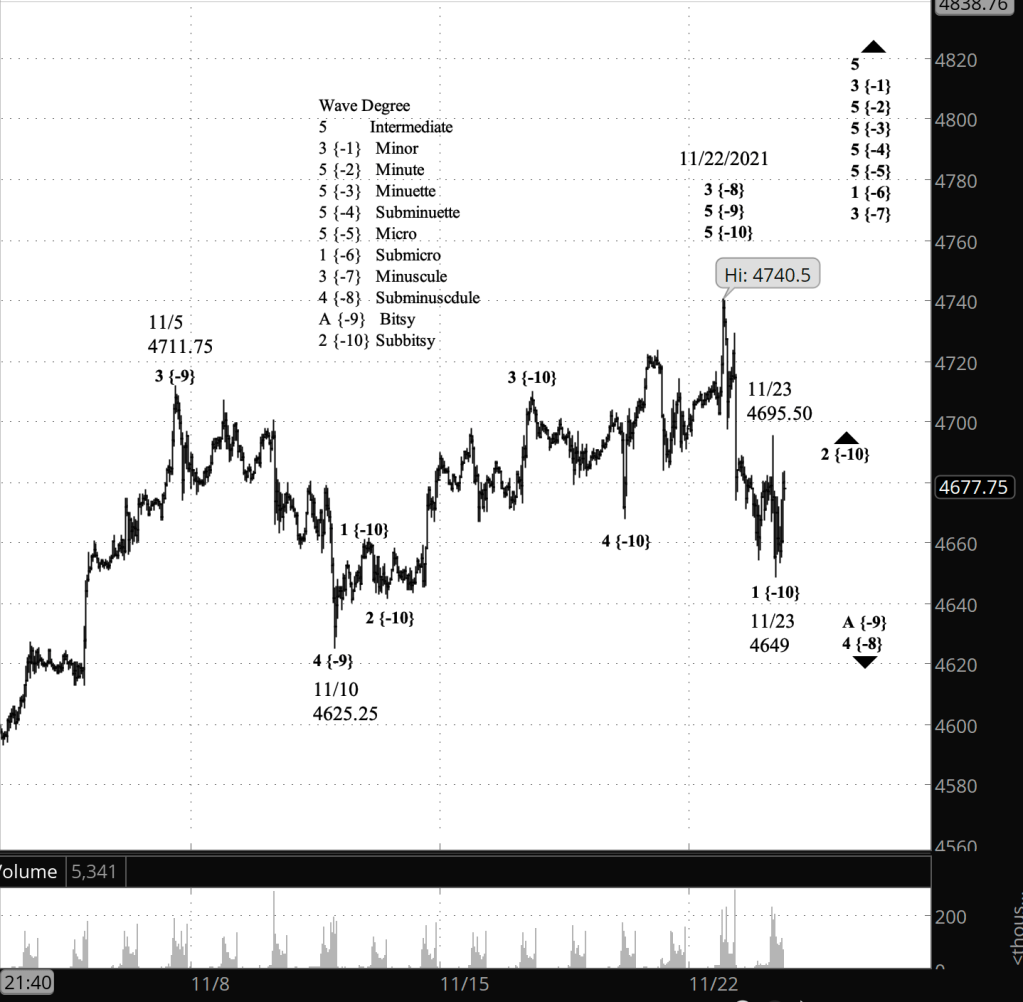
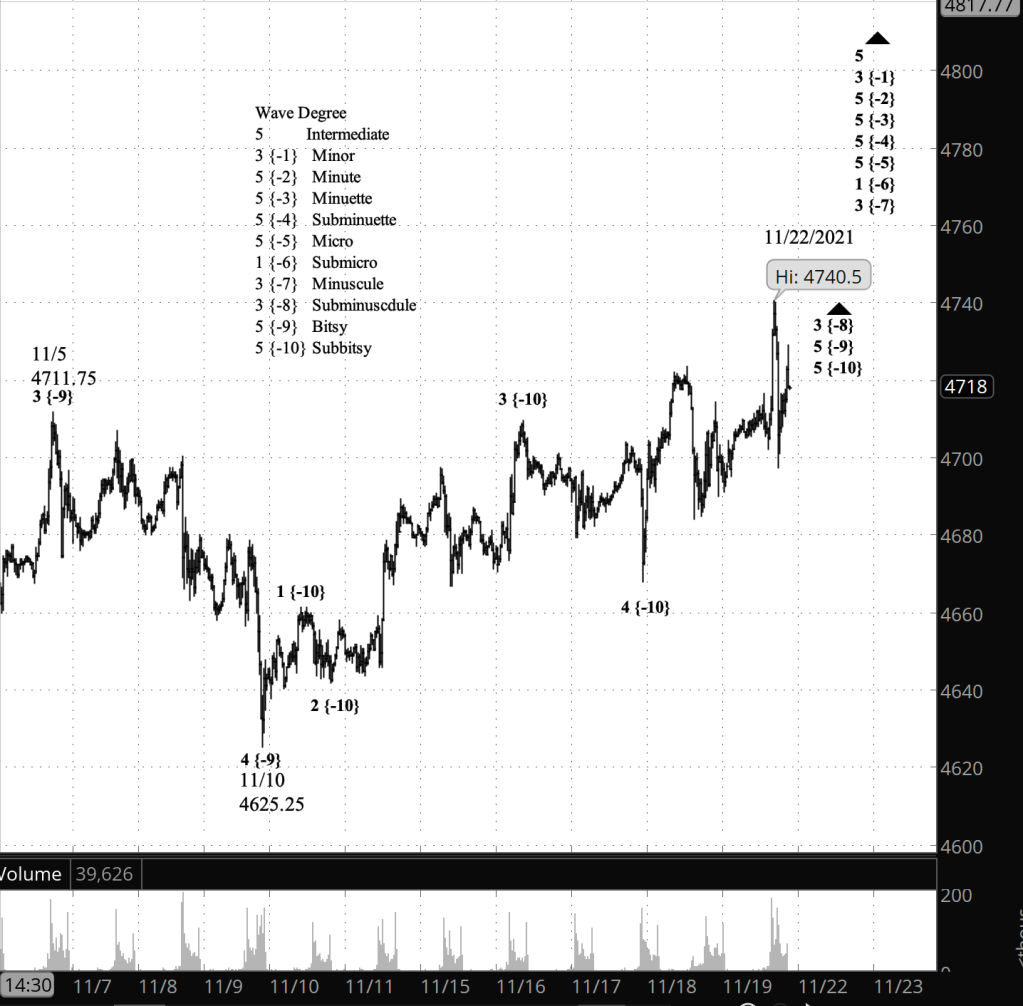
Half an hour before the closing bell. The S&P 500 fell slightly lower during the day, to 4649 on the futures, and then rose slightly, remaining below the high point of the morning, 4695.50. The day’s highs and lows on the index were 4690.39 and 4652.66. No change in the analysis. I’ve updated the chart.

9:35 a.m. New York time

What’s happening now? The S&P 500 fell in overnight trading, to 4654.50, and then rose slightly.

What does it mean? The November 22 peak, 4740.50, marked the end of a rise that began October 6 and the beginning of a downward correction.

What’s the alternative? The decline from the November 22 peak is a low-level correction within a continuing uptrend that began October 6.

At this point, honestly, I can’t choose between the two, but the sharpness of the decline suggests that my principal analysis is the more likely interpretation of the market’s movement.
[S&P 500 E-mini futures at 3:30 p.m., 40-minute bars, with volume]

What does Elliott wave theory say? Under my principal analysis, wave 4 of Subminuscule degree — subscript {-8} — is now underway, having begun with the decline from the November 22 high. Internally, the 4th wave is in its initial decline — wave A of Bitsy degree {-9} — which in turn is in an upward correction, wave 2 of Subbitsy degree {-10}.

Under my alternative analysis, wave 3 of Subminuscule degree, which began October 6, is still underway. Within it, the price is tracing wave 5 of Bitsy degree, and one step further down, wave 5 of Subbitsy degree.

In either case, the 4th wave that follows wave 3 of Subminuscule degree will be followed by a 5th-wave rise to a new peak, and then by a 2nd-wave correction of Submicro degree {-6}

Learning and other resources. Elliott wave analysis provides context, not prophecy. As the 20th century semanticist Alfred Korzybski put it in his book Science and Sanity (1933), “The map is not the territory … The only usefulness of a map depends on similarity of structure between the empirical world and the map.” And I would add, in the ever-changing markets, we can judge that similarity of structure only after the fact.

See the menu page Analytical Methods for a rundown on where to go for information on Elliott wave analysis.

By Tim Bovee, Portland, Oregon, November 23, 2021

Disclaimer

Tim Bovee, Private Trader tracks the analysis and trades of a private trader for his own accounts. Nothing in this blog constitutes a recommendation to buy or sell stocks, options or any other financial instrument. The only purpose of this blog is to provide education and entertainment.

No trader is ever 100 percent successful in his or her trades. Trading in the stock and option markets is risky and uncertain. Each trader must make trading decisions for his or her own account, and take responsibility for the consequences.

License
Creative Commons License

All content on Tim Bovee, Private Trader by Timothy K. Bovee is licensed under a Creative Commons Attribution-ShareAlike 4.0 International License.

Based on a work at www.timbovee.com.
SP500 Analysis

3:30 p.m. New York time

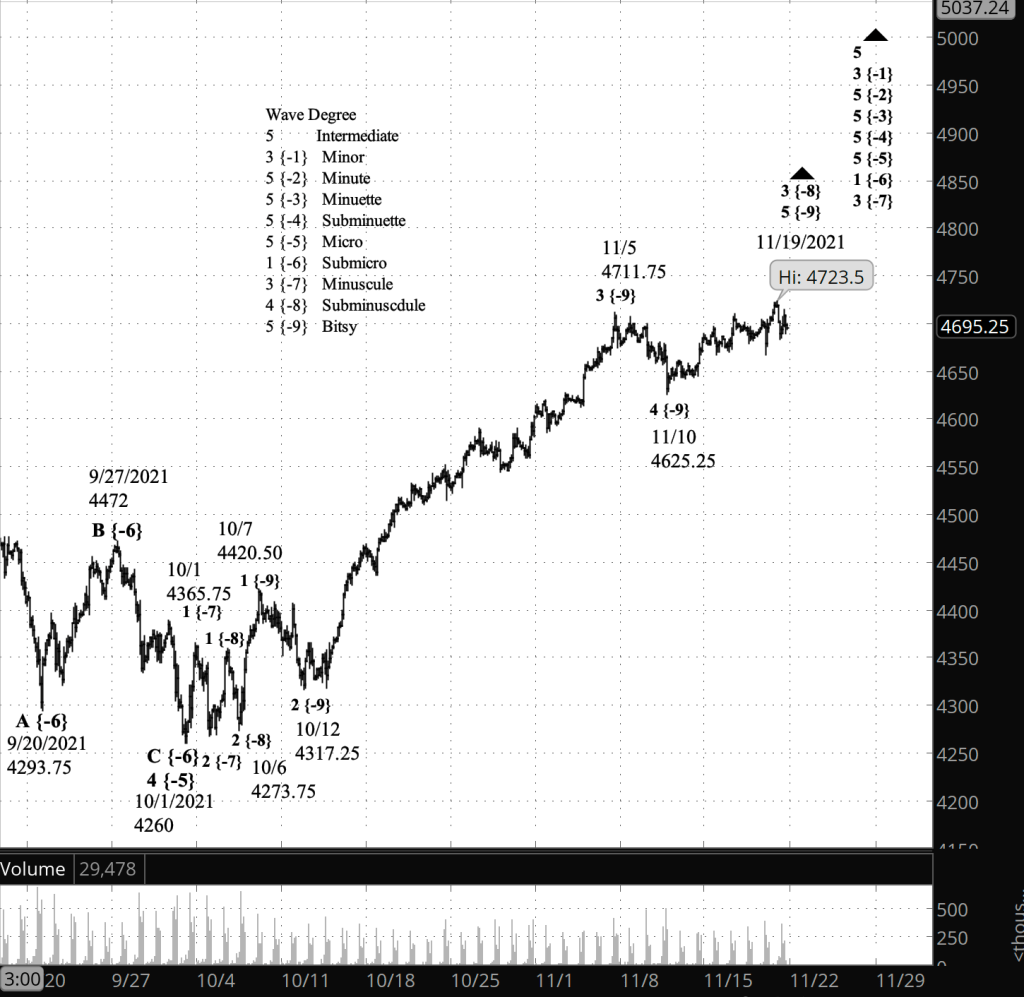
Half an hour before the closing bell. The S&P 500 peaked at 4740.50 on the futures, 4743.83 on the index, after President Biden’s announcement on the retention of Jerome Powell as Fed chair. The price then declined sharply and rose again, sharply.

I attributed the market movement to the Powell announcement. Elliott wave theory would have it that the nature of the market’s reaction is a reflection of the public mood, the Zeitgeist of the moment. Had the public mood been negative, the theory goes, then the price might well have declined after the same announcement.

No change in the analysis. I’ve updated the chart.

10:20 a.m. New York time

New peak. The S&P 500 shot up to a new peak after President Biden said he would retain Jerome Powell as Fed chair. Up to 4740.50 so far on the futures, 4743.83 on the index. The move adds credence to my principal analysis earlier this morning. Chart updated.

9:35 a.m. New York time

What’s happening now? The S&P 500 E-mini futures rose in overnight trading, remaining below the November 19 peak, 4723.50.

What does it mean? The rise that began on November 10 from 4625.25 is continuing.

What’s the alternative? The November 14 peak was the end of the rise that began on November 10, and a low-level sideways correction has begun.

[S&P 500 E-mini futures at 3:30 p.m., 30-minute bars, with volume]

What does Elliott wave theory say? By my principal count, wave 5 of Subbitsy degree — subscript {-10} — within wave 5 of Bitsy degree {-9} within wave 3 of Subminuscule degree {-8} is underway. The completion of Subbitsy 5 and its parent, Bitsy 5, will also be the end of Subminuscule 3 and the beginning of the 4th wave of Subminuscule degree, which most likely will take the from of a Flat, although that’s not a certainty.

Although the futures peaked on November 19 — last Friday — the S&P 500 index did not, creating a discrepancy between two symbols that in theory should follow each other very closely. One thing to look for today was whether the index exceeds Friday’s high, 4718.50, and indeed, it did, reaching 4725.78 at the opening bell.

Learning and other resources. Elliott wave analysis provides context, not prophecy. As the 20th century semanticist Alfred Korzybski put it in his book Science and Sanity (1933), “The map is not the territory … The only usefulness of a map depends on similarity of structure between the empirical world and the map.” And I would add, in the ever-changing markets, we can judge that similarity of structure only after the fact.

See the menu page Analytical Methods for a rundown on where to go for information on Elliott wave analysis.

By Tim Bovee, Portland, Oregon, November 22, 2021

Disclaimer

Tim Bovee, Private Trader tracks the analysis and trades of a private trader for his own accounts. Nothing in this blog constitutes a recommendation to buy or sell stocks, options or any other financial instrument. The only purpose of this blog is to provide education and entertainment.

No trader is ever 100 percent successful in his or her trades. Trading in the stock and option markets is risky and uncertain. Each trader must make trading decisions for his or her own account, and take responsibility for the consequences.

License
Creative Commons License

All content on Tim Bovee, Private Trader by Timothy K. Bovee is licensed under a Creative Commons Attribution-ShareAlike 4.0 International License.

Based on a work at www.timbovee.com.
SP500 Analysis

3:30 p.m. New York time

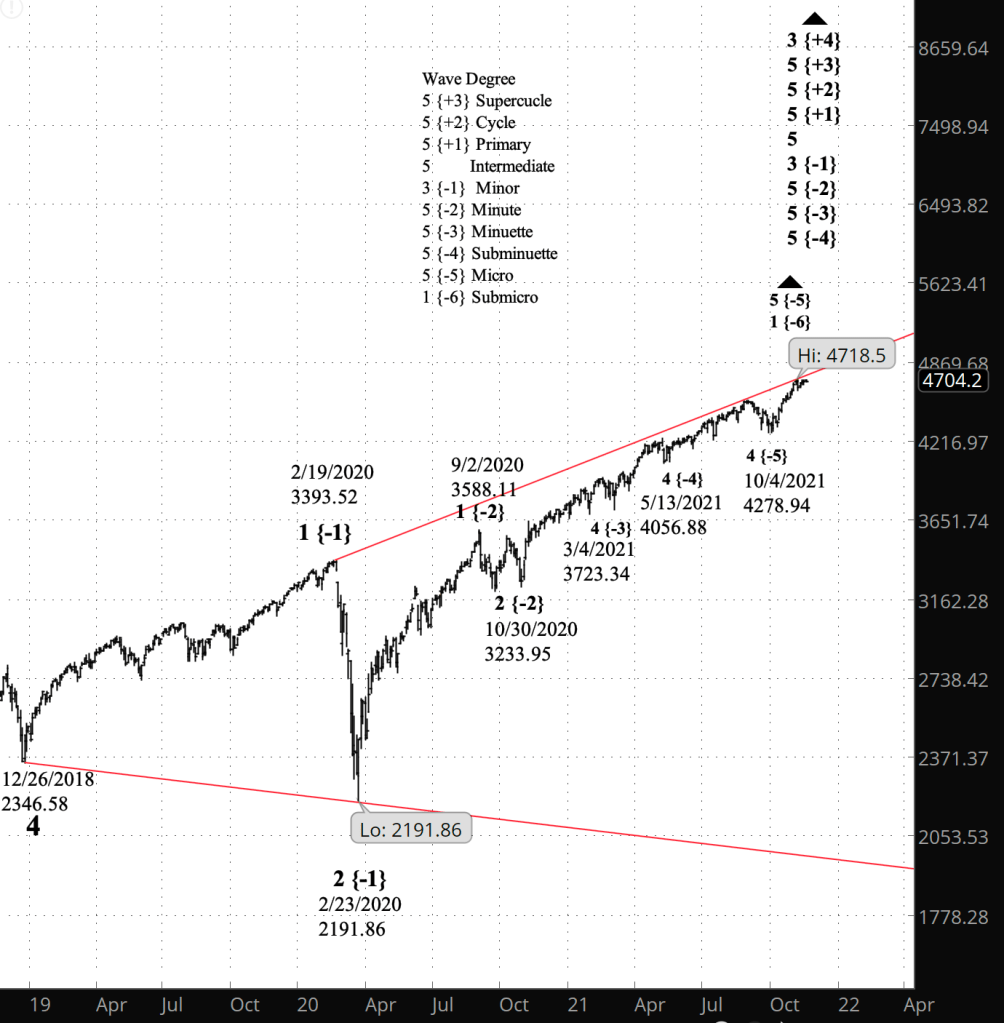
Half an hour before the closing bell. The S&P 500 traded within a narrow range throughout the day, remaining below the future’s overnight high. The index remained below the November 5 high of 4718.50. No change in the analysis. I’ve updated the upper chart.

10:05 a.m. New York time

What’s happening now? The S&P 500 E-mini futures reached a new all-time high, 4723.50, in overnight trading and then pulled back slightly. The S&P 500 index, which doesn’t trade overnight, opened with its November 5 peak, 4718.50, still intact.

What does it mean? Assuming that the index will soon follow the futures in reaching a new high, the fresh peak means that the rise that began on October 12 is still underway, and the decline from November 5 was a shallow correction within the ongoing rise.

What’s the alternative? The details of the count on the upper chart may change. The correction that began November 5 seems disproportionally shallow, creating a degree of uncertainty

Charts. The upper chart is a closer view showing the futures from mid-October to the present. The lower chart is a broader view showing the index from late December 2018, the beginning of a large expanding Diagonal Triangle.

[S&P 500 E-mini futures at 3:30 p.m., 2-hour bars, with volume]
[S&P 500 index at 9:46 a.m., 2-day bars]

What does Elliott wave theory say? Under the new principal count, wave 5 of Bitsy degree — subscript {-9} — within wave 3 of Subminuette degree {-8}. Basically, the waves that the prior counts had seen as ending on November 5 did not end on that date and are still ongoing. The decline that began November 5 is wave 4 of Subminuette degree.

That wave 4 is extremely shallow even by 4th-wave standards. A standard target for 4th waves in Elliott wave analysis is the 4th wave within the preceding 3rd wave, which would be 4590 to 4548. The 4th wave under the new principal analysis ended at 4625.25. It doesn’t break any of the Elliott rules, but it is unusual.

The shallowness of the correction leaves the details of the count uncertain. They’ll start to make sense as the price continues on its way.

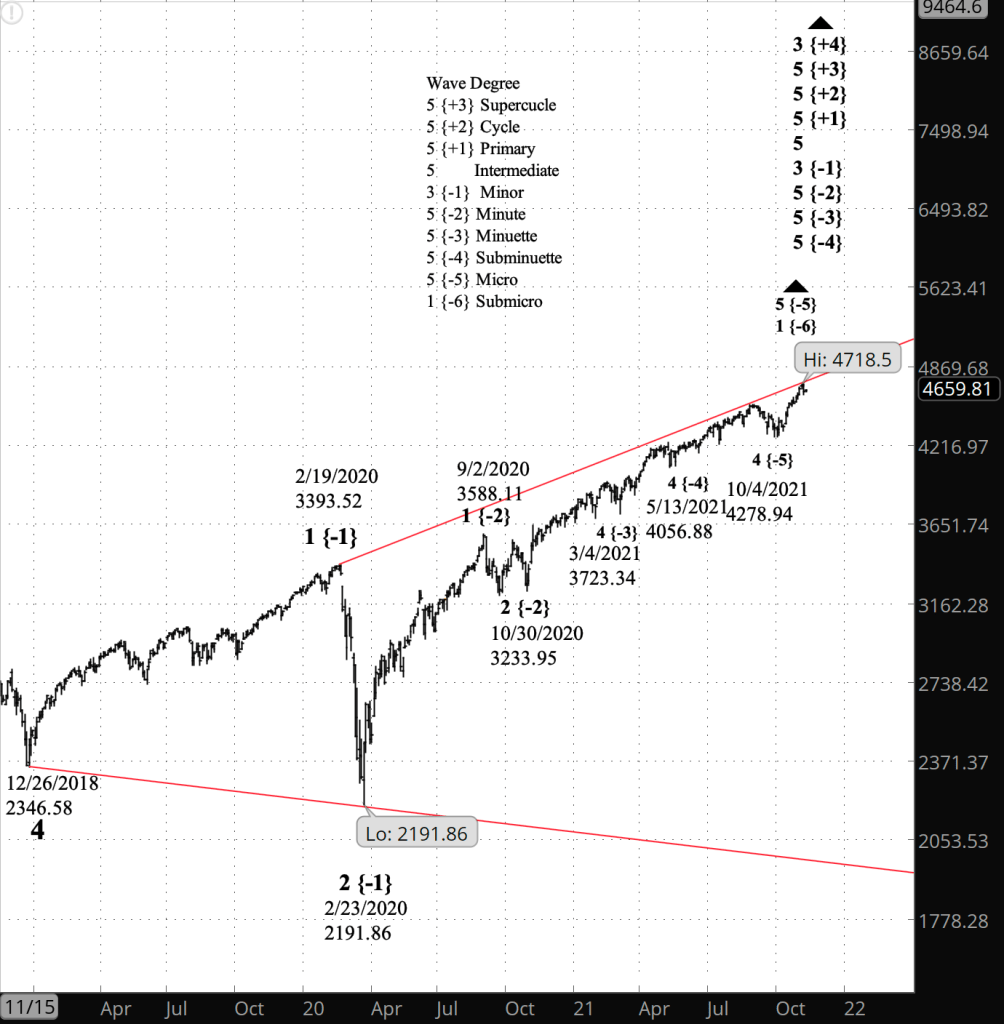
What is certain is that wave 3 of Minor degree {-1}, the third leg of the expanding Diagonal Triangle, has reached its end, Minor wave 4 will work its way down to the lower boundary of the Triangle, presently in the 1970s and declining further each day. The 4th wave will be followed by wave 5 of Minor degree, returning to continually rising upper boundary and ending the Triangle, which in its entirety is is wave 5 of Intermediate degree (no subscript). An extremely large decline will follow.

Wave 1 of Minor degree took a year a two months to reach completion. I wouldn’t be surprised if Minor wave 5 took that longer and possibly longer, and so we may be looking at 2023 or later for the Triangle to reach its end.

Learning and other resources. Elliott wave analysis provides context, not prophecy. As the 20th century semanticist Alfred Korzybski put it in his book Science and Sanity (1933), “The map is not the territory … The only usefulness of a map depends on similarity of structure between the empirical world and the map.” And I would add, in the ever-changing markets, we can judge that similarity of structure only after the fact.

See the menu page Analytical Methods for a rundown on where to go for information on Elliott wave analysis.

By Tim Bovee, Portland, Oregon, November 19, 2021

Disclaimer

Tim Bovee, Private Trader tracks the analysis and trades of a private trader for his own accounts. Nothing in this blog constitutes a recommendation to buy or sell stocks, options or any other financial instrument. The only purpose of this blog is to provide education and entertainment.

No trader is ever 100 percent successful in his or her trades. Trading in the stock and option markets is risky and uncertain. Each trader must make trading decisions for his or her own account, and take responsibility for the consequences.

License
Creative Commons License

All content on Tim Bovee, Private Trader by Timothy K. Bovee is licensed under a Creative Commons Attribution-ShareAlike 4.0 International License.

Based on a work at www.timbovee.com.
SP500 Analysis

3:30 p.m. New York time

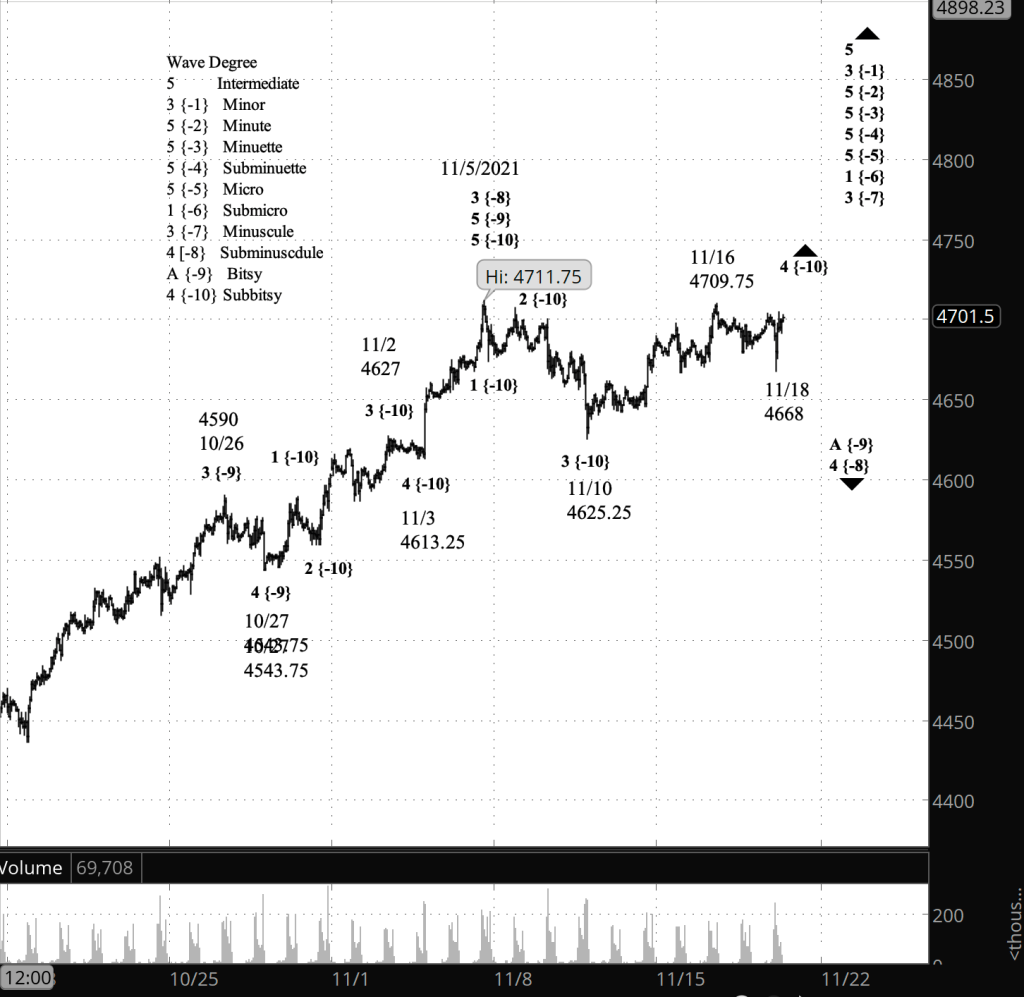
Half an hour before the closing bell. The S&P 500 futures launched into a 32-point decline spanning an hour this morning and then a recovery to just below the original level in the two hours that followed. No change in the analysis. I’ve updated the chart.

9:35 a.m. New York time

What’s happening now? The S&P 500 E-mini futures rose in overnight trading, remaining below Tuesday’s high, 4709.75.

What does it mean? The upward correction that began on November 10 is still underway, within a downward correction that began on November 5.

What’s the alternative? It’s possible that the correction from November 10 ended at yesterday’s high. Another alternative: If the price moves above the November 5 high of 4711.75, then the uptrend that began on October 27, and several larger uptrends that began before that, are still on the rise.

[S&P 500 E-mini futures at 3:30 p.m., hourly bars, with volume]

What does Elliott wave theory say? Under my principal analysis, the lowest degree that I’m tracking is wave 4 of Subbitsy degree — subscript {-10}. It is a subwave of wave A of Bitsy degree {-9} within wave 4 of Subminuscule degree {-8}. All of that comes within the parent, wave 3 of Minuscule degree {-7}, which began on October 4.

It’s possible that Tuesday’s peak ended wave 4 of Subbitsy degree. If that is so, then downtrending wave 5 of Subbitsy degree has begun.

If the price moves above the November 5 high, then wave 3 of Subminuscule degree is still underway.

Learning and other resources. Elliott wave analysis provides context, not prophecy. As the 20th century semanticist Alfred Korzybski put it in his book Science and Sanity (1933), “The map is not the territory … The only usefulness of a map depends on similarity of structure between the empirical world and the map.” And I would add, in the ever-changing markets, we can judge that similarity of structure only after the fact.

See the menu page Analytical Methods for a rundown on where to go for information on Elliott wave analysis.

By Tim Bovee, Portland, Oregon, November 18, 2021

Disclaimer

Tim Bovee, Private Trader tracks the analysis and trades of a private trader for his own accounts. Nothing in this blog constitutes a recommendation to buy or sell stocks, options or any other financial instrument. The only purpose of this blog is to provide education and entertainment.

No trader is ever 100 percent successful in his or her trades. Trading in the stock and option markets is risky and uncertain. Each trader must make trading decisions for his or her own account, and take responsibility for the consequences.

License
Creative Commons License

All content on Tim Bovee, Private Trader by Timothy K. Bovee is licensed under a Creative Commons Attribution-ShareAlike 4.0 International License.

Based on a work at www.timbovee.com.
SP500 Analysis

3:30 p.m. New York time

Half an hour before the closing bell. The S&P 500 continued its slow decline during the day, remaining below yesterday’s high, 4709.75. No change in the analysis. I’ve updated the chart.

9:35 a.m. New York time

What’s happening now? The S&P 500 E-mini futures rose to 4709.75 within two points of the November 5 peak and then declined slightly

What does it mean? The pattern leaves uncertainty over whether the upward correction that began on November 10 is still underway, or whether the next movement, to the downside, has begun. I’ve marked the chart to reflect the first scenario: The upward correction is ongoing,

What’s the alternative? If the price continues to rise and moves above 4711.75, the November 5 peak, then that peak is likely just a stopping point on the the rise that began October 6 and that is still underway.

[S&P 500 E-mini futures at 3:30 p.m., hourly bars, with volume]

What does Elliott wave theory say? By my principal analysis, wave 4 of Subbitsy degree — subscript {-10} — is underway, an upward movement within wave A of Bitsy degree {-9}, which is the first portion of a three-wave corrective pattern, wave 4 of Subminuscule degree {-8}. Subminuscule 4 began on November 5 from 4711.75.

Last night’s high is the highest high point since Subbitsy wave 4 began. It could be that it marks the end of that upward correction, or there could be a bit more upside remaining. If Subbitsy wave 4 is a Flat pattern or a Zigzag, then it cannot move above the November 5 high, 4711.75. If it does move above that level, then it is either a Triangle of some sort, forming Subminuscule wave 4, or the November 5 peak didn’t mark the end of Subminuscule wave 3, which under this scenario is still underway.

It’s also possible that what I’ve treated as Subbitsy degree is really Bitsy degree, waves A and B, leaving only wave C to the downside to reach completion, marking the end of wave 4 of Subminuscule degree and the start of a rise to new heights as wave 5 of Subminuscule degree.

Time will provide us with evidence to sort these questions out.

Learning and other resources. Elliott wave analysis provides context, not prophecy. As the 20th century semanticist Alfred Korzybski put it in his book Science and Sanity (1933), “The map is not the territory … The only usefulness of a map depends on similarity of structure between the empirical world and the map.” And I would add, in the ever-changing markets, we can judge that similarity of structure only after the fact.

See the menu page Analytical Methods for a rundown on where to go for information on Elliott wave analysis.

By Tim Bovee, Portland, Oregon, November 17, 2021

Disclaimer

Tim Bovee, Private Trader tracks the analysis and trades of a private trader for his own accounts. Nothing in this blog constitutes a recommendation to buy or sell stocks, options or any other financial instrument. The only purpose of this blog is to provide education and entertainment.

No trader is ever 100 percent successful in his or her trades. Trading in the stock and option markets is risky and uncertain. Each trader must make trading decisions for his or her own account, and take responsibility for the consequences.

License
Creative Commons License

All content on Tim Bovee, Private Trader by Timothy K. Bovee is licensed under a Creative Commons Attribution-ShareAlike 4.0 International License.

Based on a work at www.timbovee.com.
SP500 Analysis

3:30 p.m. New York time

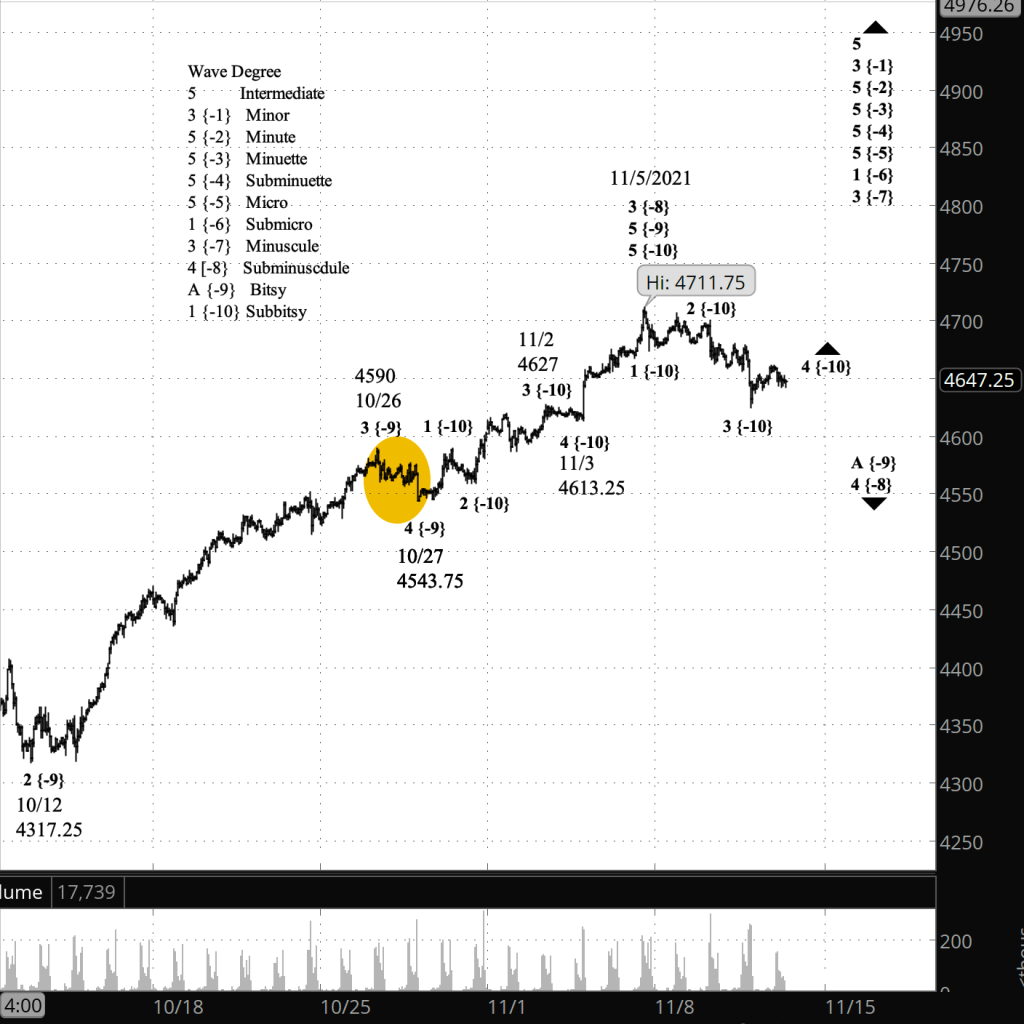
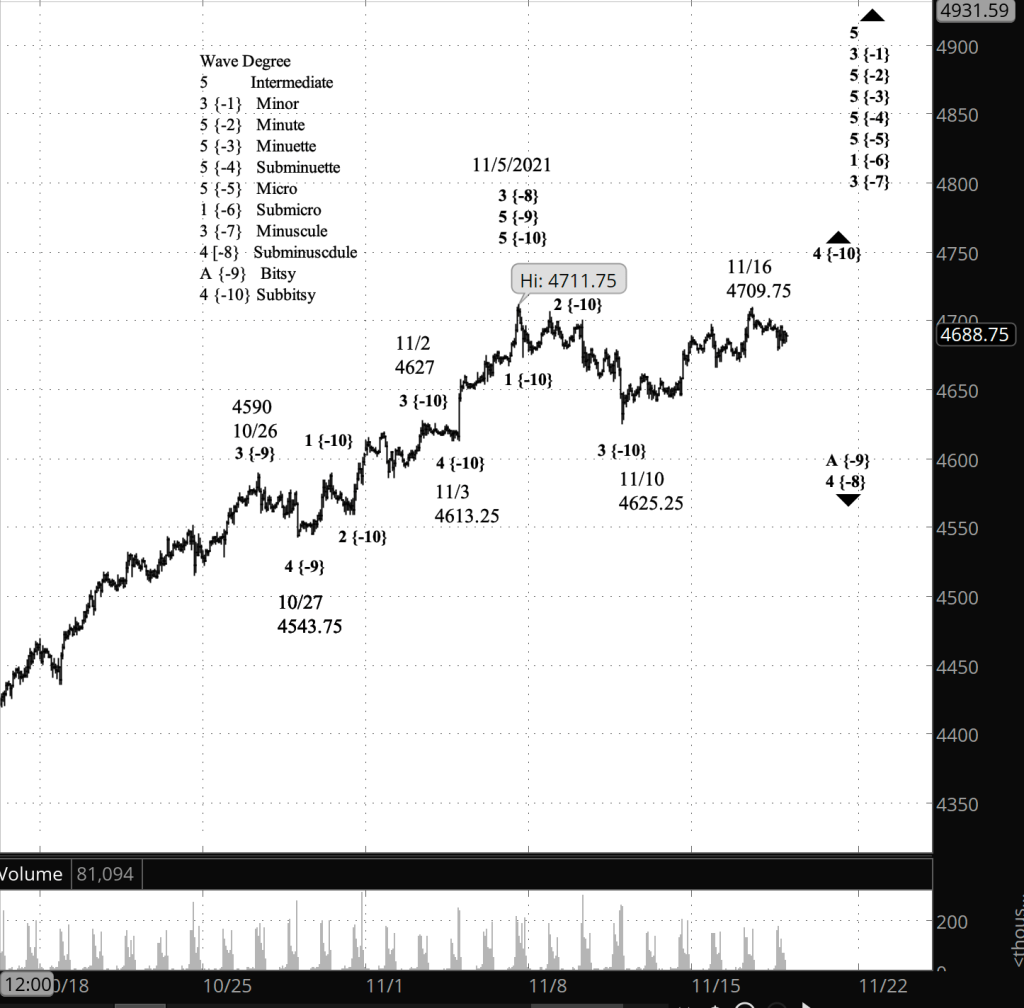
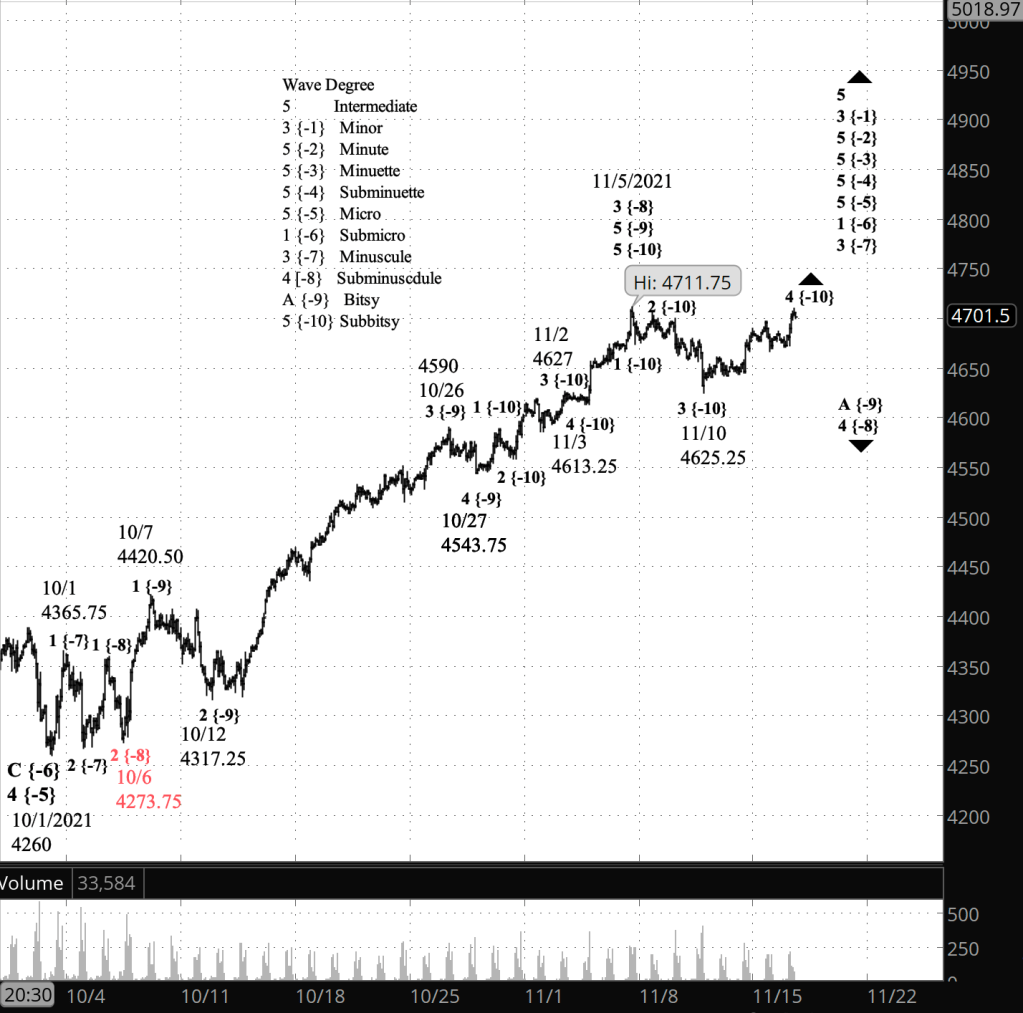
Half an hour before the closing bell. The S&P 500 rose to a new high within an upward correction within a larger downward correction that began on November 5. The new high and so far reached 4709.75 on the futures and has eclipsed yesterday’s high of 4697.50. If the price moves above the November 5 peak of 4711.75, then that will mean that the rise that began on October 6 — wave 3 of Subminuette degree — subscript {-8} — is still underway, and the downward/sideways movement from November 5 was of a lower degree. The start of wave 3 of Subminuette degree is shown on the chart in red.

Today’s high validates the alternative analysis from this morning, and it becomes the new principal analysis. The new alternative would be a push above the November 5 high.

So, a You Are Here listing: Under the principal analysis, the S&P 500 is within uptrending wave 4 of Subbitsy degree {-10} within downtrending wave A of Bitsy degree {-9} within downtrending wave 4 of Subminuette degree.

9:35 a.m. New York time

What’s happening now? The S&P 500 E-mini futures traded within a narrow range overnight, remaining below Monday’s high of 4697,50.

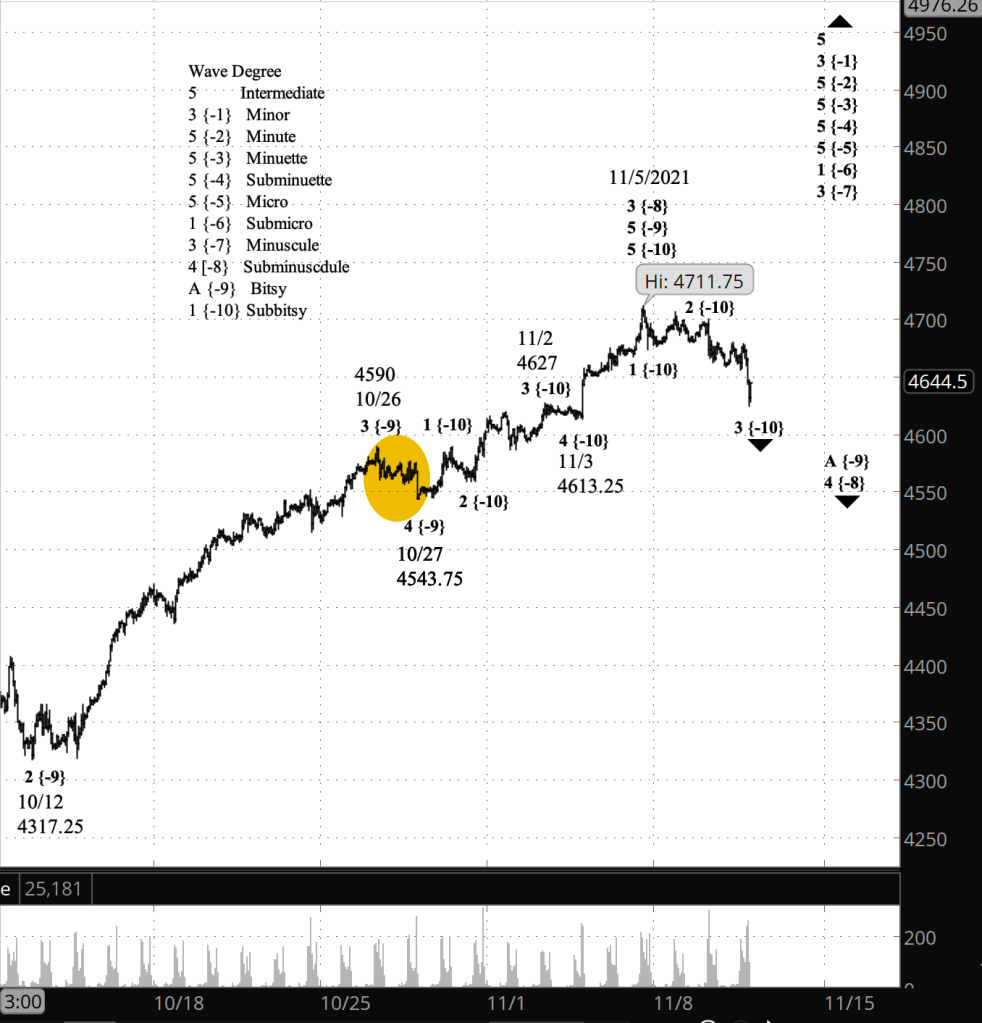
What does it mean? My principal analysis sees a complex of nested movements: The non-committal move is an early stage within the final low-level decline within the first downward leg of a three-part sideways correction that began November 5 from 4711.75.

What’s the alternative? My alternative analysis places that final low-level decline in the futures, as the price continues to trace a small correction before the decline. When that small correction is over, the final decline that will bring the first part of the larger correction to an end.

Charts. The upper chart is half an hour before the closing bell, showing the alternative analysis, which was verified. The lower chart is shortly after the opening bell and shows this morning’s principal analysis, which has now been discarded.

[S&P 500 E-mini futures at 3:30 p.m., 90-minute bars, with volume]
[S&P 500 E-mini futures at 9:35 a.m., 70-minute bars, with volume]

What does Elliott wave theory say? Under my principal analysis, the sideways movement is an early stage of wave 5 of Subbitsy degree — a {-10} subscript on the chart — which is the final, declining portion of wave A of Bitsy degree {-9} within a wave 4 correction of Subminuscule degree {-8}. Bitsy wave A will be followed by a rising B wave that may again reach into the 4690s, and then by declining C wave that will complete Subminuscule wave 4. That 4th wave will be followed by Subminuscule wave 5, which will push above the November 5 peak to new heights.

Under my alternative analysis, the sideways movement is a subwave of wave 4 of Subbitsy degree, a rising correction that will be followed by Subbitsy wave 5. This analysis pushes Subbitsy wave 5 into the future, and when it is complete, the market will progress as described in my principal analysis.

Bottom line: The price will break out above the November 5 peak of 4711.75, the end of wave 3 of Subminuscule degree. The difference between the two analyses is about the timing of that breakout. Under the principal scenario, that breakout will happen sooner; under the alternative, later.

Learning and other resources. Elliott wave analysis provides context, not prophecy. As the 20th century semanticist Alfred Korzybski put it in his book Science and Sanity (1933), “The map is not the territory … The only usefulness of a map depends on similarity of structure between the empirical world and the map.” And I would add, in the ever-changing markets, we can judge that similarity of structure only after the fact.

See the menu page Analytical Methods for a rundown on where to go for information on Elliott wave analysis.

By Tim Bovee, Portland, Oregon, November 16, 2021

Disclaimer

Tim Bovee, Private Trader tracks the analysis and trades of a private trader for his own accounts. Nothing in this blog constitutes a recommendation to buy or sell stocks, options or any other financial instrument. The only purpose of this blog is to provide education and entertainment.

No trader is ever 100 percent successful in his or her trades. Trading in the stock and option markets is risky and uncertain. Each trader must make trading decisions for his or her own account, and take responsibility for the consequences.

License
Creative Commons License

All content on Tim Bovee, Private Trader by Timothy K. Bovee is licensed under a Creative Commons Attribution-ShareAlike 4.0 International License.

Based on a work at www.timbovee.com.
SP500 Analysis

3:30 p.m. New York time

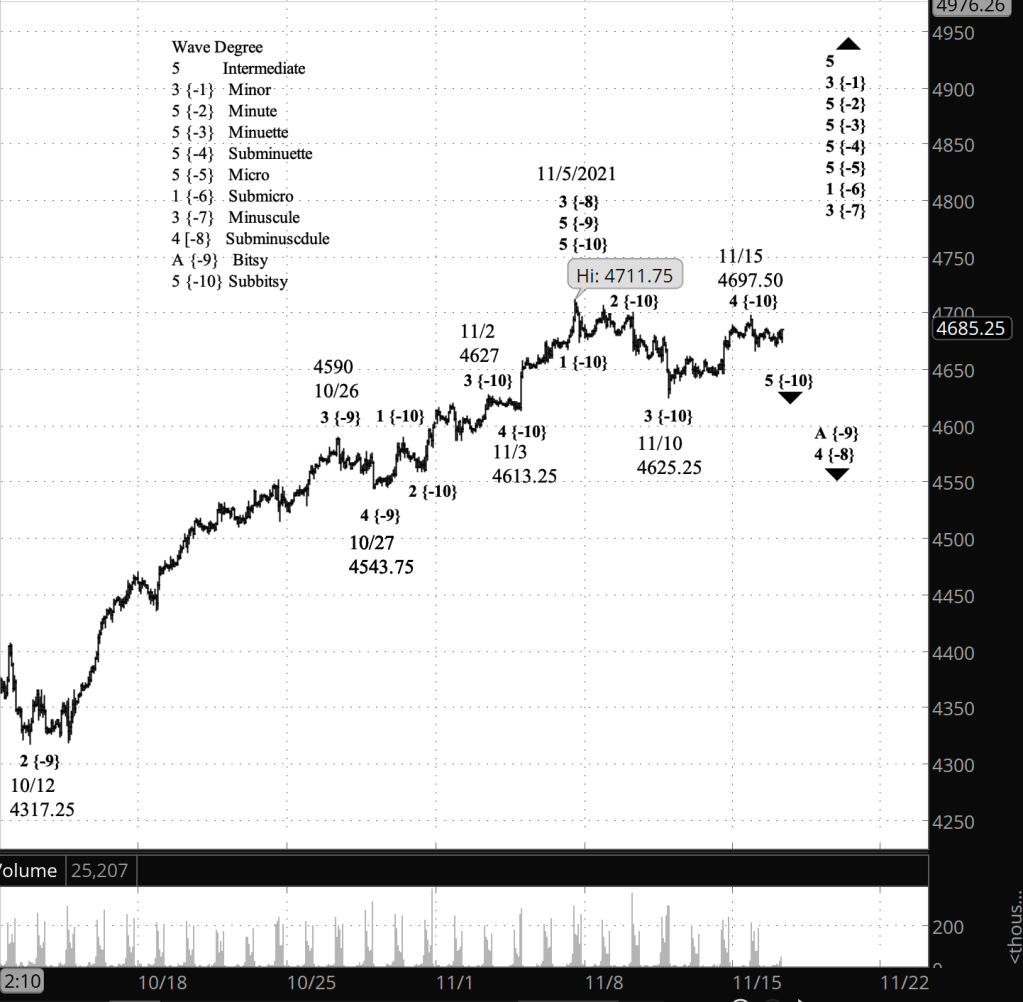
Half an hour before the closing bell. The S&P 500 began to decline during the morning in what may be the final leg within the first segment of a downward correction that began on November 5. In Elliott wave terms, my principal analysis sees the day’s decline as wave 5 of Subbitsy degree — subscript {-10} — within wave A of Bitsy degree {-9} within wave 4 of Subminuscule degree {-8}. The alternative analysis sees wave 4 of Subbitsy degree as still underway. I consider the alternative to be of lower probability because wave 4 of Subminuscule degree and its internal waves must remain below the November 5 peak of 4711.75, and there’s just not that much upside remaining above today’s peak of 4697.50. I’ve updated the chart.

9:35 a.m. New York time

What’s happening now? The S&P 500 E-mini futures rose into the 4690s in overnight trading as the downward correction following the November 5 peak, 4711.75, continues. Within that correction, a smaller, upward correction has been underway since November 10, and the chart can be interpreted to mean that the smaller correction is in its last leg.

What does it mean? The end of the smaller correction will be followed by a decline into the low 4600s and perhaps lower. The end of the decline will also mark the end of the first leg of the larger correction that is underway.

What’s the alternative? The overnight high has come within 15 points of the November 5 peak. If the price exceeds the peak — 4711.75 — then that will trigger a reworking of my principal analysis.

[S&P 500 E-mini futures at 3:30 p.m., 70-minute bars, with volume]

What does Elliott wave theory say? The price is in rising wave 4 of Subbitsy degree — subscript {-10} — within wave A of Bitsy degree {-9} within declining wave 4 of Subminuscule degree {-8}. When Subminuscule 4 is complete, the subsequent wave Subminuscule 5 will carry the price above the November 5 peak.

Although Subbitsy wave 4 appears to be in its 3rd and final wave, it is possible that it will form a compound correction, adding on a second corrective pattern.

The Subminuscule wave 4, if it behaves typically, will end in the 4th wave of the 3rd wave one degree lower. I’ve marked that range with a tan circle on the chart.

Learning and other resources. Elliott wave analysis provides context, not prophecy. As the 20th century semanticist Alfred Korzybski put it in his book Science and Sanity (1933), “The map is not the territory … The only usefulness of a map depends on similarity of structure between the empirical world and the map.” And I would add, in the ever-changing markets, we can judge that similarity of structure only after the fact.

See the menu page Analytical Methods for a rundown on where to go for information on Elliott wave analysis.

By Tim Bovee, Portland, Oregon, November 15, 2021

Disclaimer

Tim Bovee, Private Trader tracks the analysis and trades of a private trader for his own accounts. Nothing in this blog constitutes a recommendation to buy or sell stocks, options or any other financial instrument. The only purpose of this blog is to provide education and entertainment.

No trader is ever 100 percent successful in his or her trades. Trading in the stock and option markets is risky and uncertain. Each trader must make trading decisions for his or her own account, and take responsibility for the consequences.

License
Creative Commons License

All content on Tim Bovee, Private Trader by Timothy K. Bovee is licensed under a Creative Commons Attribution-ShareAlike 4.0 International License.

Based on a work at www.timbovee.com.
SP500 Analysis

3:30 p.m. New York time

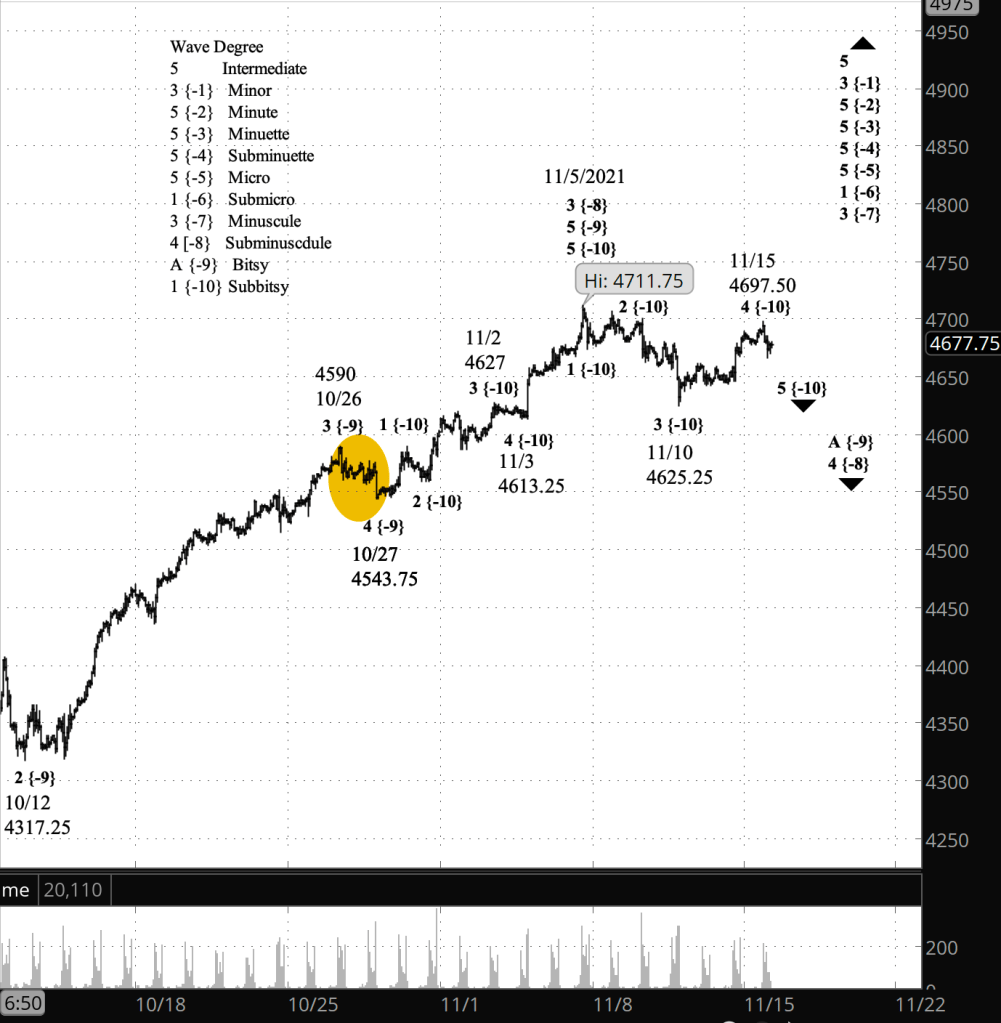
Half an hour before the closing bell. The S&P 500 rose slightly during the day, remaining well below the November 5 peak. No change in the analysis. The upward correction, wave 4 of Subbitsy degree within wave A of Bitsy degree within Wave 4 of Subminuscule degree, continues. I’ve updated the upper chart.

9:35 a.m. New York time

What’s happening now? The S&P 500 E-mini futures traded within a narrow range overnight.

What does it mean? The price continues to trace out a low-level upward correction within a higher level downward correction that began on November 5.

What’s the alternative? The main ambiguity has been how low of a level describes the present smaller correction. At this point it looks like the chart is labelled correctly. More on the subject in the Elliott wave theory section, below.

Charts. The lower chart shows a closer view of the S&P 500 E-mini futures stretching back to mid-October. The upper chart shows a broader view, of the S&P 500 index back to December 2018.

[S&P 500 E-mini futures at 3:30 p.m., hourly bars, with volume]
[S&P 500 index at 9:33 a.m., 2-day bars]

What does Elliott wave theory say? The low-level upward correction is wave 4 of Subbitsy degree — subscript {-10} — within wave A of Bitsy degree (-9} within the larger wave 4 of Subminuscule degree {-8}, a downward correction that began from the November 5 peak. (I use the subscripts for degree-labelling on the charts.)

As always in the early stages of a market movement, I’ve seen some ambiguity about the degree labelling. One degree down from Bitsy degree is Subbitsy, but it’s impossible to know wether or not the waves I labelled as Subbitsy actually are at the subscript {-10} level, or perhaps at {-11} or {-12}. It matters, because the smaller degree labelling impacts how I label the larger degrees.

At this point I’m comfortable with using the Subbitsy degree as the label for the smallest degree I’m tracking on this chart.

Fourth waves tend to be shallow, and the S&P 500’s present positioning is a 4th wave correction (Subbitsy) within a 4th wave correction (Subminuscule). All of that is happening within a rising 3rd wave of Minuscule degree {-7} within a 1st wave of Submicro degree {-8}, and going higher, within a series of 5th waves all the way up to wave 5 of Minute degree {-2}, which is within wave 3 of Minor degree {-1} within wave 5 of Intermediate degree (no subscript). The entire rise from the low of the early pandemic crash on February 23, 2020 is wave 3 of Minor degree.

Wave 5 of Intermediate degree is an expanding Diagonal Triangle that began on December 26, 2018.

Learning and other resources. Elliott wave analysis provides context, not prophecy. As the 20th century semanticist Alfred Korzybski put it in his book Science and Sanity (1933), “The map is not the territory … The only usefulness of a map depends on similarity of structure between the empirical world and the map.” And I would add, in the ever-changing markets, we can judge that similarity of structure only after the fact.

See the menu page Analytical Methods for a rundown on where to go for information on Elliott wave analysis.

By Tim Bovee, Portland, Oregon, November 12, 2021

Disclaimer

Tim Bovee, Private Trader tracks the analysis and trades of a private trader for his own accounts. Nothing in this blog constitutes a recommendation to buy or sell stocks, options or any other financial instrument. The only purpose of this blog is to provide education and entertainment.

No trader is ever 100 percent successful in his or her trades. Trading in the stock and option markets is risky and uncertain. Each trader must make trading decisions for his or her own account, and take responsibility for the consequences.

License
Creative Commons License

All content on Tim Bovee, Private Trader by Timothy K. Bovee is licensed under a Creative Commons Attribution-ShareAlike 4.0 International License.

Based on a work at www.timbovee.com.
SP500 Analysis

3:30 p.m. New York time

Half an hour before the closing bell. The S&P 500 fell back slightly from its peak of the day. No change in the analysis. Wave A of Bitsy degree within wave 4 of Subminuscule degree continues. I’ve updated the chart.

2:15 p.m. New York time

My trades. I’ve closed by short bear call options spread on FXI for a loss and updated the entry analysis with results.

9:35 a.m. New York time

What’s happening now? The S&P 500 E-mini futures rose slightly in overnight trading, reaching 4661.50, and then fell slightly at the opening bell.

What does it mean? The rise is the second upward correction within the first downward leg of a larger correction that began on November 5.

What’s the alternative? The rise could be a level or two smaller than in my principal analysis, which means that the first leg of the larger correction has earlier potential to the downside.

[S&P 500 E-mini futures at 3:30 p.m., hourly bars, with volume]

What does Elliott wave theory say? Under my principal analysis, the rise is wave 4 of Subbitsy degree within wave A of Bitsy degree, the latter being the first wave within a 4th wave correction of Subminuscule degree. The 4th wave of Subbitsy degree will be followed by a 5th wave decline that will likely bring the price within the correction’s target range, defined by the 4th wave of Bitsy degree within the 3rd wave of Subminuscule degree. I’ve marked that 4th wave on the chart with a tan oval.

Under my alternative analysis, the rise is part of a degree one or two levels below Subbitsy within declining wave 3 of Subbitsy degree. This scenario increases the likelihood that Subbitsy wave 3 will reach the target range before the subsequent wave 4 carries the price higher again.

The practical differences between the two scenarios is quite small. Under the principal analysis, the decline into the target range will come later than is likely under the alternative scenario.

Learning and other resources. Elliott wave analysis provides context, not prophecy. As the 20th century semanticist Alfred Korzybski put it in his book Science and Sanity (1933), “The map is not the territory … The only usefulness of a map depends on similarity of structure between the empirical world and the map.” And I would add, in the ever-changing markets, we can judge that similarity of structure only after the fact.

See the menu page Analytical Methods for a rundown on where to go for information on Elliott wave analysis.

By Tim Bovee, Portland, Oregon, November 11, 2021

Disclaimer

Tim Bovee, Private Trader tracks the analysis and trades of a private trader for his own accounts. Nothing in this blog constitutes a recommendation to buy or sell stocks, options or any other financial instrument. The only purpose of this blog is to provide education and entertainment.

No trader is ever 100 percent successful in his or her trades. Trading in the stock and option markets is risky and uncertain. Each trader must make trading decisions for his or her own account, and take responsibility for the consequences.

License
Creative Commons License

All content on Tim Bovee, Private Trader by Timothy K. Bovee is licensed under a Creative Commons Attribution-ShareAlike 4.0 International License.

Based on a work at www.timbovee.com.
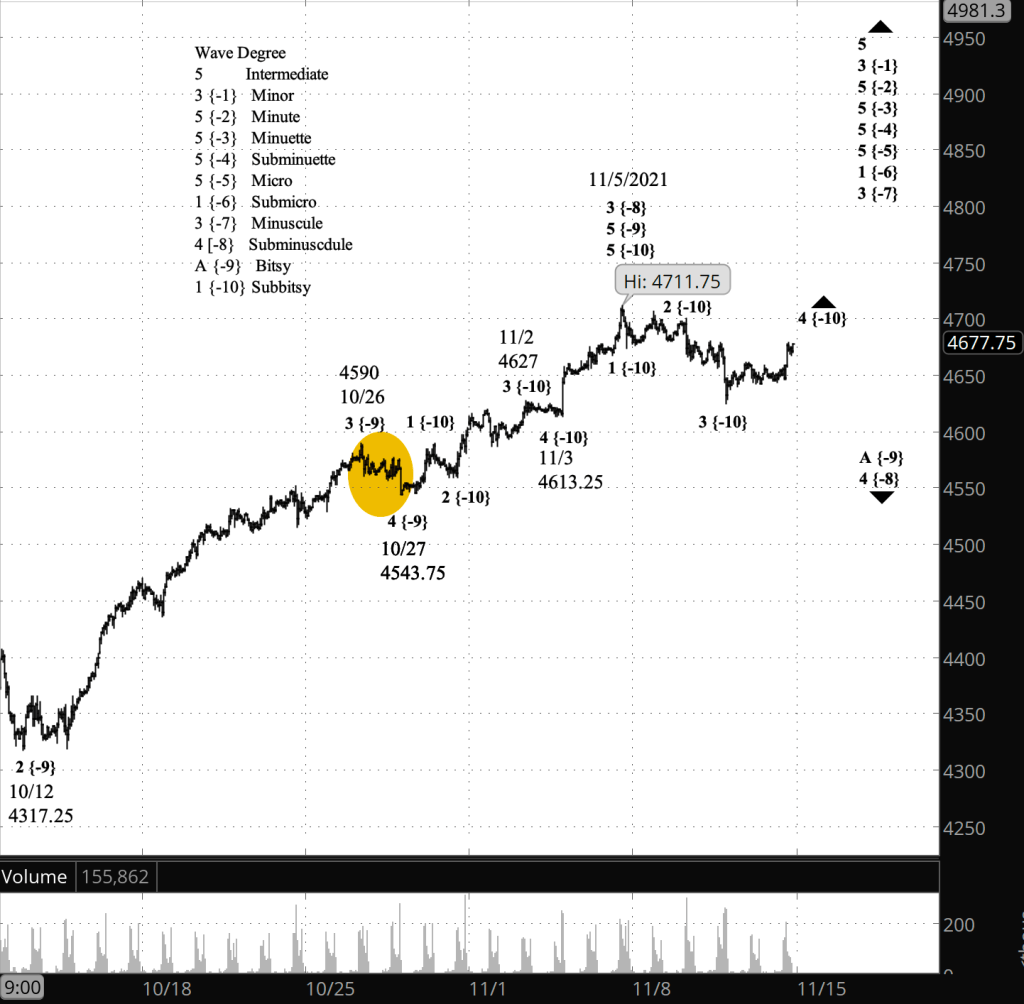
SP500 Analysis

3:30 p.m. New York time

Half an hour before the closing bell. The S&P 500 fell sharply beginning shortly before noon and has so far reached a low of 4625.25, putting it within 35 points of the target range: Wave 4 of Bitsy degree within wave 3 of Subminuette degree, stretching from 4590 down to 4543.75. No change in the analysis. Wave 4 of Subminuette degree continues. I’ve updated the chart.

9:35 a.m. New York time

What’s happening now? The S&P 500 E-mini futures continued their decline in overnight trading, reaching a low of 4656.75.

What does it mean? The correction that began on November 5 has a target in the 4590 down to 4543.75 range. The low puts the price 67 points above the target’s upper boundary. The lower the price descends, the more likely this principal count is correct. The target is marked on the chart by a tan circle.

What’s the alternative? It’s possible that November 5 wasn’t the end of the rise that began October 12 and that the correction we’re seeing is at a smaller level. The further down the price goes, the less likely this scenario is.

[S&P 500 E-mini futures at 3:30 p.m., hourly bars, with volume]

What does Elliott wave theory say? By my principal analysis, the correction is wave 4 of Subminuscule degree. The target is the 4th wave one degree lower within wave 3 of Subminuscule degree. Internally, Subminuscule 4 is in wave A of Bitsy degree, and within that, wave 3 of Subbitsy degree.

The completion of wave 4 of Subminuscule degree will mark the beginning of a 5th wave rise to new highs, which in turn when complete will mark the end of the parent wave 1 of Minsucule degree.

So, long story short: Shallow correction, new highs. Sideways for the short term, upward for the slightly longer term.

By my alternative analysis, wave 3 of Subminuscule degree is still underway, and the pullback is a lower degree correction that will soon reach its end as the 3rd-wave uptrend removes.

Long story short: The same as with the principle analysis (above), except a shallower correction and a longer wait for the end of Minuscule wave 1.

Learning and other resources. Elliott wave analysis provides context, not prophecy. As the 20th century semanticist Alfred Korzybski put it in his book Science and Sanity (1933), “The map is not the territory … The only usefulness of a map depends on similarity of structure between the empirical world and the map.” And I would add, in the ever-changing markets, we can judge that similarity of structure only after the fact.

See the menu page Analytical Methods for a rundown on where to go for information on Elliott wave analysis.

By Tim Bovee, Portland, Oregon, November 10, 2021

Disclaimer

Tim Bovee, Private Trader tracks the analysis and trades of a private trader for his own accounts. Nothing in this blog constitutes a recommendation to buy or sell stocks, options or any other financial instrument. The only purpose of this blog is to provide education and entertainment.

No trader is ever 100 percent successful in his or her trades. Trading in the stock and option markets is risky and uncertain. Each trader must make trading decisions for his or her own account, and take responsibility for the consequences.

License
Creative Commons License

All content on Tim Bovee, Private Trader by Timothy K. Bovee is licensed under a Creative Commons Attribution-ShareAlike 4.0 International License.

Based on a work at www.timbovee.com.