The R-word

11:30 a.m. New York time

OK. We can say the word now. No one likes to say it. No one wants to jinx the economy. Yet, we must face facts. We are, really and truly, in a recession.

No word on it yet from the National Bureau of Economic Research (NBER), the private organization that “officially” declares recessions, generally quite some time after they begin, but instead by something new, the Sahm Rule, created in 2019 by a Federal Reserve economist Claudia Sahm with the goal of providing an early signal for the Fed governors and bank presidents to identify the start of recessions.

Her system is based a moving average of the unemployment rate and backtested for decades has proven to be quite accurate in its calls. A Reuters article last year described her system.

Today, based on a 14.7% unemployment, is the first real-time signal since the Fed added the Rule to its data toolkit, Fred.

Screen Shot 2020-05-08 at 8.26.37 AM

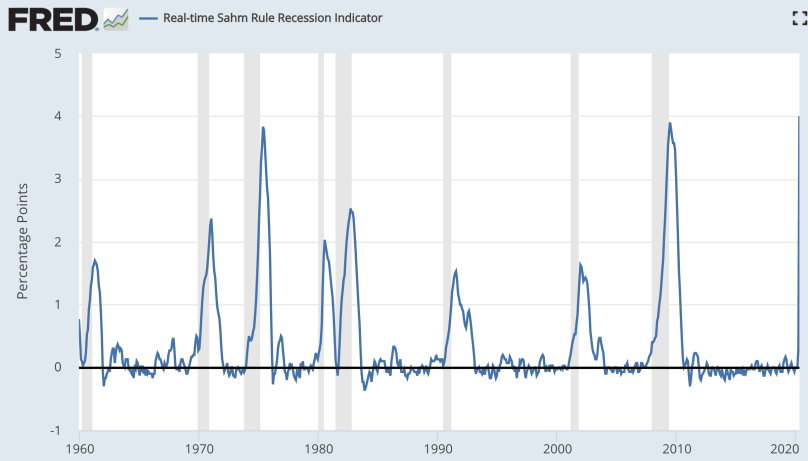
Recessions are shaded grey in the Fred chart. The trigger point for calling a recession with the Sahm Rule is 0.5 or above. Before the pandemic, in February, it stood at 0.00. In March, when job losses from the pandemic was just beginning, it reached 0.30. And a monthly later, in figures released today, it shot up to 4.00, an all time high since December 1959, when source data first became available.

The prior high came during the Great Recession of 2007-2009. The Sahm Rule, had it existed back then, reached the 0.50 trigger in April 2008, four months after the recession began, and peaked at 3.90 in June 2009, a year and a half into the recession.

The velocity this time around is, to say the least, somewhat higher. Astoundingly so, actually. The Coronavirus Recession has triggered the Sahm Rule and reached an all-time high all in a single month. The NBER committee will declare the recession when it has sufficient data — there’s a far more complex analysis than the Sahm Rule provides — but until then we have a basis now for adding the R-word to our lexicon.

By Tim Bovee, Portland, Oregon, May 8, 2020

Read More »

Live: Friday, May 8, 2020

10:50 a.m. New York time

What’s happening now? The S&P 500 retraced 78% of its decline from April 30, reaching 2923, and then withdrew slightly.

What does it mean? The 78.5% retracement is a Fibonacci level, a not uncommon stopping point. However, that’s no guarantee that the price won’t rise more, even beyond 2965, the beginning of the decline from April 30.

Screen Shot 2020-05-08 at 7.48.12 AM

What does Elliott wave theory say? The present A-B-C pattern at the Intermediate degree, the second within a complex 2nd wave of Primary degree, is like the pattern before it a Zigzag, with five subwaves within the A wave, three within the B, and five within the C. From an Elliott standpoint, C has completed its pattern and the only question remaining is how high Minor wave 5 within Intermediate C will go.

What is the alternative? The alternative count has the decline from April 30 as Intermediate wave 1 within Primary wave 3 to the downside, with the present rise as Intermediate wave 2 to the upside. The count would be the same in either case.

The matter will be resolved if the price moves above the April 30 high of 2965, the start of wave 1 under the alternative count. A 2nd wave never moves beyond the start wave wave 1, so if it does slip higher than 2965, the preferred count is correct, buttressed by the fact that a wave C in a Zigzag almost always ends beyond the end of wave A.

If the price declines, then we’ll have to wait for closure of this knotty problem.

What about my trades? Seven days until my three short bear call options spread positions on SPY expire, next Friday. The lots with links to the entry analyses are Lots 12, 13 and 14.

Learning and other resources. Elliott Wave International has long been the leading analytical house based on Elliott wave theory. They make available a number of free educational materials and other resources, in addition to their for-pay subscriptions.

Terminology. Here are some links to information about some of the technical jargon I use.

Charts. On my charts, waves have a subscript showing the degree above or below the Intermediate degree. Here are the subscripts and the degree each represents:

  • {+3} Supercycle
  • {+2} Cycle
  • {+1} Primary
  • No subscript: Intermediate
  • {-1} Minor
  • {-2} Minute
  • {-3} Minuette

By Tim Bovee, Portland, Oregon, May 8, 2020

Read More »

Live: Thursday, May 7, 2020

10:10 a.m. New York time

What’s happening now? The S&P 500 has meandered sideways since May 5.

What does it mean? At this point the chart shows neither confirmation nor rebuttal that the upward correction that began March 22 is continuing.

Screen Shot 2020-05-07 at 7.10.10 AM

What does Elliott wave theory say? It will take a decline below 2717.25, the beginning of Intermediate wave A by my count, to confirm that the upward correction has ended and Primary wave 3 to the downside has begun.

What is the alternative? That Primary wave 3 began with the peak on April 30 at 2965.

What about my trades? Eight days until expiration of my three short bear call options spread positions on SPY — Lots 12, 13 and 14 — on May 15.

Learning and other resources. Elliott Wave International has long been the leading analytical house based on Elliott wave theory. They make available a number of free educational materials and other resources, in addition to their for-pay subscriptions.

Terminology. Here are some links to information about some of the technical jargon I use.

Charts. On my charts, waves have a subscript showing the degree above or below the Intermediate degree. Here are the subscripts and the degree each represents:

  • {+3} Supercycle
  • {+2} Cycle
  • {+1} Primary
  • No subscript: Intermediate
  • {-1} Minor
  • {-2} Minute
  • {-3} Minuette

By Tim Bovee, Portland, Oregon, May 7, 2020

Read More »

Live: Wednesday, May 6, 2020

9:55 a.m. New York time

What’s happening now? In after hours trading the S&P 500 bounded off of the 61.8% Fibonacci retracement, fell back down to the lower Fibonacci level, 38.2%, and then climbed back toward 61.8%, falling short of its prior rise.

What does it mean? This could be the end game for the rise that began on May 3. Or maybe not. Given the state of the chart, I’m unable to see a definitive way forward for the near term.

Screen Shot 2020-05-06 at 6.52.07 AM

What does Elliott wave theory say? Minor wave B, which began on May 3 at 2771, has met its requirements. Whether it can continue to rise depends upon whether it has traced three subwaves. I can count it in a way that shows that it has, but I can also count in a way the shows that it hasn’t. As is often the case with Elliott wave analysis, conclusions are more a matter of probability rather than certainty. The big picture is clearer: Minor B will be followed by a Minor C to the downside, which will complete Intermediate wave B and which will be followed by an Intermediate wave C to the upside.

What is the alternative? It’s possible, although I think it’s a low probability, that the peak attained on April 30 ended Intermediate wave C, and the subsequent decline was the start of Primary wave 3 to the downside.

What about my trades? The downward movement Minor wave C will be my last chance to make a profit on my three short bear call options spread positions on SPY: Lots 12, 13 and 14, all expiring May 15. (The lot numbers link to the entry analyses.)

Learning and other resources. Elliott Wave International has long been the leading analytical house based on Elliott wave theory. They make available a number of free educational materials and other resources, in addition to their for-pay subscriptions.

Terminology. Here are some links to information about some of the technical jargon I use.

Charts. On my charts, waves have a subscript showing the degree above or below the Intermediate degree. Here are the subscripts and the degree each represents:

  • {+3} Supercycle
  • {+2} Cycle
  • {+1} Primary
  • No subscript: Intermediate
  • {-1} Minor
  • {-2} Minute
  • {-3} Minuette

By Tim Bovee, Portland, Oregon, May 6, 2020

Read More »

Live: Tuesday, May 5, 2020

10:25 a.m. New York time

What’s happening now? The S&P 500 continues its upward move within an upward correction of the decline that began in February. The price has retraced half of its initial correction decline and has continued past that Fibonacci level.

What does it mean? The upward movement has satisfied its target requirements — between 38% and 79% — and could enter a decline at any time.

Screen Shot 2020-05-05 at 7.23.40 AM

What does Elliott wave theory say? The present rise is a B wave of Minor degree within wave B of Intermediate degree within wave 2 of Primary degree. By the rules it must break into three waves, and at present it looks more like five waves to me. Given the normal ongoing uncertainty over what degree of wave is being counted, I’m unwilling to label it as three waves at this point.

What is the alternative? It is possible to label the high of April 30 as the end of the Primary wave 2, the low of May 3rd as the end of Intermediate wave 1  within Primary wave 3 and the present upward movement as Intermediate wave 2, although the internals in my count rule out that possibility. None the less, if the price moves below 2174, which is the end of Primary wave 1, then the alternative count is correct.

What about my trades? Continuing to hold three short bear call options spread positions on SPY: Lots 12, 13 and 14, all expiring May 15. (The lot numbers link to the entry analyses.) At this point, as is often the case with in-the-money short options positions, I would have a bigger loss if I exited down than I’ll have if they expire in-the-money.

Learning and other resources. Elliott Wave International has long been the leading analytical house based on Elliott wave theory. They make available a number of free educational materials and other resources, in addition to their for-pay subscriptions.

Terminology. Here are some links to information about some of the technical jargon I use.

Charts. On my charts, waves have a subscript showing the degree above or below the Intermediate degree. Here are the subscripts and the degree each represents:

  • {+3} Supercycle
  • {+2} Cycle
  • {+1} Primary
  • No subscript: Intermediate
  • {-1} Minor
  • {-2} Minute
  • {-3} Minuette

By Tim Bovee, Portland, Oregon, May 5, 2020

Read More »

Live: Monday, May 4, 2020

11:45 a.m. New York time

What’s happening now? The S&P 500 dropped to 2771 Sunday night and reversed to the upside, bouncing off of the 78.6% Fibonacci retracement level.

What does it mean? The price will next enter a short-term upward trend, the middle movement of three.

Screen Shot 2020-05-04 at 8.38.45 AM

What does Elliott wave theory say? By my count the Minor A wave to the downside is complete, having shows five sort-of-unclear waves (I really find Minor A hard to count). Minor A is a subwave of Intermediate B to the downside within Primary 2 to the upside, all within Cycle 1, a major downtrend that began on February 19.

B waves tends to correct anywhere from 38% to 79% of wave A, so we can place a tentative target between 2850 and 2925, give or take.

What is the alternative? The alternative posits that Minor wave B is still not complete. If it moves below a 90% retracement of wave A (2742 on the S&P 500), then it is a Flat rather than a Zigzag.)

What about my trades? The clock is running out on my three short bear call options spread positions on SPY: Lots 12, 13 and 14. They all expire May 15. If SPY reaches below 261, then all will be out of the money and will expire for maximum profit (or be sold for a profit). Anything below 263 makes one position profitable. (The lot numbers link to the entry analyses.)

I one had a lawyer who’s favorite line was “It is what it is.” That sentiment seems to apply here.

Learning and other resources. Elliott Wave International has long been the leading analytical house based on Elliott wave theory. They make available a number of free educational materials and other resources, in addition to their for-pay subscriptions.

Terminology. Here are some links to information about some of the technical jargon I use.

Charts. On my charts, waves have a subscript showing the degree above or below the Intermediate degree. Here are the subscripts and the degree each represents:

  • {+3} Supercycle
  • {+2} Cycle
  • {+1} Primary
  • No subscript: Intermediate
  • {-1} Minor
  • {-2} Minute
  • {-3} Minuette

By Tim Bovee, Portland, Oregon, May 4, 2020

Read More »

Live: Friday, May 1, 2020

11:20 a.m. New York time

What’s happening now? The S&P 500 price decline that began April 30 so far has reached -4.5%, attaining its low point of 2830.75 in the early morning hours before the opening bell. It has since moved sideways in a very small intraday movement.

What does it mean? The decline is a correction to the downside within a correction to the upside. I expect the decline, when it reverses upward, to return to the 2965 level or beyond.

Screen Shot 2020-05-01 at 8.18.22 AM

What does Elliott wave theory say? 

The decline has retraced 50% of wave A, within the 38% to 79% retracement range that is common among B waves within Zigzag corrections. The decline could end where it without violating any rules, swinging up again into a C wave that will complete Primary wave 2. A 79% retracement would bring the price down to around 2770. If it goes further, then we’re more likely looking at a Flat, which tends to retrace at least 90% of the A wave.

The B wave down so far, to my eye, has more than three waves, which violates a rule of Elliott wave analysis. I’ll wait for some clarity before reaching a decision about what’s next.

What is the alternative? I have no alternative at this point.

What about my trades? With my three short bear call options spread positions on SPY,  Lots 12, 13 and 14, all expiring May 15, I’ve reached the point where the Elliott wave analysis is fairly irrelevant. The positions presently have a range of 6% to 11% above maximum potential loss, so I hold them, since at expiration my loss will be less than I would have if I exited now. If the price dips down to the 2600s before expiration, I could get out with a small profit. So, in terms of trading, it’s very binary: Either the S&P 500 drops enough to allow me a profit, or it doesn’t, and I have a loss. A very simple analysis.

Learning and other resources. Elliott Wave International has long been the leading analytical house based on Elliott wave theory. They make available a number of free educational materials and other resources, in addition to their for-pay subscriptions.

Terminology. Here are some links to information about some of the technical jargon I use.

Charts. On my charts, waves have a subscript showing the degree above or below the Intermediate degree. Here are the subscripts and the degree each represents:

  • {+3} Supercycle
  • {+2} Cycle
  • {+1} Primary
  • No subscript: Intermediate
  • {-1} Minor
  • {-2} Minute
  • {-3} Minuette

By Tim Bovee, Portland, Oregon, May 1, 2020

Read More »

Live: Thursday, April 30, 2020

9:45 a.m. New York time

What’s happening now? The S&P 500 rose above the 61.8% Fibonacci retracement level, which is a common turning point, and then turned and at the opening had declined 20 points below the retracement level.

What does it mean? The index, possibly has completed its upward movement and has begun a descent, perhaps to levels near 2717, the beginning of the most recent leg up.

Screen Shot 2020-04-30 at 7.16.45 AM

What does Elliott wave theory say? The internal form of the Intermediate A wave, within the Primary 2nd wave upward correction, has satisfied all requirements. The ensuing B wave’s end point will depend upon whether the Primary 2 second pattern — the second part of a complex correction — proves to be a Zigzag or a Flat. A Flat pattern would carry down to 90% or more of the length of wave A; a Zigzag would typically have less of a decline relative to A and in no case would it move beyond the start of A.

What is the alternative?  Two alternatives: Wave A is not yet complete and the rise will soon resume, or what I’ve labeled as wave is really a wave C, and what I’ve labelled as wave B is the beginning of the Primary 3rd wave down, which will reach new lows in the crash that began on February 19.

What about my trades? I’ve set stops on my three short bear call options spread positions on SPY, Lots 12, 13 and 14, all expiring May 15. They will be triggered as soon as each lot shows a minimal profit. Basically, it’s a tactic that says, Get out without a loss but don’t hang on for big profits. (The lot numbers link to the entry analyses.)

Learning and other resources. Elliott Wave International has long been the leading analytical house based on Elliott wave theory. They make available a number of free educational materials and other resources, in addition to their for-pay subscriptions.

Terminology. Here are some links to information about some of the technical jargon I use.

Charts. On my charts, waves have a subscript showing the degree above or below the Intermediate degree. Here are the subscripts and the degree each represents:

  • {+3} Supercycle
  • {+2} Cycle
  • {+1} Primary
  • No subscript: Intermediate
  • {-1} Minor
  • {-2} Minute
  • {-3} Minuette

By Tim Bovee, Portland, Oregon, April 30, 2020

Read More »

Live: Wednesday, April 29, 2020

9:55 a.m. New York time

What’s happening now? The S&P 500 bumped against the Fibonacci 61.8% retracement of its fall that began February 19. The index peak in the rise beginning March 22 is 2926.75, just below the 2930.12 Fibonacci point.

What does it mean? The 61.8% retracement level is often a place where market movements pause or reverse. I have long considered

Screen Shot 2020-04-29 at 6.52.35 AM

What does Elliott wave theory say? The rise is wave 2 of Primary degree within wave 1 of cycle degree. Structurally, it is part of a complex upward correction within the larger downtrend. The first part of the correction had a Zigzag form. If the present leg up — Intermediate wave A within Primary wave 2 — peaks around the 61.8% retracement level, then it will have a Flat form. Once the present A wave is followed by B and C waves, it may mark the end of the upward correction, or it the movement could extend yet again.

In my experience this sort of complexity is a bit unusual in 2nd waves. Not unheard of, but 2nd waves tend to be simple Zigzags, leaving the fancy morphologies to 4th waves.

What is the alternative? A move beyond the start of Primary wave 1, at 3397.50, would mean that we aren’t in Primary wave 2 and something else is happening. It would demand a major recount.

What about my trades? It is 16 days before my three short bear call options spread positions on SPY expire: Lots 12, 13 and 14, all expiring May 15. (The lot numbers link to the entry analyses.) Their current status ranges from 12% to 17% above maximum potential loss. So what makes sense is to hold until they either fall below or expire for 100% of maximum loss.

Learning and other resources. Elliott Wave International has long been the leading analytical house based on Elliott wave theory. They make available a number of free educational materials and other resources, in addition to their for-pay subscriptions.

Terminology. Here are some links to information about some of the technical jargon I use.

Charts. On my charts, waves have a subscript showing the degree above or below the Intermediate degree. Here are the subscripts and the degree each represents:

  • {+3} Supercycle
  • {+2} Cycle
  • {+1} Primary
  • No subscript: Intermediate
  • {-1} Minor
  • {-2} Minute
  • {-3} Minuette

By Tim Bovee, Portland, Oregon, April 29, 2020

Read More »

Live: Tuesday, April 28, 2020

10:55 a.m. New York time

What’s happening now? The S&P 500 pierced 2885, the prior high, attained on April 16, within its correction to the upside within a larger downtrend that began February 19. After peaking at 2913.50, it then reversed and moved back below the level of the prior high. (The piercing is marked with a yellow oval.)

Screen Shot 2020-04-28 at 7.27.57 AM

What does it mean? The upward correction is extending. The first portion took 24 days to complete, and although it is not guaranteed, the second portion will likely take a similar period to complete its work.

What does Elliott wave theory say? The piercing of 2885 broke a firm rule in Elliott wave theory: A second wave cannot move beyond the beginning of the 1st wave that preceded it. Since it was pierced, then the hypothesis that the 3rd wave of Primary degree to the downside is underway has been discredited. The Primary 2nd wave has developed into a combination. The first portion — A, B, C — of Intermediate degree was followed by a rather shallow X wave, which separates the portions, and will likely be followed by either a Flat or another Zigzag. Within the current movement, the count of the Intermediate A wave is complete, and the pullback suggests the possibility that a B wave to the downside has begun. Wave B will be followed by a wave C.

What is the alternative? I’ve got nothing at this point. The piercing of the 2885 level makes the preferred count quite clear.

What about my trades? I hold three short bear call options spread positions on SPY: Lots 12, 13 and 14, all expiring May 15. (The lot numbers link to the entry analyses.) The development of a combination pattern within the 2nd wave correction guarantees that the positions will produce losses.

My best bet will be to exit at the end of wave B. Wave A began at 2717.25. If the present pattern is a Zigzag, then a move below 2717.25 will violate a rule of Elliott wave analysis, and something other than a Zigzag is developing. If the price fails to retrace 90% or more of wave A, down around 2730, then it is a Zigzag. So a Flat will give me the best chance to mitigate my losses, and a Zigzag could well give me some good mitigation.

Holding on here. Waiting is.

Terminology. Here are some links to information about some of the technical jargon I use.

On the charts, waves have a subscript showing the degree above or below the Intermediate degree. Here are the subscripts and the degree each represents:

  • {+3} Supercycle
  • {+2} Cycle
  • {+1} Primary
  • No subscript: Intermediate
  • {-1} Minor
  • {-2} Minute
  • {-3} Minuette

By Tim Bovee, Portland, Oregon, April 28, 2020

Read More »