Trader’s Notebook

3:30 p.m. New York time

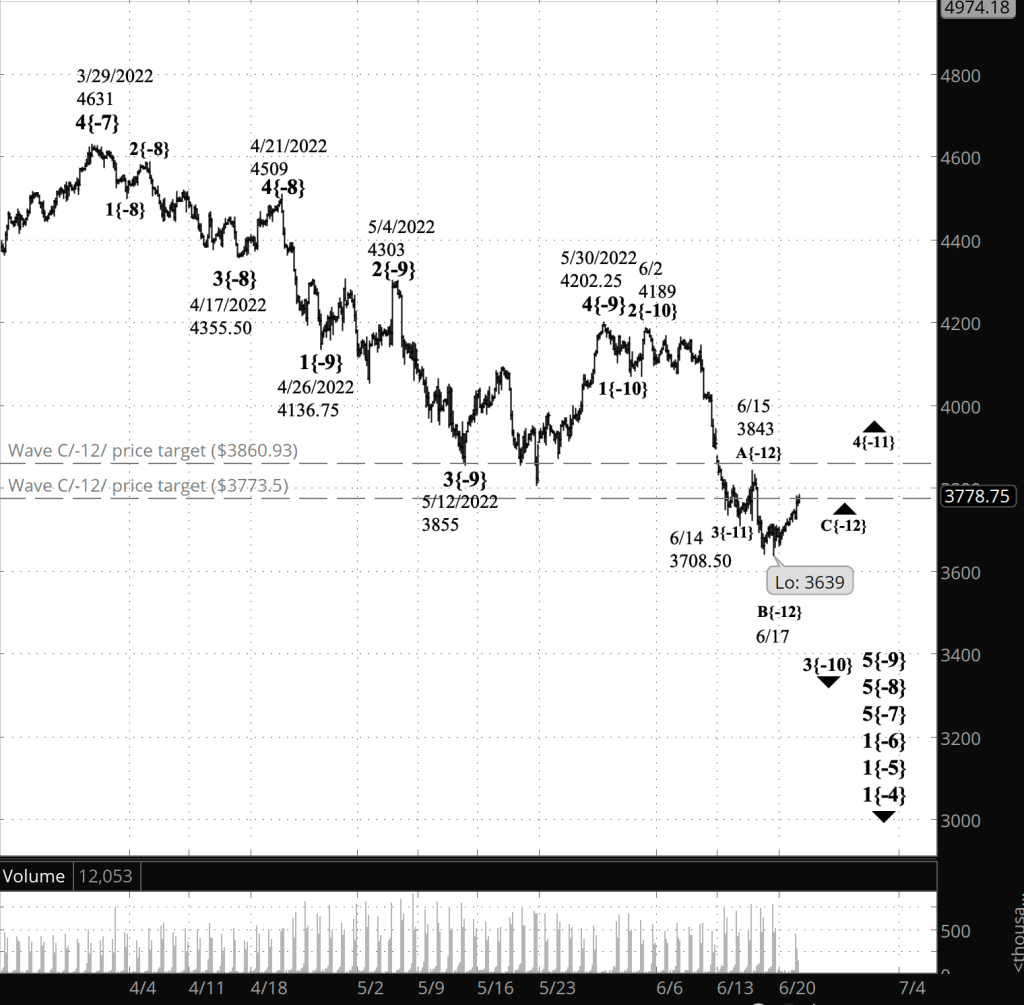
Half an hour before the closing bell. The S&P 500 has declined during the session, falling from the overnight peak of 3948 on the futures down at one point to below 3900. The upward correction, wave 4{-11}, continues, as does its rising subwave, C{-12}. The C wave has met all requirements for completion, meaning that the overnight high may have been the end of the corrective pattern, or there may have further upside ahead. I’ve updated the chart.

10:35 a.m. New York time

NKE earnings play entry. I’ve entered a short bear call vertical spread on NKE timed to coincide with an earnings announcement, using options that trade for the last time on August 19, and have posted an analysis of the trade.

9:35 a.m. New York time

What’s happening now? The S&P 500 E-mini futures continued to rise in overnight trading, reaching into the mid-3900s before pulling back slightly.

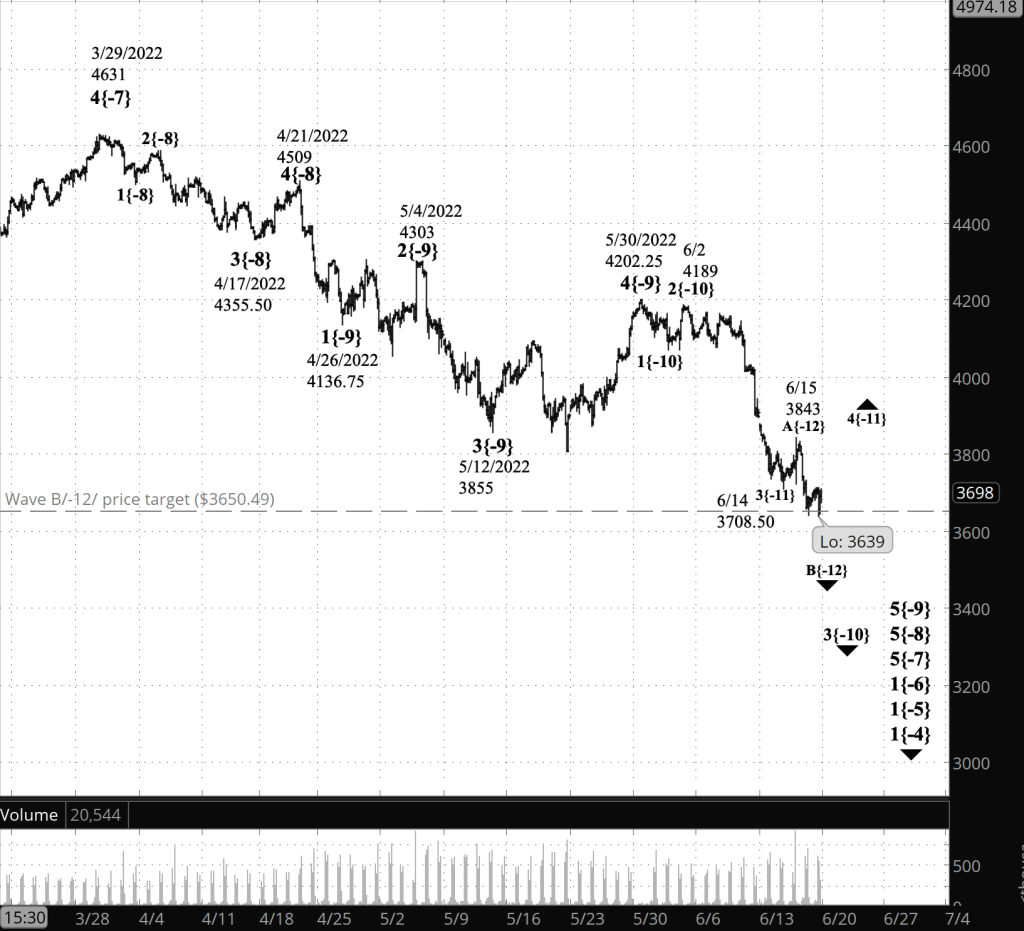
What does it mean? The upward correction that began on June 14 continues and is in its third leg, which may be the final segment of the correction. The correction has retraced 50% of the preceding decline.

What is the alternative? The correction may form a compound structure, composed of two or three corrective patterns.

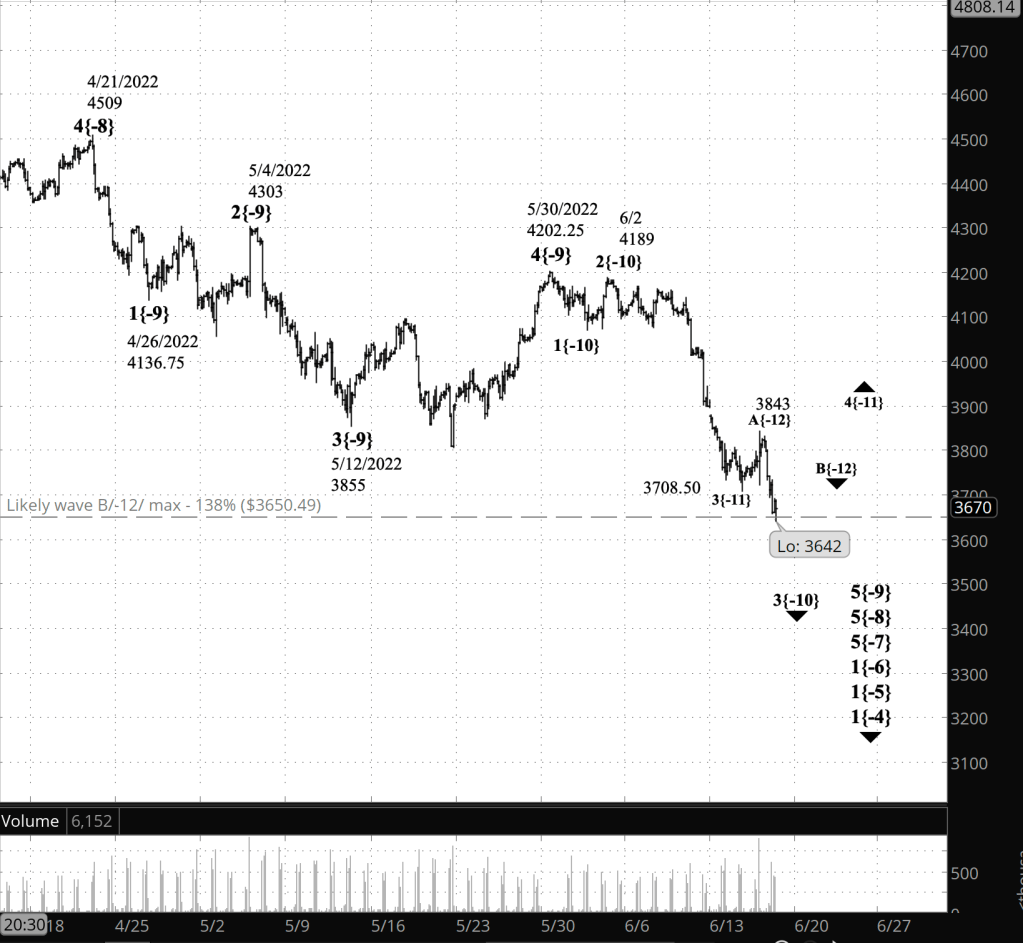
The Chart. I’ve placed a Fibonacci retracement ladder on the chart, in red. It shows the extent to which the upward correction has retraced the decline that preceded it.

[S&P 500 E-mini futures at 3:30 p.m., 160-minute bars, with volume]

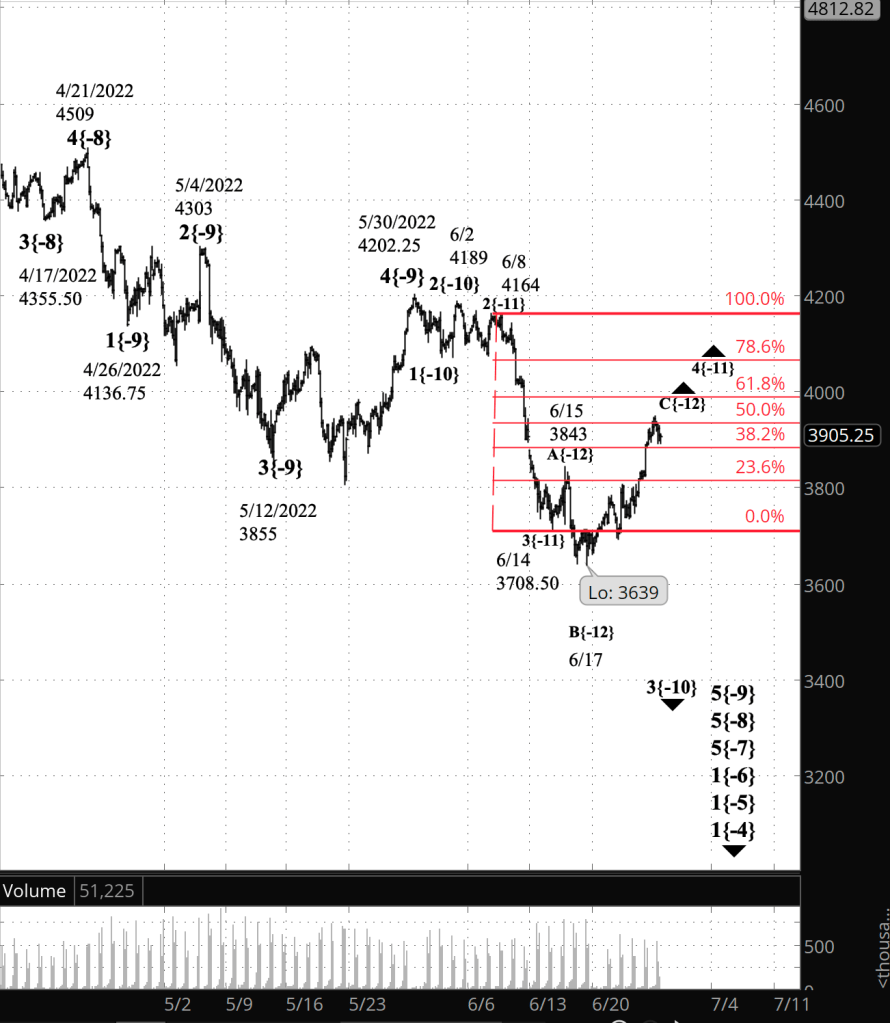
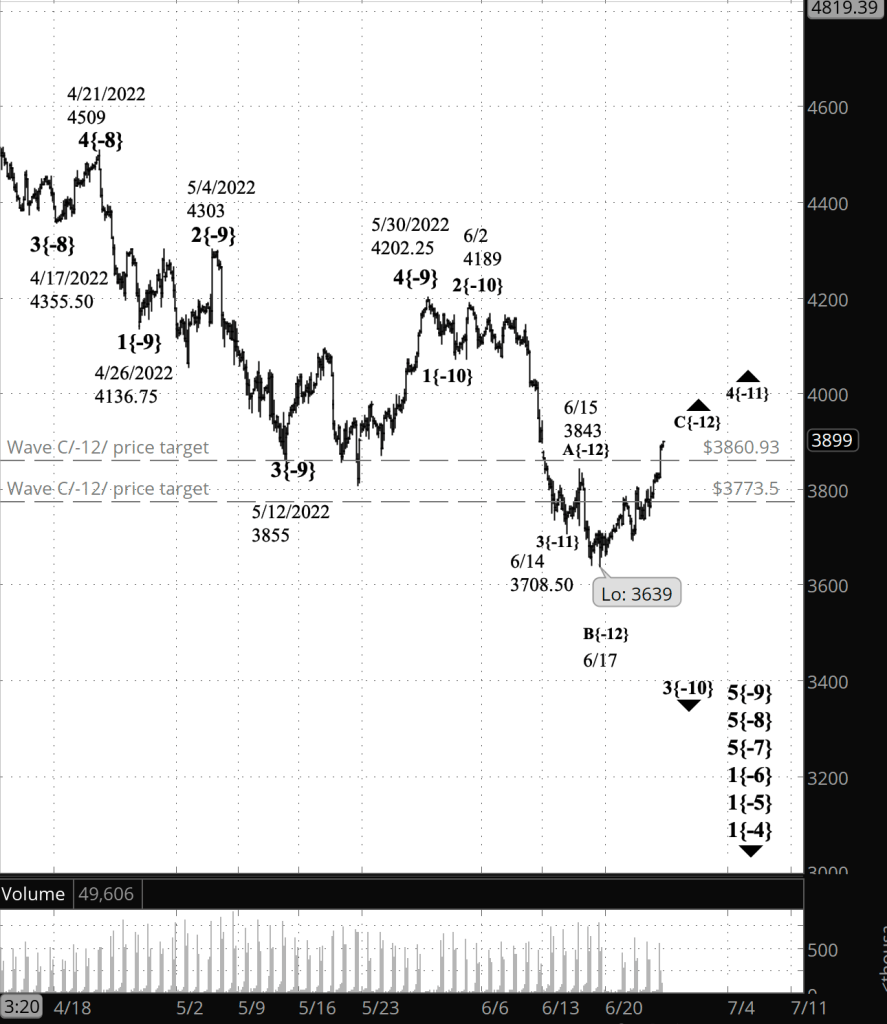
What does Elliott wave theory say? Wave 4{-11}, the upward correction that began on June 14 from 3708.50, has retraced 50% of the preceding decline, wave 3{-11}, which began on June 8 from 4164. The correction is tracing a Flat pattern, which is in its 3rd wave — wave C{-12}. Corrections tend to end close to Fibonacci retracement levels. A 50% retracement (3636.25) is one of the Fibonacci levels. So are the 68.8% (3990) and 78.6% (4066.52) retracements.

Most corrections end with the third wave. In this case, wave 4{-11} will be followed by wave 5{-11}, a resumption of the downtrend that began on June 2. The 5th wave can be expected to carry the price below the lowest point of the preceding 4th wave, 3639, although that’s not always the case. Sometimes a 5th wave will come up short, a condition called “truncation” in Elliott wave terminology.

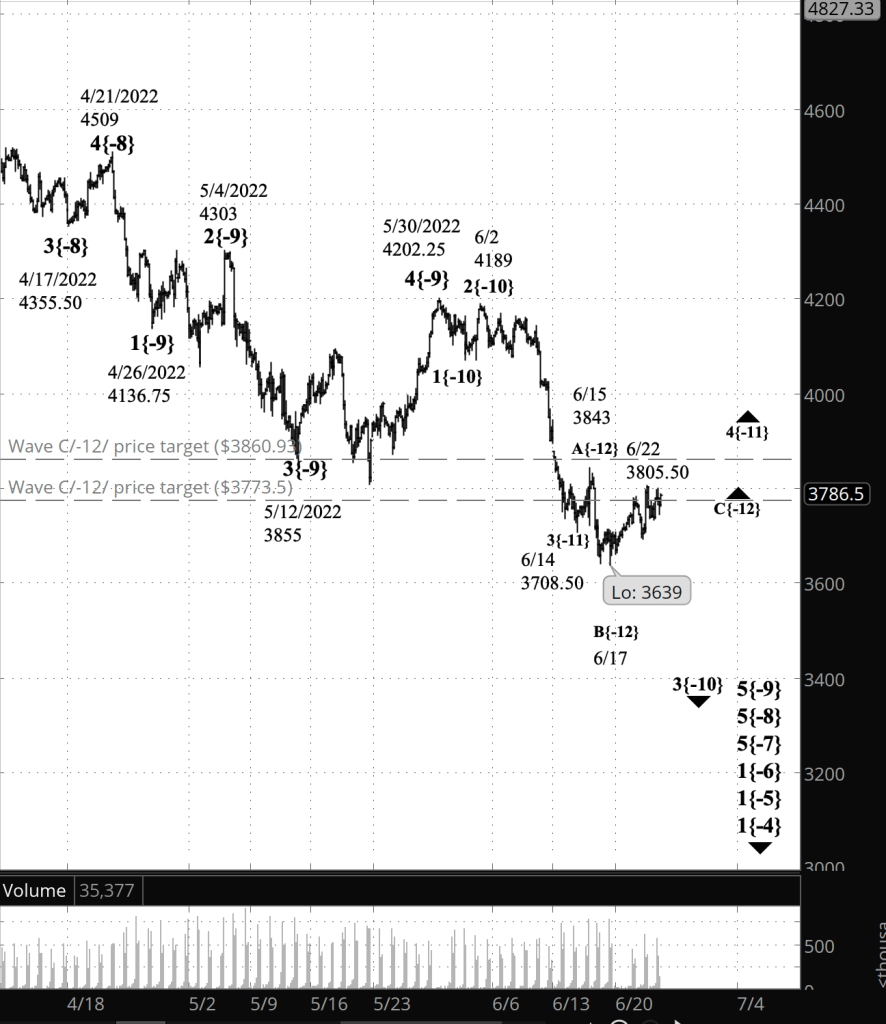
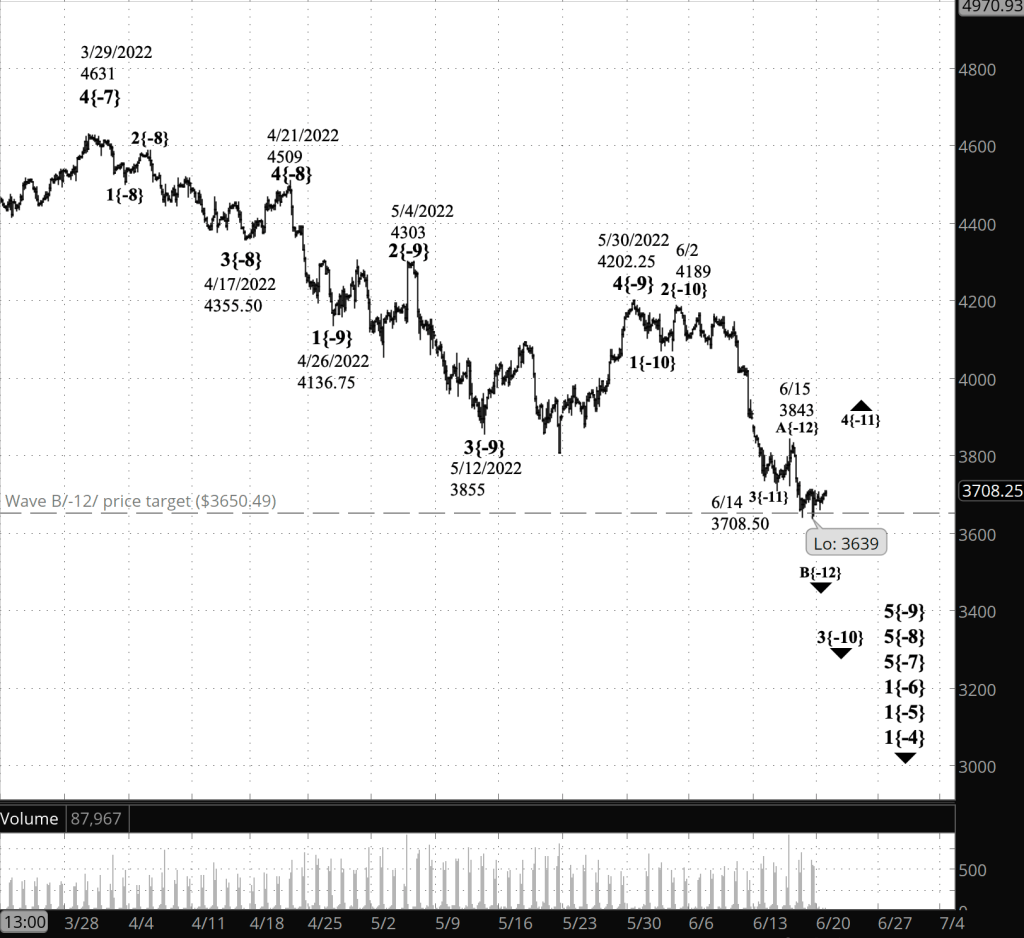
Some corrections form a compound pattern. If that happens with wave 4{-11}, then subwave C{-12} will be followed by a connecting wave, X{-12}, and then a second corrective pattern. Some compound corrections contain three corrective patterns.

Whether wave 4{-11} is a simple structure or a compound one, it will be followed by wave 5{-11}, as described above.

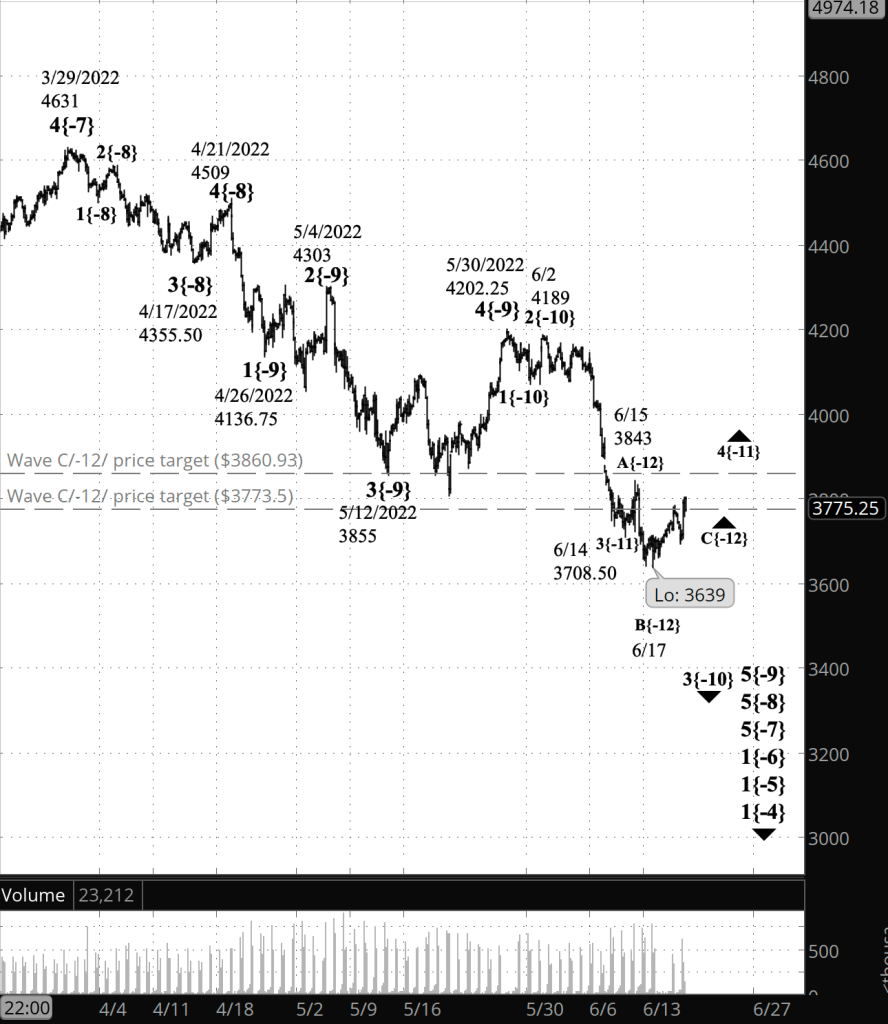
This is all happening within wave 3{-10}, a downtrend that began on June 2 from 4189. That 3rd wave, in turn, is a child of wave 5{-9}, which began on May 30 from 4202.25. All are subwaves of wave 5{-8}, which began on April 21 from 4509.

We Are Here.

These are the waves currently in progress under my principal analysis. Each line on the list shows the wave number, with the subscript in curly brackets, the traditional degree name, the starting date, the starting price of the S&P 500 E-mini futures, and the direction of the wave.

  • S&P 500 Index:
  • 5{+3} Supercycle, 7/8/1932, 4.40 (up)
  • 5{+2} Cycle, 12/9/1974, 60.96 (up)
  • 5{+1} Primary, 3/6/2009, 666.79 (up)
  • 5{0} Intermediate, 12/26/2018, 2346.58 (up)
  • 4{-1} Minor, 1/4/2022 4818.62 (down)
  • 1{-2} Minute, 1/4/2022 4818.62 (down)
  • S&P 500 Futures and index:
  • 1{-3} Minuette, 1/4/2022, 4808.25 (down) (futures), 4818.62 (down) (index)
  • S&P 500 Futures:
  • 1{-4} Subminuette, 1/4/2022, 4808.25 (down)
  • 1{-5} Micro, 1/4/2022, 4808.25 (down)
  • 1{-6} Submicro, 1/4/2022, 4808.25 (down)
  • 5{-7} Minuscule, 3/29/2022, 4631 (down)
  • 5{-8} Subminuscule, 4/21/2022, 4509, (down)

Learning and other resources. Elliott wave analysis provides context, not prophecy. As the 20th century semanticist Alfred Korzybski put it in his book Science and Sanity (1933), “The map is not the territory … The only usefulness of a map depends on similarity of structure between the empirical world and the map.” And I would add, in the ever-changing markets, we can judge that similarity of structure only after the fact.

See the menu page Analytical Methods for a rundown on where to go for information on Elliott wave analysis.

By Tim Bovee, Portland, Oregon, June 27, 2022

Disclaimer

Tim Bovee, Private Trader tracks the analysis and trades of a private trader for his own accounts. Nothing in this blog constitutes a recommendation to buy or sell stocks, options or any other financial instrument. The only purpose of this blog is to provide education and entertainment.

No trader is ever 100 percent successful in his or her trades. Trading in the stock and option markets is risky and uncertain. Each trader must make trading decisions for his or her own account, and take responsibility for the consequences.

License
Creative Commons License

All content on Tim Bovee, Private Trader by Timothy K. Bovee is licensed under a Creative Commons Attribution-ShareAlike 4.0 International License.

Based on a work at www.timbovee.com.

Trader’s Notebook

3:30 p.m. New York time

Half an hour before the closing bell. The S&P 500 has risen during the session, reaching the upper 3800s on the futures, a level above the upper boundary of the price target range. By my count wave C{-12} has fulfilled all of its requirements, and its just a question of how far the final subwave, a 5th, will travel.

11 a.m. New York time

FDX earnings play exit. I’ve exited my short bull put options spread on FDX for 38.7% of maximum potential profit, exceeding my normal goal of 25% of max, and have updated the trade analysis with results.

9:35 a.m. New York time

What’s happening now? The S&P 500 E-mini futures reached into the mid-3800s in overnight trading.

What does it mean? The upward correction that began on June 14 continues, is in its last leg, and is trading within the likely price target range of that final segment, between 3773.50 and 3860.93. The correction will be followed by a resumption of the downtrend that began on June 2.

The upper and lower boundaries of the price target range are marked on the chart by dashed lines.

What is the alternative? Some corrections form a compound structure, containing two or three corrective patterns. If that occurs, then the end of the present rise won’t be the end of the correction but will instead be followed by a connecting wave and then a second corrective pattern.

[S&P 500 E-mini futures at 3:30 p.m., 160-minute bars, with volume]

What does Elliott wave theory say? On the upper chart, wave C{-12}, the third and most likely final subwave within an upward correction, wave 4{-11}, is itself in its final segment, wave 5{-13}.

Most 4th waves end with the third subwave. Sometimes the correction creates a compound structure of two or three corrective patterns separated by connecting waves. If that occurs within wave 4{-11}, then upward wave C{-12}, the end of the first corrective pattern, will be followed by downward wave X{-11} — the connector — and then a second corrective pattern. Such an expansion is called a compound correction in Elliott wave terminology and can contain up to three corrective patterns.

Wave 4{-11} has taken the form of a Flat, and the C wave of that pattern tends to be 100% to 165% as long a the preceding A wave.

The dashed lines show the likely price range wherein wave C{-12} will end. The lower boundary, at 3773.50, would have made the C wave as long as the preceding A wave, 134.50 points. The price has already exceeded that level. The upper boundary, at 3850.93, is 165% of wave A’s length.

Once wave 4{-11} is complete, it will be followed by wave 5{-11}, the final wave of the parent wave 3{-10}, which began on June 2 from 4189. Working up the family tree, wave 3{-10} is the middle wave within wave 5{-9}, which began on May 30. The end of wave 5{-9} will also be the end of two larger waves, wave 5{-8}, which began on April 21, and wave 5{-7}, which began on March 29, and also of wave 1{-6}, which began on January 4.

After wave 1{-6} reaches completion, it will be followed by an upward correction, wave 2{-6}, whose rise will retrace a portion of the decline since early January. Corrections, of course, are classic head-fakes. Wave 2{-6} will be followed by an energetic wave 3{-6} that will carry the price down by an impressive amount.

We Are Here.

These are the waves currently in progress under my principal analysis. Each line on the list shows the wave number, with the subscript in curly brackets, the traditional degree name, the starting date, the starting price of the S&P 500 E-mini futures, and the direction of the wave.

  • S&P 500 Index:
  • 5{+3} Supercycle, 7/8/1932, 4.40 (up)
  • 5{+2} Cycle, 12/9/1974, 60.96 (up)
  • 5{+1} Primary, 3/6/2009, 666.79 (up)
  • 5{0} Intermediate, 12/26/2018, 2346.58 (up)
  • 4{-1} Minor, 1/4/2022 4818.62 (down)
  • 1{-2} Minute, 1/4/2022 4818.62 (down)
  • S&P 500 Futures and index:
  • 1{-3} Minuette, 1/4/2022, 4808.25 (down) (futures), 4818.62 (down) (index)
  • S&P 500 Futures:
  • 1{-4} Subminuette, 1/4/2022, 4808.25 (down)
  • 1{-5} Micro, 1/4/2022, 4808.25 (down)
  • 1{-6} Submicro, 1/4/2022, 4808.25 (down)
  • 5{-7} Minuscule, 3/29/2022, 4631 (down)
  • 5{-8} Subminuscule, 4/21/2022, 4509, (down)

Learning and other resources. Elliott wave analysis provides context, not prophecy. As the 20th century semanticist Alfred Korzybski put it in his book Science and Sanity (1933), “The map is not the territory … The only usefulness of a map depends on similarity of structure between the empirical world and the map.” And I would add, in the ever-changing markets, we can judge that similarity of structure only after the fact.

See the menu page Analytical Methods for a rundown on where to go for information on Elliott wave analysis.

By Tim Bovee, Portland, Oregon, June 24, 2022

Disclaimer

Tim Bovee, Private Trader tracks the analysis and trades of a private trader for his own accounts. Nothing in this blog constitutes a recommendation to buy or sell stocks, options or any other financial instrument. The only purpose of this blog is to provide education and entertainment.

No trader is ever 100 percent successful in his or her trades. Trading in the stock and option markets is risky and uncertain. Each trader must make trading decisions for his or her own account, and take responsibility for the consequences.

License
Creative Commons License

All content on Tim Bovee, Private Trader by Timothy K. Bovee is licensed under a Creative Commons Attribution-ShareAlike 4.0 International License.

Based on a work at www.timbovee.com.

FDX Trade

FedEx Corp. (FDX)

Update 6/24/2022: I exited my short bull put vertical spread on FDX, 21 days before expiration, for a $0.92 debit per contract/share, a profit before fees of $58 per contract. Shares were trading at $236.52, up $10.07 from the entry level.

The Implied Volatility Rank at exit was 79.1%, up 0.1 points from the entry level.

I exited on the day after entry because the position reached 38.7% of maximum potential profit, exceeding my normal 25% of max exit point for earnings plays

Shares rose by 4.4% over one day for a +1,623% annual rate. The options position produced a 63.0% return for a +23,011% annual rate.


I have entered a short bull put vertical spread on FDX, using options that trade for the last time 22 days hence, on July 15. The premium is a $1.50 credit per contract share and the stock at the time of entry was priced at $226.45.

The Implied Volatility Ratio stood at 79%.

Premium:$1.50Expire OTM
FDX-bull put spreadStrikeOddsDelta
Calls/Puts
Long210.0071.0%26
Break-even216.5067.0%29
Short215.0063.0%32

The premium is 60% of the width of the position’s short/long spread. The profit zone covers a 4.4% move to the downside and an unlimited move to the upside.

The risk/reward ratio is 2.3:1, with maximum risk of $350 and maximum reward of $150 per contract.

How I chose the trade. The trade was placed to coincide with FDX’s earnings announcement, after the closing bell on the day of entry. The short strike was set to coincide with the expected move of $11.57 either way, based on options pricing, which gives a price range of $215.45 to $238.59.

By Tim Bovee, Portland, Oregon, June 23, 2022

Disclaimer

Tim Bovee, Private Trader tracks the analysis and trades of a private trader for his own accounts. Nothing in this blog constitutes a recommendation to buy or sell stocks, options or any other financial instrument. The only purpose of this blog is to provide education and entertainment.

No trader is ever 100 percent successful in his or her trades. Trading in the stock and option markets is risky and uncertain. Each trader must make trading decisions for his or her own account, and take responsibility for the consequences.

License
Creative Commons License

All content on Tim Bovee, Private Trader by Timothy K. Bovee is licensed under a Creative Commons Attribution-ShareAlike 4.0 International License.

Based on a work at www.timbovee.com.

Trader’s Notebook

3:30 p.m. New York time

Half an hour before the closing bell. The S&P 500 traded within a narrow range in the upper 3700s during the session, remaining in the neighborhood of the lower boundary of the target price range for the rise that began on June 17. Wave C{-12} within an upward correction, wave 4{-11}, is still underway. I’ve updated the chart.

12:40 p.m. New York time

FDX earnings play entry. I’ve entered a short bull put vertical spread on FDX, using options that trade for the last time on July 15, and have posted an analysis of the trade.

9:35 a.m. New York time

What’s happening now? The S&P 500 E-mini futures fell and rose again in overnight trading, staying within a fairly narrow range at the lower boundary of the target price range of the rise that began on June 17. The target range is marked on the chart by dashed lines.

What does it mean? The third and likely final segment of the upward correction that began on June 14 is still underway. Internally, the segment will have five subwaves and is now nearing completion the 3rd wave.

What are the alternatives? There are two.

Alternative #1: It’s possible that yesterday’s peak, 3805.50, was the end of the correction and the subsequent decline, the resumption of the downtrend that began on June 2.

Alternative #2: Or, 3805.50 may have ended the first three-wave corrective pattern within a compound correction, which strings together two or three corrective patterns.

[S&P 500 E-mini futures at 3:30 p.m., 160-minute bars, with volume]

What does Elliott wave theory say? Under the principal analysis, yesterday’s peak, 3805.50, is the end of wave 5{-14} within wave 3{-13} within the third segment, C{-12}, of the upward correction, 4{-11} that began on June 14. The subsequent decline is part of wave 4{-13}.

Under the first alternative analysis, yesterday’s high is the end of the upward correction, wave 4{-11}, and the subsequent decline is a first tentative step in wave 5{-11}, which resumes the downtrend.

Under the second alternative analysis, wave 4{-11} is forming a compound structure. Yesterday’s high ended wave C{-12}, but the the parent, wave 4{-11}, is still underway. The decline off of that high is the beginning of wave X{-12}, connecting the first corrective pattern with a second one that is yet to come.

Whichever scenario plays out, when wave 5{-11} ends, it will also mark the end of the larger downtrending wave 3{-10}, which began on June 2, within wave 5{-9}, which began on May 30. When wave 3{-10} is complete, it will be followed by an upward correction, wave 4{-10}, which will be larger than the present wave 4{-11} upward correction.

We Are Here.

These are the waves currently in progress under my principal analysis. Each line on the list shows the wave number, with the subscript in curly brackets, the traditional degree name, the starting date, the starting price of the S&P 500 E-mini futures, and the direction of the wave.

  • S&P 500 Index:
  • 5{+3} Supercycle, 7/8/1932, 4.40 (up)
  • 5{+2} Cycle, 12/9/1974, 60.96 (up)
  • 5{+1} Primary, 3/6/2009, 666.79 (up)
  • 5{0} Intermediate, 12/26/2018, 2346.58 (up)
  • 4{-1} Minor, 1/4/2022 4818.62 (down)
  • 1{-2} Minute, 1/4/2022 4818.62 (down)
  • S&P 500 Futures and index:
  • 1{-3} Minuette, 1/4/2022, 4808.25 (down) (futures), 4818.62 (down) (index)
  • S&P 500 Futures:
  • 1{-4} Subminuette, 1/4/2022, 4808.25 (down)
  • 1{-5} Micro, 1/4/2022, 4808.25 (down)
  • 1{-6} Submicro, 1/4/2022, 4808.25 (down)
  • 5{-7} Minuscule, 3/29/2022, 4631 (down)
  • 5{-8} Subminuscule, 4/21/2022, 4509, (down)

Learning and other resources. Elliott wave analysis provides context, not prophecy. As the 20th century semanticist Alfred Korzybski put it in his book Science and Sanity (1933), “The map is not the territory … The only usefulness of a map depends on similarity of structure between the empirical world and the map.” And I would add, in the ever-changing markets, we can judge that similarity of structure only after the fact.

See the menu page Analytical Methods for a rundown on where to go for information on Elliott wave analysis.

By Tim Bovee, Portland, Oregon, June 23, 2022

Disclaimer

Tim Bovee, Private Trader tracks the analysis and trades of a private trader for his own accounts. Nothing in this blog constitutes a recommendation to buy or sell stocks, options or any other financial instrument. The only purpose of this blog is to provide education and entertainment.

No trader is ever 100 percent successful in his or her trades. Trading in the stock and option markets is risky and uncertain. Each trader must make trading decisions for his or her own account, and take responsibility for the consequences.

License
Creative Commons License

All content on Tim Bovee, Private Trader by Timothy K. Bovee is licensed under a Creative Commons Attribution-ShareAlike 4.0 International License.

Based on a work at www.timbovee.com.

Trader’s Notebook

3:30 p.m. New York time

Half an hour before the closing bell. The S&P 500 has risen during the session, returning to the upper 3700s on the futures. The rise can be counted as wave 5{-13}, the final wave within wave C{-12}, which in turn is the final wave within the wave 4{-11} upward correction, which began on June 14. I’ve updated the chart.

9:35 a.m. New York time

What’s happening now? The S&P 500 E-mini futures fell in overnight trading, returning to the low 3700s.

What does it mean? The downward movement is the fourth of five segments within the final rise of an upward correction that began on June 14. When that final rise is complete, the downtrend that began on June 2 from 4189 likely will resume, unless the correction forms a compound structure linking several corrective patterns together.

What is the alternative? The upward correction is small in comparison with the larger downtrend that it is correcting. That raises the possibility that the correction is of a lower degree than I’ve it on the chart.

[S&P 500 E-mini futures at 3:30 p.m., 160-minute bars, with volume]

What does Elliott wave theory say? The upward correction is wave 4{-11} within a downtrend, wave 3{-10}. Within the 4th wave, the last of three waves, C{-12}, is underway. The C wave will have five internal waves. By my principal count, the 5th wave — wave 5{-13} — is now in progress.

Wave 4{-13} will be followed by the final wave in the corrective pattern, rising wave 5{-13}, whose end point will also mark the end of the parent, wave C{-12}, and perhaps of the upward correction, wave 4{-11}. I’m hedging the end point of wave 4{-11} because it’s possible that the correction will form a compound structure, containing two or three corrective patterns, each separated by a connector, wave X.

In any case, once wave 4{-11} is complete, wave 5{-11} will begin, a downtrending wave that is the final segment of wave 3{-10}, a downtrend that began on June 2.

My alternative analysis recognizes the possibility that what I’ve called wave 4{-11} is actually one degree small, wave 4{-12}. The A wave within 4{-11} is only 134.50 points long, and the entire upward correction so far is only 204 points long — low to high. By contrast, the preceding downtrending wave, 3{-10}, is 481 points long from its starting point to the presumed start of wave 4{-11}. It doesn’t break any rule of Elliott wave analysis, but it’s a weak correction.

On the other hand, the high point of 4{-11} so far is within the 4th subwave of wave 3{-11}, which precedes it, and that’s one of the tendencies of 4th waves identified in Elliott wave theory.

All of this is happening within wave 5{-9}, which began on May 30, within wave 5{-8}, beginning on April 21, within 5{-7}, beginning on March 29, within wave 1{-6}, which began on January 4.

We Are Here.

These are the waves currently in progress under my principal analysis. Each line on the list shows the wave number, with the subscript in curly brackets, the traditional degree name, the starting date, the starting price of the S&P 500 E-mini futures, and the direction of the wave.

  • S&P 500 Index:
  • 5{+3} Supercycle, 7/8/1932, 4.40 (up)
  • 5{+2} Cycle, 12/9/1974, 60.96 (up)
  • 5{+1} Primary, 3/6/2009, 666.79 (up)
  • 5{0} Intermediate, 12/26/2018, 2346.58 (up)
  • 4{-1} Minor, 1/4/2022 4818.62 (down)
  • 1{-2} Minute, 1/4/2022 4818.62 (down)
  • S&P 500 Futures and index:
  • 1{-3} Minuette, 1/4/2022, 4808.25 (down) (futures), 4818.62 (down) (index)
  • S&P 500 Futures:
  • 1{-4} Subminuette, 1/4/2022, 4808.25 (down)
  • 1{-5} Micro, 1/4/2022, 4808.25 (down)
  • 1{-6} Submicro, 1/4/2022, 4808.25 (down)
  • 5{-7} Minuscule, 3/29/2022, 4631 (down)
  • 5{-8} Subminuscule, 4/21/2022, 4509, (down)

Learning and other resources. Elliott wave analysis provides context, not prophecy. As the 20th century semanticist Alfred Korzybski put it in his book Science and Sanity (1933), “The map is not the territory … The only usefulness of a map depends on similarity of structure between the empirical world and the map.” And I would add, in the ever-changing markets, we can judge that similarity of structure only after the fact.

See the menu page Analytical Methods for a rundown on where to go for information on Elliott wave analysis.

By Tim Bovee, Portland, Oregon, June 22, 2022

Disclaimer

Tim Bovee, Private Trader tracks the analysis and trades of a private trader for his own accounts. Nothing in this blog constitutes a recommendation to buy or sell stocks, options or any other financial instrument. The only purpose of this blog is to provide education and entertainment.

No trader is ever 100 percent successful in his or her trades. Trading in the stock and option markets is risky and uncertain. Each trader must make trading decisions for his or her own account, and take responsibility for the consequences.

License
Creative Commons License

All content on Tim Bovee, Private Trader by Timothy K. Bovee is licensed under a Creative Commons Attribution-ShareAlike 4.0 International License.

Based on a work at www.timbovee.com.

Trader’s Notebook

3:30 p.m. New York time

Half an hour before the closing bell. The S&P 500 continued to rise to the session, reaching the high 3700s on the futures. Wave C{-12} continues its upward course, within an upward correction, wave 4{-11}. I’ve updated the chart.

9:35 a.m. New York time

What’s happening now? The S&P 500 E-mini futures rose in overnight trading, returning to the mid-3700s.

What does it mean? The final leg of an upward correction that began on June 14 has begun.

What are the alternatives? But where should the correction’s inner structure be placed in regard to the correction itself? I’ve labeled the inner structure as one size below the correction. It may be smaller. More on this in the Elliott wave theory section, below.

[S&P 500 E-mini futures at 3:30 p.m., 160-minute bars, with volume]

What does Elliott wave theory say? Under the principal analysis, the June 17 low, 3639, marked the end of downward wave B{-12} within an upward correction, wave 4{-11}. Rising wave C{-12} is now underway.

The wave 4{-11} correction is taking the form of a Flat — three interior waves, with A having three subwaves; B, three subwaves; and C, five subwaves (3-3-5). In a Flat, C waves tend to be 100% to 165% as long as the preceding A wave. Wave A{-12} was 134.50 points long, and so the price target for wave C{-12} is between 134.50 points and 221.93 points above the C wave starting point, 3639. This gives a price target range of 3773.50 to 3860.93.

I’ve marked the lower and upper price target limits on the chart with dashed lines.

Under the alternative analysis, wave C{-12} is relabeled as wave C{-13}, the 3rd and final wave within wave A{-12}, which began on June 14. Basically, this pushes the the A-B-C pattern of the principal analysis one degree lower.

Wave 4{-11} is the next-to-the-last wave within downtrending wave 3{-10}, which began on June 2 from 4169. When complete, wave 5{-11} will carry the price down further, perhaps to a significant degree.

Wave 3{-10} is a subwave of wave 3{-9}, which began on May 4, within wave 5{-8}, which began on April 21 from 4509, within wave 5{-7}, which began on March 29 from 4631, within wave 1{-6}, the initial wave of a large downtrend that began on January 4 from 4808.25.

We Are Here.

These are the waves currently in progress under my principal analysis. Each line on the list shows the wave number, with the subscript in curly brackets, the traditional degree name, the starting date, the starting price of the S&P 500 E-mini futures, and the direction of the wave.

  • S&P 500 Index:
  • 5{+3} Supercycle, 7/8/1932, 4.40 (up)
  • 5{+2} Cycle, 12/9/1974, 60.96 (up)
  • 5{+1} Primary, 3/6/2009, 666.79 (up)
  • 5{0} Intermediate, 12/26/2018, 2346.58 (up)
  • 4{-1} Minor, 1/4/2022 4818.62 (down)
  • 1{-2} Minute, 1/4/2022 4818.62 (down)
  • S&P 500 Futures and index:
  • 1{-3} Minuette, 1/4/2022, 4808.25 (down) (futures), 4818.62 (down) (index)
  • S&P 500 Futures:
  • 1{-4} Subminuette, 1/4/2022, 4808.25 (down)
  • 1{-5} Micro, 1/4/2022, 4808.25 (down)
  • 1{-6} Submicro, 1/4/2022, 4808.25 (down)
  • 5{-7} Minuscule, 3/29/2022, 4631 (down)
  • 5{-8} Subminuscule, 4/21/2022, 4509, (down)

Learning and other resources. Elliott wave analysis provides context, not prophecy. As the 20th century semanticist Alfred Korzybski put it in his book Science and Sanity (1933), “The map is not the territory … The only usefulness of a map depends on similarity of structure between the empirical world and the map.” And I would add, in the ever-changing markets, we can judge that similarity of structure only after the fact.

See the menu page Analytical Methods for a rundown on where to go for information on Elliott wave analysis.

By Tim Bovee, Portland, Oregon, June 21, 2022

Disclaimer

Tim Bovee, Private Trader tracks the analysis and trades of a private trader for his own accounts. Nothing in this blog constitutes a recommendation to buy or sell stocks, options or any other financial instrument. The only purpose of this blog is to provide education and entertainment.

No trader is ever 100 percent successful in his or her trades. Trading in the stock and option markets is risky and uncertain. Each trader must make trading decisions for his or her own account, and take responsibility for the consequences.

License
Creative Commons License

All content on Tim Bovee, Private Trader by Timothy K. Bovee is licensed under a Creative Commons Attribution-ShareAlike 4.0 International License.

Based on a work at www.timbovee.com.

Trader’s Notebook

10:50 a.m. New York time

What’s happening now? The S&P 500 E-mini futures traded in a narrow range during overnight trading and into the Juneteenth holiday in the United States. U.S. stock and bond markets are closed for the holiday. The price has fluctuated narrowly so far, with a range covering slightly less than 50 points.

What does it mean? The declining middle leg of a short-term upward correction that began on June 14 is underway. It will be followed by a rising final wave that will complete the corrective pattern — a Flat — and most likely the entire correction. Afterward, the downtrend that began on June 2 will resume.

What are the alternatives? As usual, there’s a bit of ambiguity in where each movement fits within the fractal structure of market movements. Lower degree? Higher degree? It’s often hard to say. So Friday’s low, 3639, could well mark the end of the middle leg of the correction. A strong push to the upside will increase the odds that the final leg is underway.

[S&P 500 E-mini futures at 10:50 a.m., 150-minute bars, with volume]

What does Elliott wave theory say? The correction is wave 4{-11} within wave 3{-10}. The decline that began on June 15 from 3843 is wave B{-12} within that 4th wave Flat correction. Wave B{-12} will be followed by wave C{-12} to the upside. C waves typically are 100% to 165% as long as the preceding A wave, which covered 134.5 points.

This is all happening within wave 5{-9}, which began on May 30 from 42.02.25; within wave 5{-8}, which began on April 21 from 4509; within wave 5{-7}, which began on March 29 from 4631. All of those parent waves are downtrending.

We Are Here.

These are the waves currently in progress under my principal analysis. Each line on the list shows the wave number, with the subscript in curly brackets, the traditional degree name, the starting date, the starting price of the S&P 500 E-mini futures, and the direction of the wave.

  • S&P 500 Index:
  • 5{+3} Supercycle, 7/8/1932, 4.40 (up)
  • 5{+2} Cycle, 12/9/1974, 60.96 (up)
  • 5{+1} Primary, 3/6/2009, 666.79 (up)
  • 5{0} Intermediate, 12/26/2018, 2346.58 (up)
  • 4{-1} Minor, 1/4/2022 4818.62 (down)
  • 1{-2} Minute, 1/4/2022 4818.62 (down)
  • S&P 500 Futures and index:
  • 1{-3} Minuette, 1/4/2022, 4808.25 (down) (futures), 4818.62 (down) (index)
  • S&P 500 Futures:
  • 1{-4} Subminuette, 1/4/2022, 4808.25 (down)
  • 1{-5} Micro, 1/4/2022, 4808.25 (down)
  • 1{-6} Submicro, 1/4/2022, 4808.25 (down)
  • 5{-7} Minuscule, 3/29/2022, 4631 (down)
  • 5{-8} Subminuscule, 4/21/2022, 4509, (down)

Learning and other resources. Elliott wave analysis provides context, not prophecy. As the 20th century semanticist Alfred Korzybski put it in his book Science and Sanity (1933), “The map is not the territory … The only usefulness of a map depends on similarity of structure between the empirical world and the map.” And I would add, in the ever-changing markets, we can judge that similarity of structure only after the fact.

See the menu page Analytical Methods for a rundown on where to go for information on Elliott wave analysis.

By Tim Bovee, Portland, Oregon, June 20, 2022

Disclaimer

Tim Bovee, Private Trader tracks the analysis and trades of a private trader for his own accounts. Nothing in this blog constitutes a recommendation to buy or sell stocks, options or any other financial instrument. The only purpose of this blog is to provide education and entertainment.

No trader is ever 100 percent successful in his or her trades. Trading in the stock and option markets is risky and uncertain. Each trader must make trading decisions for his or her own account, and take responsibility for the consequences.

License
Creative Commons License

All content on Tim Bovee, Private Trader by Timothy K. Bovee is licensed under a Creative Commons Attribution-ShareAlike 4.0 International License.

Based on a work at www.timbovee.com.

Bitcoin Analysis

5:25 p.m. New York time

What’s happening now? USD/BTC continued the sharp decline that began on on May 31 from 32,455, reaching 20,025 on the Bitcoin futures as evening approached in the eastern United States.

What does it mean? The decline is the final segment of a larger downtrend that began on March 28 from 48,575. When the present decline completes the larger downtrend, it will be followed by an upward correction that likely will carry the price back up to the 25,300s and perhaps as high as the 32,400s. The upward correction will be followed by a resumption of the downtrend that will carry the price back to the low 20,000s and perhaps significantly lower.

What’s the alternative? The big unknown on this chart is timing. The decline from March 28 to the present has taken 81 days. The upward correction that followed could be significantly shorter or longer, and that uncertainty is also true of the decline that will follow the correction.

[USD/BTC futures at 5:25 p.m., daily bars, with volume]

What does Elliott wave theory say? The sharp decline that began on May 31 is downtrending wave 5{-4} within downtrending wave 3{-3}. The 5th wave is the final subwave of the parent 3rd subwave. Fifth waves have no limits. They can be surprisingly short or incredibly long, and every other variant in between. Under the rules of Elliott wave analysis, there’s no way to judge just how bad the losses will be going forward.

The end of wave 5{-4} will also complete wave 3{-3}, which will be followed by an upward correction, wave 4{-4}. Fourth waves tend to form a three-wave Flat pattern. In a Flat, waves A and B each have three subwaves, and wave C has five subwaves.

A 4th wave tends to end in the 4th subwave within the preceding 3rd wave. On the Bitcoin chart that would be wave 4{-4} of wave 3{-3}, which began on May 12 at 25,350 and reached a peak on May 31 of 32,455. I’ve used the hedge-word “tends” because that target price range is a tendency, not a firm rule of Elliott wave theory. Things could go quite differently.

With the beginning of the 4th wave the uncertainties mount. For example, the correction can take different forms, such as a Zigzag or a variety of Triangle, each with its own subwave counts. It can string together two or three corrective patterns, stretching the time taken by the correction.

Long story short: If wave 4{-3} is typical, the largest recovery we an expect will carry the price up to 32,455, more or less.

Looking further ahead, the bad expectation is that wave 4{-3} will be followed by a larger downtrending 5th wave than the present one. Wave 5{-3}, which will carry Bitcoin to new lows.

The good expectation is that the completion of wave 5{-3} will likely mark the end of wave C{-2}, which began on November 10, 2021 from 48,575, and the C wave’s parent, wave 4{-1}, a massive downward correction that began on April 14, 2021 from 65,520.

Note that I’ve used another of those annoying hedge-words, another “likely”. It’s possible that wave 4{-1} will form a compound structure, containing two or three corrective structures.

Wave 4{-1} will be followed by an uptrend, wave 5{-1}, which is likely to carry the price above 65,520, and perhaps significantly higher. As I noted earlier in this discussion, 5th waves sometimes come up short — “truncation” in the terminology of Elliott wave analysis. If this should happen, then wave 5{-1} will end below 65,520.

Bottom line: The present decline will be followed by a rise, but it is likely to be shallow, perhaps reaching only the low 32,000s. It will be followed by a soul-crushing decline that will burn any optimism out of the Bitcoin market. But if the rules of Elliott wave analysis hold true, ultimately, almost certainly years down the road, Bitcoin will recover.

We Are Here.

These are the waves currently in progress under my principal analysis. Each line on the list shows the wave number, with the subscript in curly brackets, the traditional degree name, the starting date, the starting price of the S&P 500 E-mini futures, and the direction of the wave.

  • Futures:
  • 5{0} Intermediate, 12/14/2018, 3,120 (up)
  • 4{-1} Minor, 4/14/2021, 65,520 (down)
  • C{-2} Minute, 11/10/2021, 69,355 (down)
  • 3{-3} Minuette, 3/28/2022, 46,550 (down)

Learning and other resources. Elliott wave analysis provides context, not prophecy. As the 20th century semanticist Alfred Korzybski put it in his book Science and Sanity (1933), “The map is not the territory … The only usefulness of a map depends on similarity of structure between the empirical world and the map.” And I would add, in the ever-changing markets, we can judge that similarity of structure only after the fact.

See the menu page Analytical Methods for a rundown on where to go for information on Elliott wave analysis.

By Tim Bovee, Portland, Oregon, June 17, 2022

Disclaimer

Tim Bovee, Private Trader tracks the analysis and trades of a private trader for his own accounts. Nothing in this blog constitutes a recommendation to buy or sell stocks, options or any other financial instrument. The only purpose of this blog is to provide education and entertainment.

No trader is ever 100 percent successful in his or her trades. Trading in the stock and option markets is risky and uncertain. Each trader must make trading decisions for his or her own account, and take responsibility for the consequences.

License
Creative Commons License

All content on Tim Bovee, Private Trader by Timothy K. Bovee is licensed under a Creative Commons Attribution-ShareAlike 4.0 International License.

Based on a work at www.timbovee.com.

Trader’s Notebook

Markets closed on Monday. U.S. markets will be closed on Monday for the Juneteenth holiday. Often the S&P 500 E-mini futures will trade overnight on holidays, and if that’s the case for Juneteenth, then I shall post an analysis in the morning.

3:30 p.m. New York time

Half an hour before the closing bell. The S&P 500 fell during the session, reaching 3639 on the futures before rising slightly. This morning’s alternative analysis is now the new principal analysis: Downward wave B{-12} within an upward correction, wave 4{-11}, is still underway, on the third day after it began. Internally, wave B{-12} is in its 3rd and final leg. I’ve updated the chart.

11:20 a.m. New York time

Alternative analysis proven correct. The S&P 500 fell below Thursday’s low on the futures, 3708.50, to 3639. This validates the alternative analysis: Wave B{-12} to the downside is still underway, and wave C{-12} has not yet begun. I’ve updated the chart, changing the wave labels and removing the wave C{-12} price target lines.

9:35 a.m. New York time

What’s happening now? The S&P 500 E-mini futures reversed to the upside in overnight trading, rising from the mid-3600s back into the upper 3600s.

What does it mean? Yesterday’s low was 8.5 points below the price target for the decline that began on June 15, strengthening the argument that the subsequent rise was the beginning of a small upward correction of the decline that ran from June 2 to June 16. The rise will likely move above the June 15 high of 3843 and could move above 4000.

What are the alternatives? The overnight rise hasn’t gone far, and it’s possible that it is a still smaller correction within the downtrend rather than correcting the June 2 to June 16 decline.

[S&P 500 E-mini futures at 3:30 p.m., 150-minute bars, with volume]

What does Elliott wave theory say? Under the principal analysis, the overnight law was the end of wave B{-12}, the middle wave of a Flat corrective pattern within the parent wave 4{-11}. The subsequent rise is the beginning of wave C{-12}. Under the Elliott wave guidelines, a C wave tends to retrace 100% to 165% of the preceding A wave. Wave A{-12} was 134.50 points long, giving a price target range of 3843 to 4064.93. I’ve marked the C-wave target range on the chart with gray dashed lines. I’ve retained the B-wave target, 3650.49, as a blue dashed line.

Under the alternative analysis, wave B{-12} is still underway, and the overnight rise is the start of wave B{-13}, the middle of three subwaves within B{-12}.

If the price continues to rise, then the principal analysis becomes more likely. If the price falls below 3708.50, then the alternative analysis is correct.

All of this is happening within wave 3{-10} within wave 5{-9}, a subwave of wave 5{-8} within wave 5{-7}, which began on March 29 from 4631.

We Are Here.

These are the waves currently in progress under my principal analysis. Each line on the list shows the wave number, with the subscript in curly brackets, the traditional degree name, the starting date, the starting price of the S&P 500 E-mini futures, and the direction of the wave.

  • S&P 500 Index:
  • 5{+3} Supercycle, 7/8/1932, 4.40 (up)
  • 5{+2} Cycle, 12/9/1974, 60.96 (up)
  • 5{+1} Primary, 3/6/2009, 666.79 (up)
  • 5{0} Intermediate, 12/26/2018, 2346.58 (up)
  • 4{-1} Minor, 1/4/2022 4818.62 (down)
  • 1{-2} Minute, 1/4/2022 4818.62 (down)
  • S&P 500 Futures and index:
  • 1{-3} Minuette, 1/4/2022, 4808.25 (down) (futures), 4818.62 (down) (index)
  • S&P 500 Futures:
  • 1{-4} Subminuette, 1/4/2022, 4808.25 (down)
  • 1{-5} Micro, 1/4/2022, 4808.25 (down)
  • 1{-6} Submicro, 1/4/2022, 4808.25 (down)
  • 5{-7} Minuscule, 3/29/2022, 4631 (down)
  • 5{-8} Subminuscule, 4/21/2022, 4509, (down)

Learning and other resources. Elliott wave analysis provides context, not prophecy. As the 20th century semanticist Alfred Korzybski put it in his book Science and Sanity (1933), “The map is not the territory … The only usefulness of a map depends on similarity of structure between the empirical world and the map.” And I would add, in the ever-changing markets, we can judge that similarity of structure only after the fact.

See the menu page Analytical Methods for a rundown on where to go for information on Elliott wave analysis.

By Tim Bovee, Portland, Oregon, June 17, 2022

Disclaimer

Tim Bovee, Private Trader tracks the analysis and trades of a private trader for his own accounts. Nothing in this blog constitutes a recommendation to buy or sell stocks, options or any other financial instrument. The only purpose of this blog is to provide education and entertainment.

No trader is ever 100 percent successful in his or her trades. Trading in the stock and option markets is risky and uncertain. Each trader must make trading decisions for his or her own account, and take responsibility for the consequences.

License
Creative Commons License

All content on Tim Bovee, Private Trader by Timothy K. Bovee is licensed under a Creative Commons Attribution-ShareAlike 4.0 International License.

Based on a work at www.timbovee.com.

Trader’s Notebook

3:30 p.m. New York time

Half an hour before the closing bell. The S&P 500 futures has fallen to the 3640s during the session, below the likely target price of wave B{-12}, 3650.49. Wave B{-12} is the middle of three waves in a Flat corrective pattern. When complete, it will be followed by a rise, wave C{-12}. The parent waves — upward correction wave 4{-11} within downtrending wave 3{-10} within downtrending wave 5{-9} — are stilll undeerway.

No change in the analysis. I’ve updated the chart.

11:05 a.m. New York time

How far down is down? I’ve updated the chart with a dashed line at 3650.49 showing the likely maximum decline of wave B{-12}, the middle segment of the upward correction now underway. Elliott wave theory says that B waves in a Flat pattern tend to retrace 100% to 138% of the preceding A wave, and the price on the futures have almost hit the 138% retracement mark.

9:35 a.m. New York time

What’s happening now? The S&P 500 E-mini futures, having risen 134.5 points on Thursday, resumed its downtrend overnight, falling 148 points from the prior session’s high.

What does it mean? The rise was the first segment of an upward correction within the larger downtrend that began on June 2, and the subsequent decline was the second segment of that correction.

What are the alternatives? The rise completed the upward correction and the final segment of the larger downtrend is underway. I think this is unlikely because the upward movement was uncommonly shallow, retracing only 28% of the decline that began on June 2. I would expect a greater retracement. Yet, this scenario isn’t impossible.

[S&P 500 E-mini futures at 3:30 p.m., 180-minute bars, with volume]

What does Elliott wave theory say? Yesterday’s upward correction is wave 4{-11} within wave 3{-10}, which began on June 2. Fourth waves usually form a Flat pattern, and downward wave B of a Flat can move below the end of the preceding 3rd wave. My principal analysis is based on that scenario. We can expect the B wave to be followed by an upward C wave that will complete the Flat pattern. When wave 4{-11} has reached completion, wave 5{-11} will carry the price down, perhaps by a significant distance, and will complete the parent wave 3{-10}.

The alternative analysis accounts for a scenario in which yesterday’s rise was the entirety of wave 4{-11}, and wave 5{-11} to the downside is now underway. As noted in the Alternative section, I think this scenario is unlikely.

If the price reverses quickly and exceeds yesterday’s high, 3843, the movement will confirm the principal analysis. If the price keeps falling in the five-wave pattern that’s normal for a trend, then the alternative analysis will be confirmed.

This is all happening within downtrending wave 5{-9}, which began on May 30 from 4202.25 and is the final wave within downtrending wave 5{-8}, which began on April 21 from 4509.

We Are Here.

These are the waves currently in progress under my principal analysis. Each line on the list shows the wave number, with the subscript in curly brackets, the traditional degree name, the starting date, the starting price of the S&P 500 E-mini futures, and the direction of the wave.

  • S&P 500 Index:
  • 5{+3} Supercycle, 7/8/1932, 4.40 (up)
  • 5{+2} Cycle, 12/9/1974, 60.96 (up)
  • 5{+1} Primary, 3/6/2009, 666.79 (up)
  • 5{0} Intermediate, 12/26/2018, 2346.58 (up)
  • 4{-1} Minor, 1/4/2022 4818.62 (down)
  • 1{-2} Minute, 1/4/2022 4818.62 (down)
  • S&P 500 Futures and index:
  • 1{-3} Minuette, 1/4/2022, 4808.25 (down) (futures), 4818.62 (down) (index)
  • S&P 500 Futures:
  • 1{-4} Subminuette, 1/4/2022, 4808.25 (down)
  • 1{-5} Micro, 1/4/2022, 4808.25 (down)
  • 1{-6} Submicro, 1/4/2022, 4808.25 (down)
  • 5{-7} Minuscule, 3/29/2022, 4631 (down)
  • 5{-8} Subminuscule, 4/21/2022, 4509, (down)

Learning and other resources. Elliott wave analysis provides context, not prophecy. As the 20th century semanticist Alfred Korzybski put it in his book Science and Sanity (1933), “The map is not the territory … The only usefulness of a map depends on similarity of structure between the empirical world and the map.” And I would add, in the ever-changing markets, we can judge that similarity of structure only after the fact.

See the menu page Analytical Methods for a rundown on where to go for information on Elliott wave analysis.

By Tim Bovee, Portland, Oregon, June 16, 2022

Disclaimer

Tim Bovee, Private Trader tracks the analysis and trades of a private trader for his own accounts. Nothing in this blog constitutes a recommendation to buy or sell stocks, options or any other financial instrument. The only purpose of this blog is to provide education and entertainment.

No trader is ever 100 percent successful in his or her trades. Trading in the stock and option markets is risky and uncertain. Each trader must make trading decisions for his or her own account, and take responsibility for the consequences.

License
Creative Commons License

All content on Tim Bovee, Private Trader by Timothy K. Bovee is licensed under a Creative Commons Attribution-ShareAlike 4.0 International License.

Based on a work at www.timbovee.com.