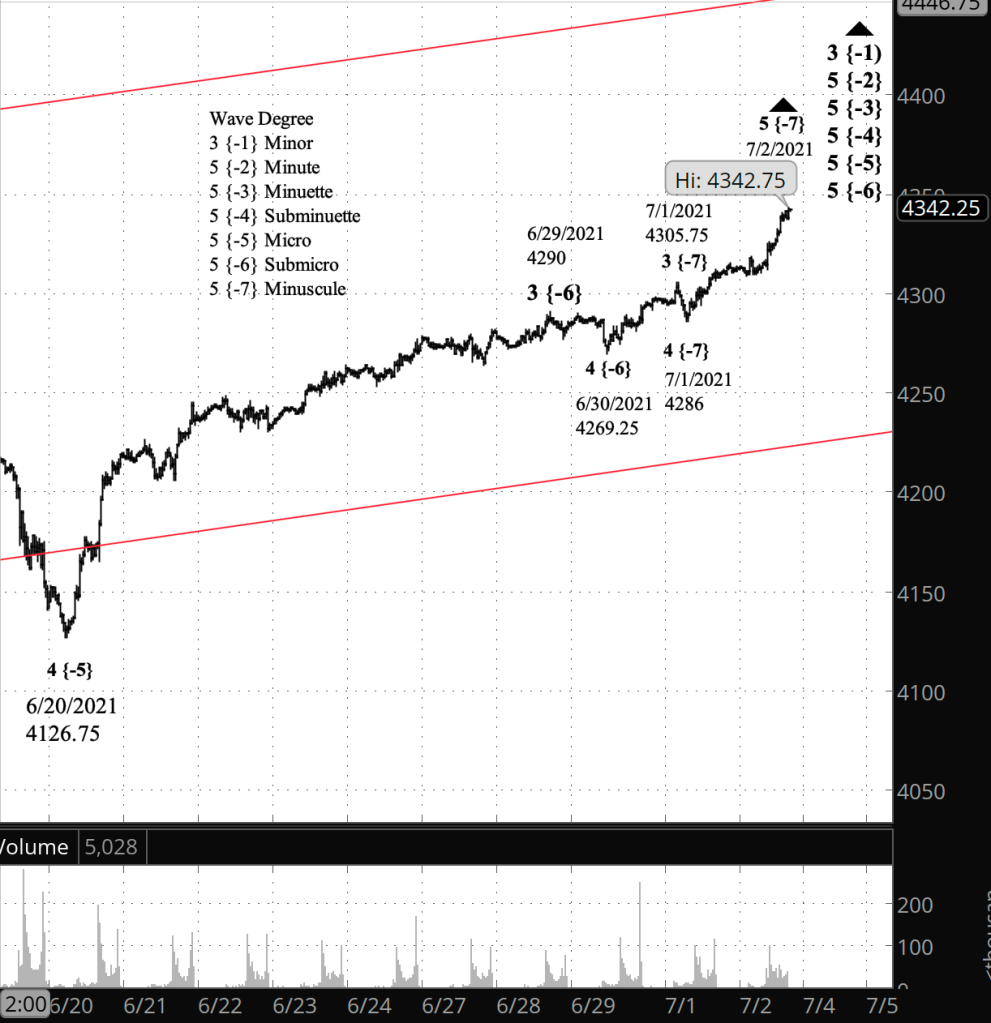
3:30 p.m. New York time
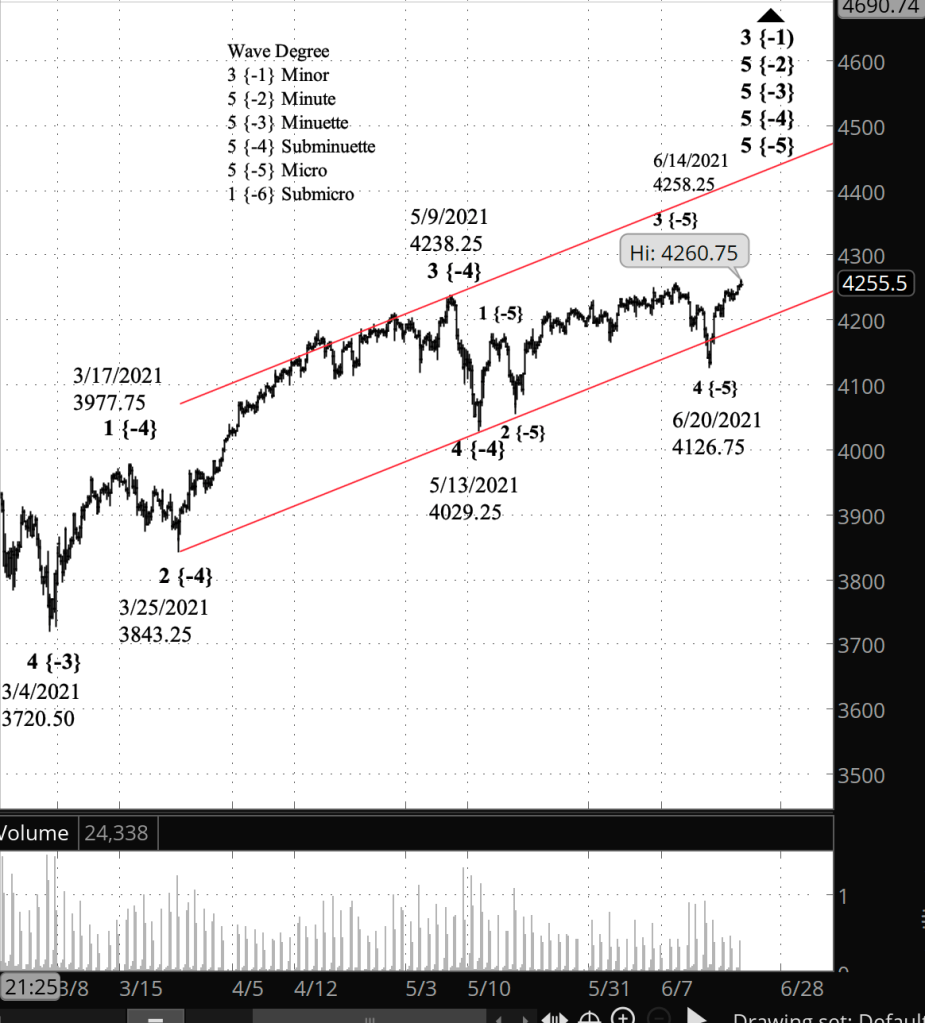
Half an hour before the closing bell. The S&P 500 pushed higher during the day, to 4342.75 so far on the futures (4351 on the index), as wave 5 of Micro degree, which began on June 20, continued its upward course. The principle analysis at the end of the day is that the Minor wave 3 uptrend that began in February 2020 is still underway and is in its last stages. The alternative analysis, as the peak-fishing continues, is that any fresh high can be the end of Minor wave 3 and its smaller child wave, Micro wave 5, since both have met the requirements for completion laid out by Elliott wave theory.
Rather than overwrite this morning’s chart, I’ve added a late-day look at the futures.
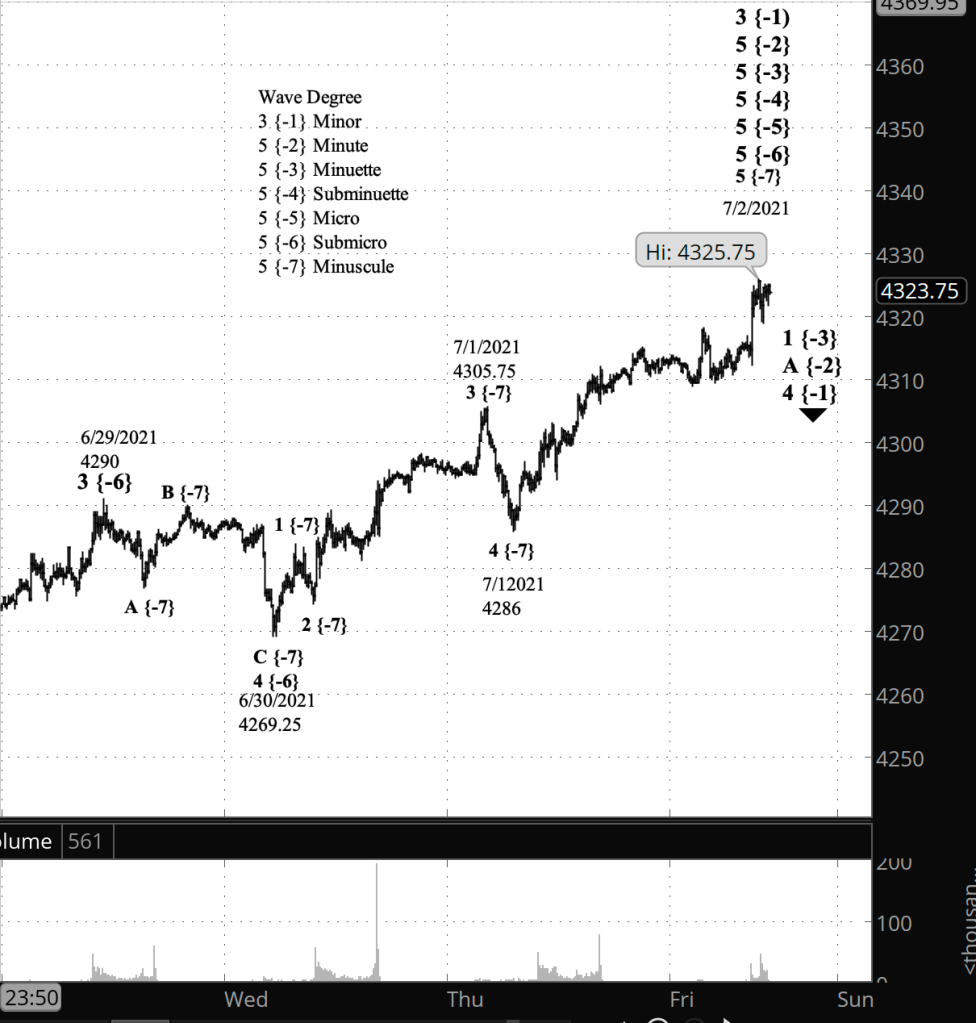
12:10 p.m. New York time
Fishing for a high. And the S&P 500 moved higher, meaning that my alternative analysis was correct. The index and it’s derivatives are fishing for higher highs. Wave 3 of Minor degree is still underway, as is its internal wave six levels down, wave 5 of Minuscule degree.
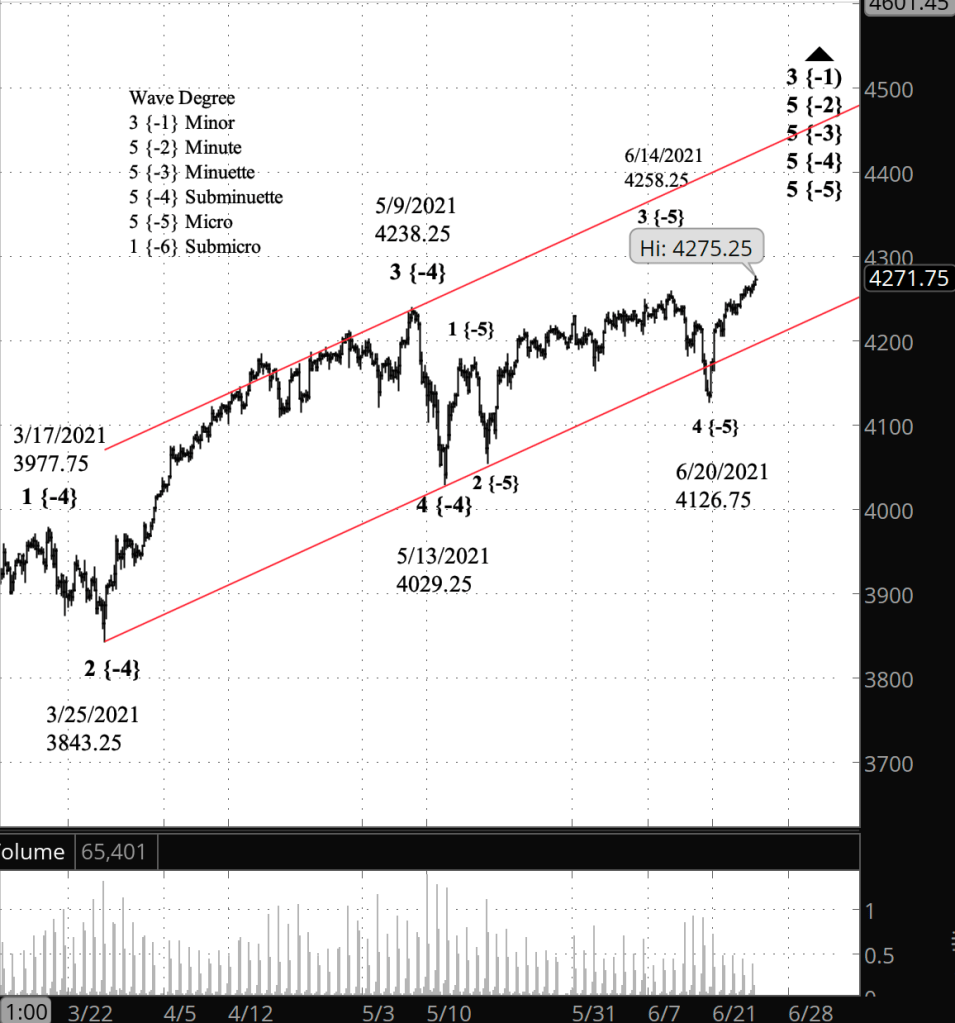
9:25 a.m. New York time
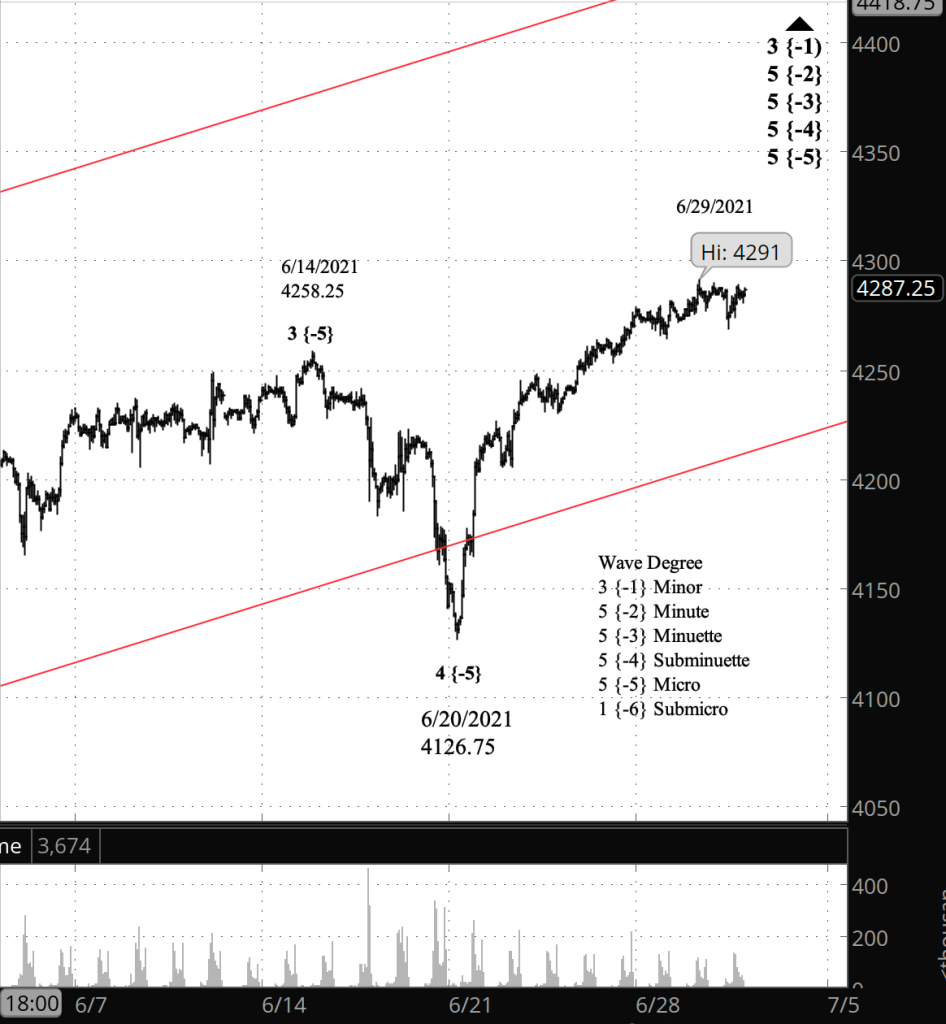
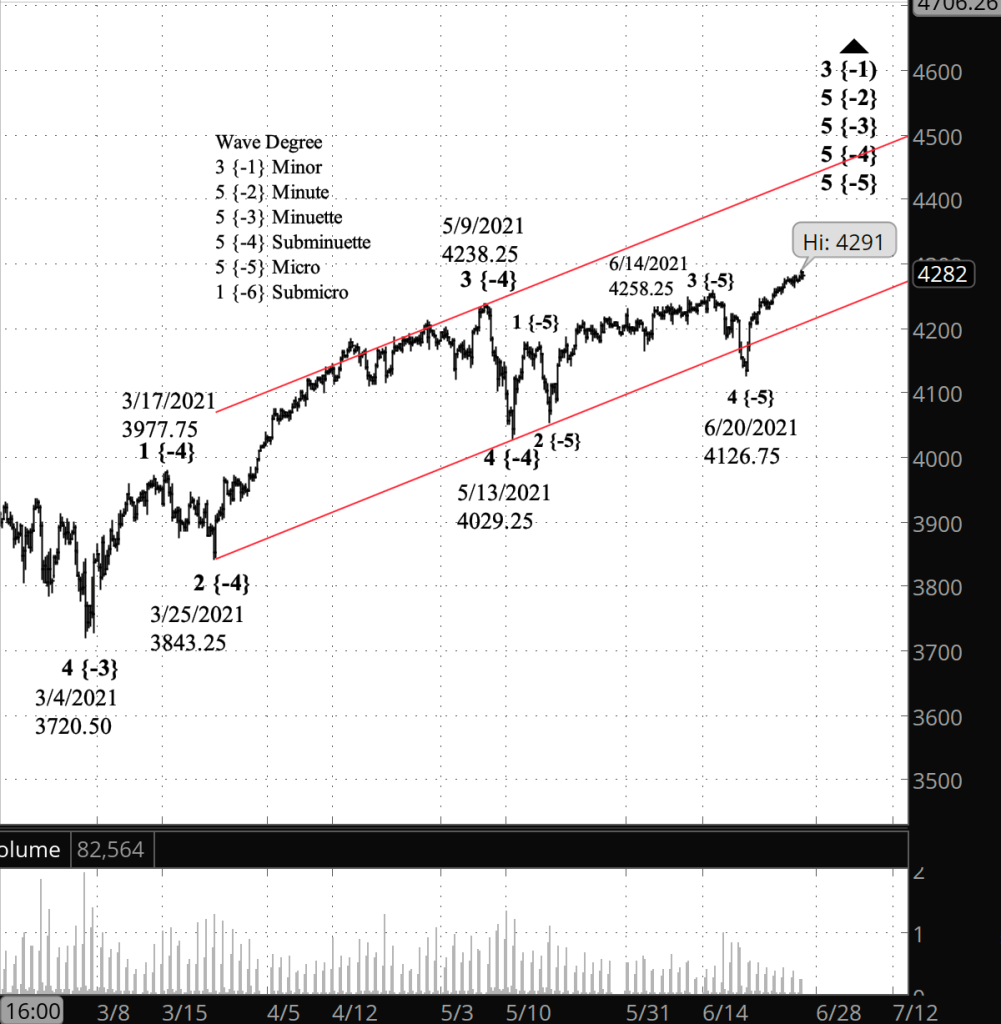
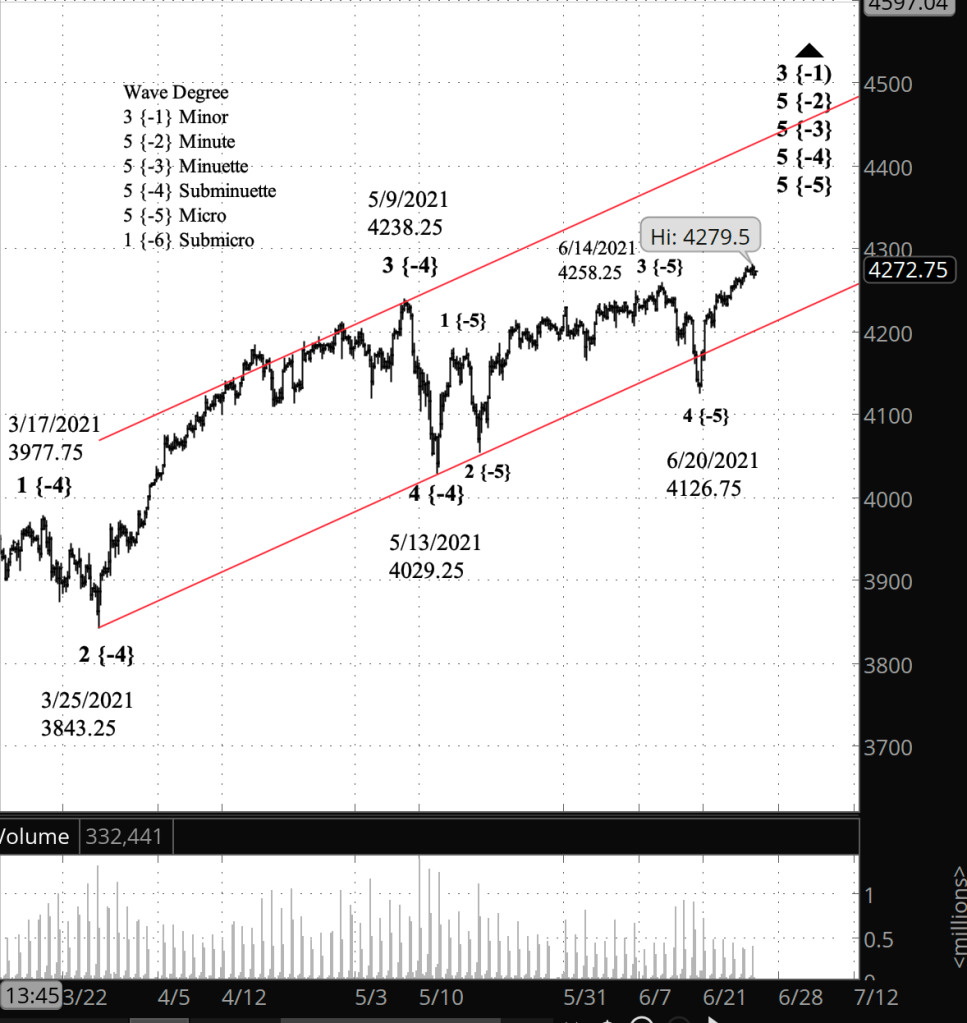
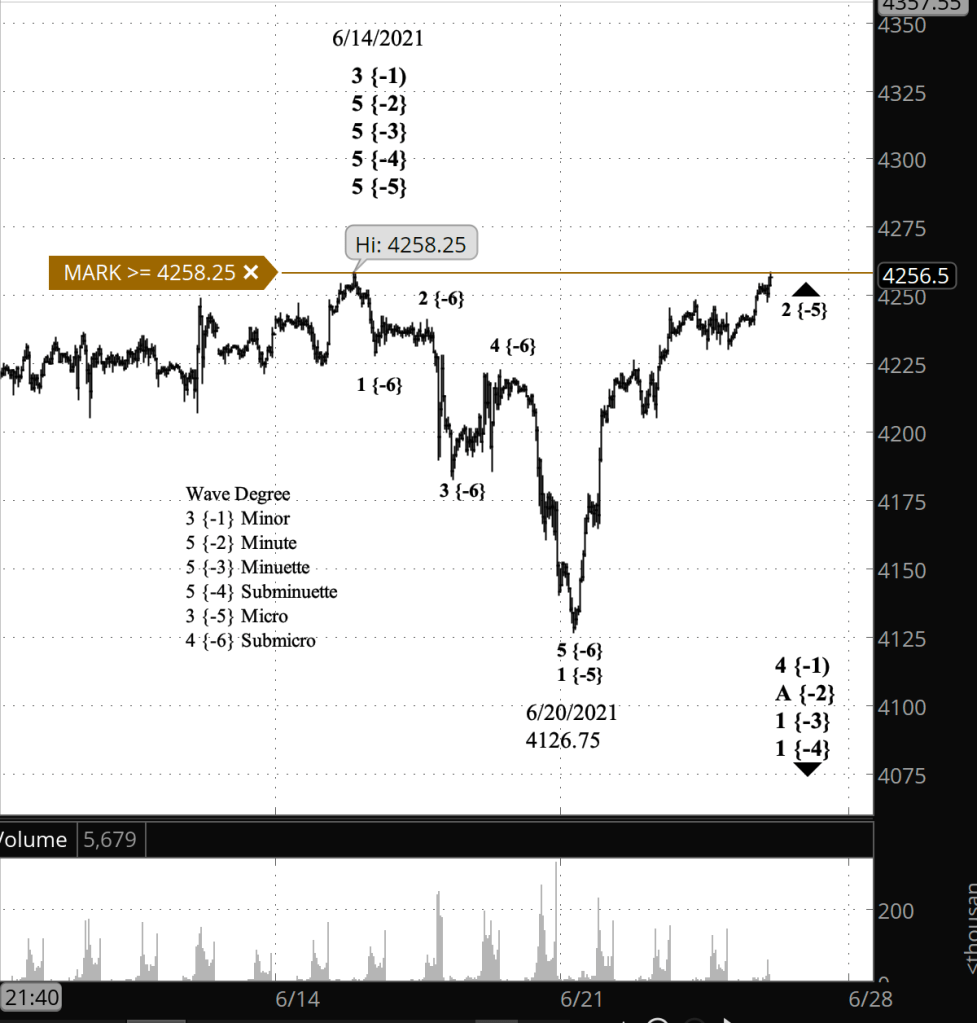
What’s happening now? The S&P 500 reached a higher high of 4325.75 on the E-mini futures shortly before the opening bell, and then reversed to the downside. Trading on the index opened a few minutes later and it quickly moved to a high of 4334.16.
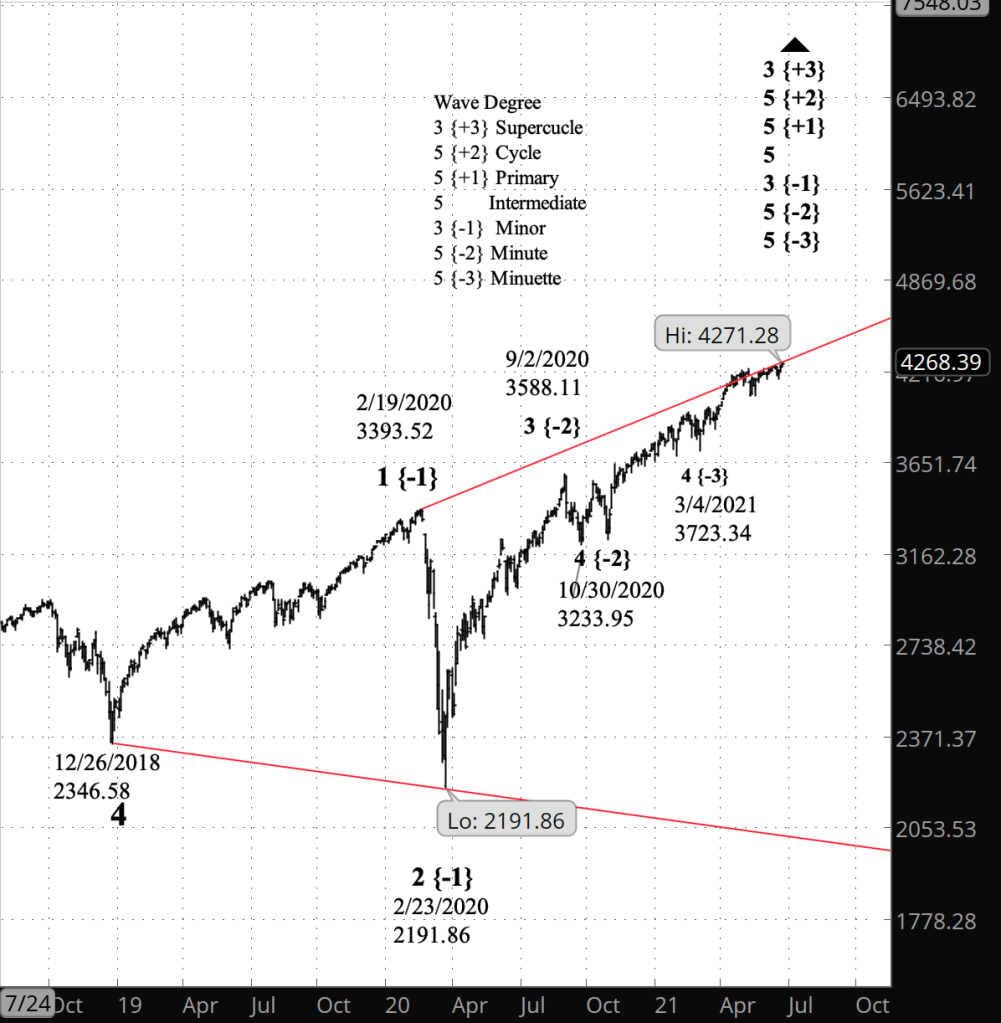
What does it mean? In analyzing the charts below, I’ve treated the morning peak as the end of the rise that began on February 23, 2020. The decline from the peak, although of a very small scale, was dramatic, with none of the wishy washy dawdling that we see when traders are uncertain whether to bid higher. If this principle analysis is indeed correct, then the 16-month rise that began in February of last year, is complete, and a major movement to the downside has begun. It will eventually carry the price down to below 2000, the lower boundary of an expanding triangle that began in December 2018.
What’s the alternative? If the price moves above 4325.75, then we’re back to a game of where’s the top, which we’ve been playing for the past few days. In this alternative analysis, the rise is still underway, and the principle analysis will be shelved as we await the start of the next downward movement in triangle.
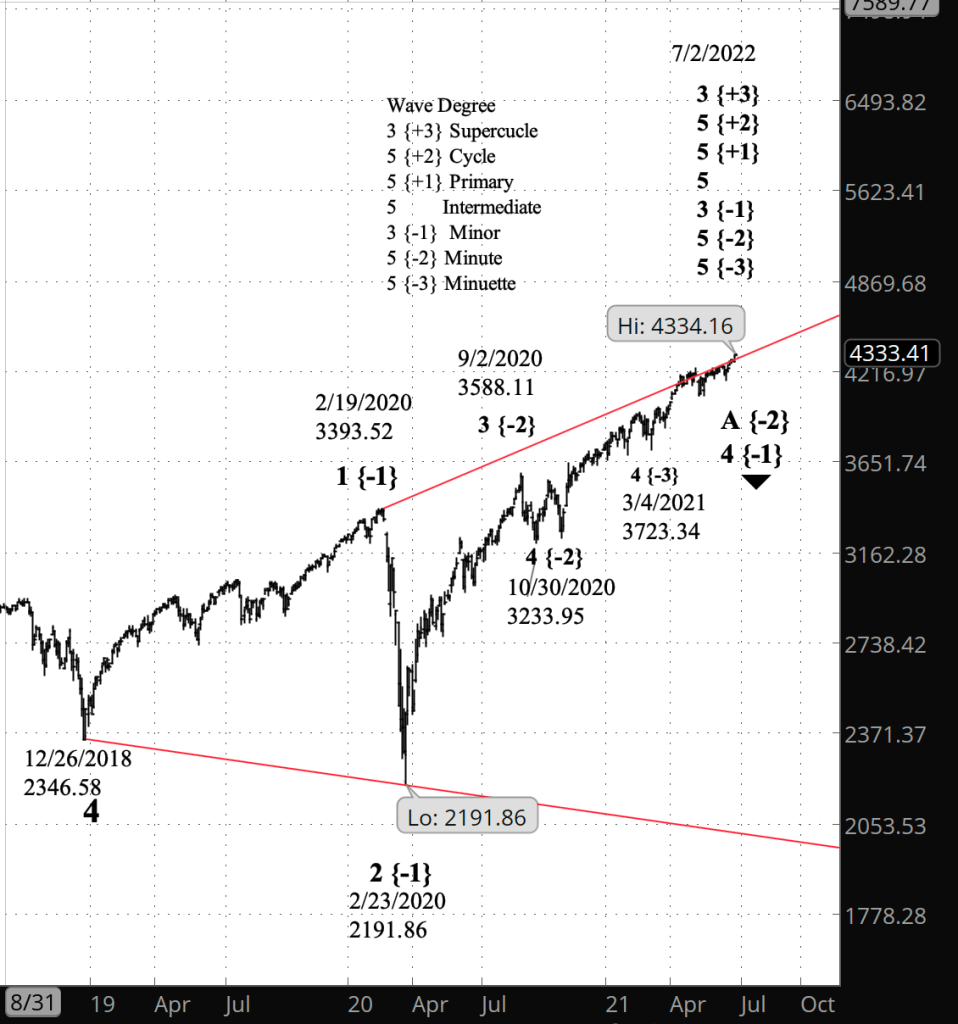
What does Elliott wave theory say? The large downward movement that began modestly after this morning’s high is wave 4 of Minor degree with an expanding diagonal triangle that is wave 5 of Intermediate degree, having begun on December 26, 2018. Diagonal triangles have five waves altogether, bouncing between two boundaries that over time grow further apart from one another. How low can it go? That’s a function of time; the longer it takes the price to reach the lower boundary, presently around 2020, the lower that boundary will have dropped.
Whether this principle analysis is indeed valid at this time depends upon the price remaining below this morning’s high, 4325.75 on the futures and 4334.16 on the index. If the price moves above those levels, then the alternative analysis kicks in: Minor wave 3 is still in progress, as it has been since it began on February 23, 2020, and the subsequent progress of the chart described in the present principle analysis will be deferred until Minor 3 ends.
Learning and other resources. See the menu page Analytical Methods for a rundown on where to go for information on Elliott wave analysis.
By Tim Bovee, Portland, Oregon, July 2, 2021
Disclaimer
Tim Bovee, Private Trader tracks the analysis and trades of a private trader for his own accounts. Nothing in this blog constitutes a recommendation to buy or sell stocks, options or any other financial instrument. The only purpose of this blog is to provide education and entertainment.
No trader is ever 100 percent successful in his or her trades. Trading in the stock and option markets is risky and uncertain. Each trader must make trading decisions for his or her own account, and take responsibility for the consequences.
License
All content on Tim Bovee, Private Trader by Timothy K. Bovee is licensed under a Creative Commons Attribution-ShareAlike 4.0 International License.
Based on a work at www.timbovee.com.

You must be logged in to post a comment.